


Tug of War!
The technicals - charts, positioning, money flows and historical analogs - have continued to paint a bullish picture while the fundamentals and economic foundation remain questionable. Let's dig in...
In many ways today’s note is a follow-up to Land of Confusion (here).
We wrote Land of Confusion nearly a month ago and we highlighted the constructive technical scenario within equities despite the complicated macro and fundamental backdrop.
Since that time, many of the factors we cited have continued to reflect weakness - employment (see here) has softened; Q3 earnings expectations (see chart 2 below) have moved lower; and the yield curve has “un-inverted” (often occurs before economic trouble begins) - at the same time, the S&P 500 has achieved new highs (chart 1) and valuation (chart 3) remains elevated.
While we still believe that a post-election rally (regardless of who wins) is likely, as we wrote at the beginning of June (here):
“We see the possibility (10-15% likelihood) of a 30% sell-off that would see the S&P 500 bottom around 4000-4200 in 2025 from a peak of 5500-5800 in 2024.”
Two weeks ago here, we noted that, in our view, the likelihood of a significant sell-off had increased to 20-30%.
Given our assessment that the market is resting on a questionable foundation, we are continuing to watch closely for any meaningful deterioration.
We have continued our strategy of remaining invested while tactically using puts and put spreads to hedge downside risk.
In terms of today’s song - there are several songs titled “Tug of War.”
The most famous “Tug of War” song is likely by Paul McCartney (from his “Tug of War” album). There is speculation that McCartney’s song is a description of his complex relationship with John Lennon, who had been killed two years prior to the song’s release.

1. The S&P 500 is Hitting New Highs = Bullish
Source: Trading View. Through year-to-date 2024.
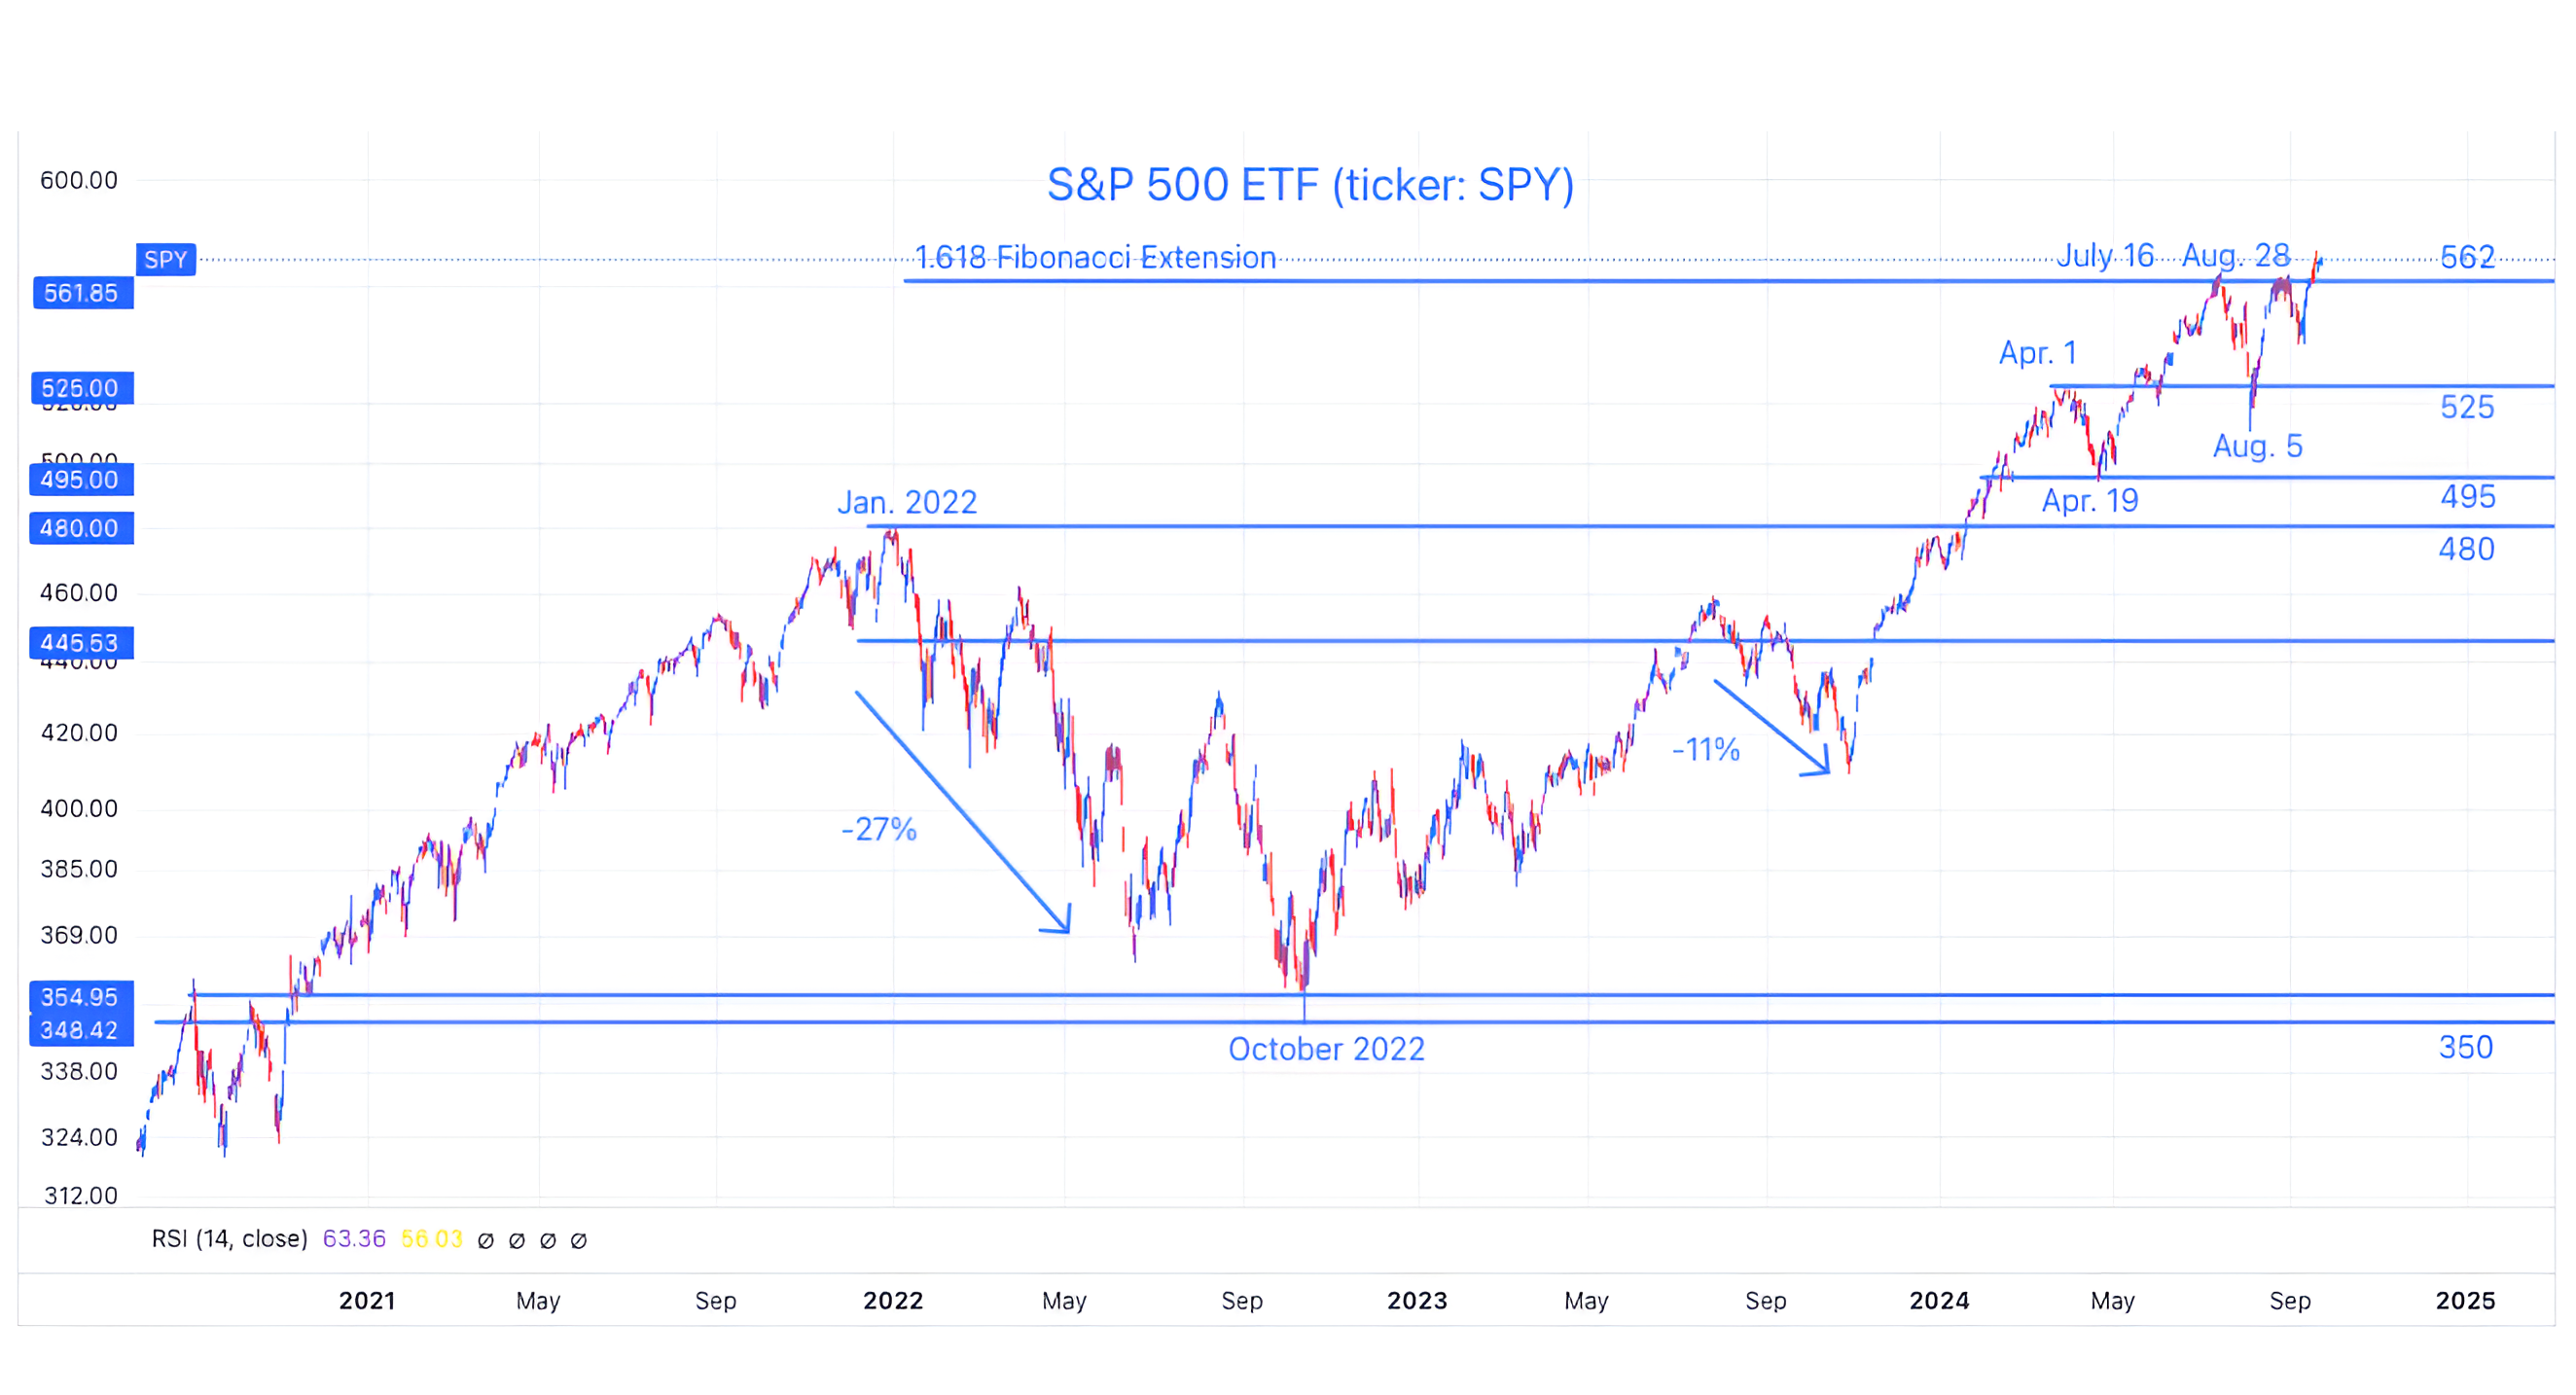
The chart above shows the S&P 500 ETF (ticker: SPY).
Unlike the Nasdaq 100 which has not made it back to its July peak (we showed this here), with last week’s Fed cut, the S&P 500 has climbed to a new all-time high.
We view the move to new all-time highs as bullish (new all time highs are rarely bearish) as the S&P 500 has broken through an area that has acted as a ceiling since mid-July.
In our view, any move above these important ceiling areas and into a new “range” is a positive. As we often highlight, prior ceilings (resistance) often turn into future floors (support).
During August, we also noted that prior advances with similar characteristics have been indicative of future returns that have been better than average (chart 5 here and chart 5 here).
While the technicals (both the charts and the historical analogs) indicate sustained further upside, the fundamentals (charts 2, 3 and 4 below) - including earnings, earnings growth, valuation and the macro-economic backdrop - remain concerning in our view.
At some point, our fundamental concerns might be shared by other market participants, but, as of today, the charts show that this is not the case.
While we remain aware of the fragile nature of US equities, we continue to participate.
Our preferred stance in this environment has been to remain invested while from time to time tactically adding and selling puts and put spreads.
(This is not a recommendation to buy or sell any security and is not investment advice. Please do your own research and due diligence).
2. S&P 500 Earnings: All Eyes on 2025

Source: Strategas. FactSet. Through year-to-date 2024.
The chart above shows the evolution of S&P 500 earnings growth estimates for Q3 2024 (green line); 2024 overall (blue line) and 2025 (orange line).
We have expressed our concerns many times about earnings growth expectations for the 2nd half of 2024 and for full year 2025. (Most recently chart 3 here; chart 3 here; chart 3 here; charts 2, 3 and 4 here; and chart 3 here).
In the next five quarters - from Q4 2024 (inclusive) to Q4 2025, analysts are expecting S&P 500 earnings growth to average 15%.
To put this in perspective, there have been two quarters of the last ten when S&P 500 earnings growth has been over 10%.
The highest quarterly earnings growth over the past 2.5 years was 11%. while the lowest quarterly earnings growth that analysts are expecting over the next five quarters is 13%.
While one might think that the Fed’s easing cycle is an earnings growth catalyst, since 1971, there has been only one time that the Fed has cut rates by more than 1% (as it is expected to do) and simultaneously achieved double digit earnings growth (1984).
(Often the cuts - such as in March 2020 - come well before the earnings growth and the two are not simultaneous).
The question we have continued to ask is if earnings reality does not match expectations will investors care?
Perhaps, as we stated last week, by the time the earnings disappointment arrives, investors will be focused on 2026 earnings and, combined with aggressive monetary policy, this will sustain further upside.
(Past performance is not indicative of further results. This is not a recommendation to buy or sell any security and is not investment advice. Please do your own due diligence).
3. The Scope for PE Expansion May Be Limited
Source: FactSet. Through year-to-date 2024.
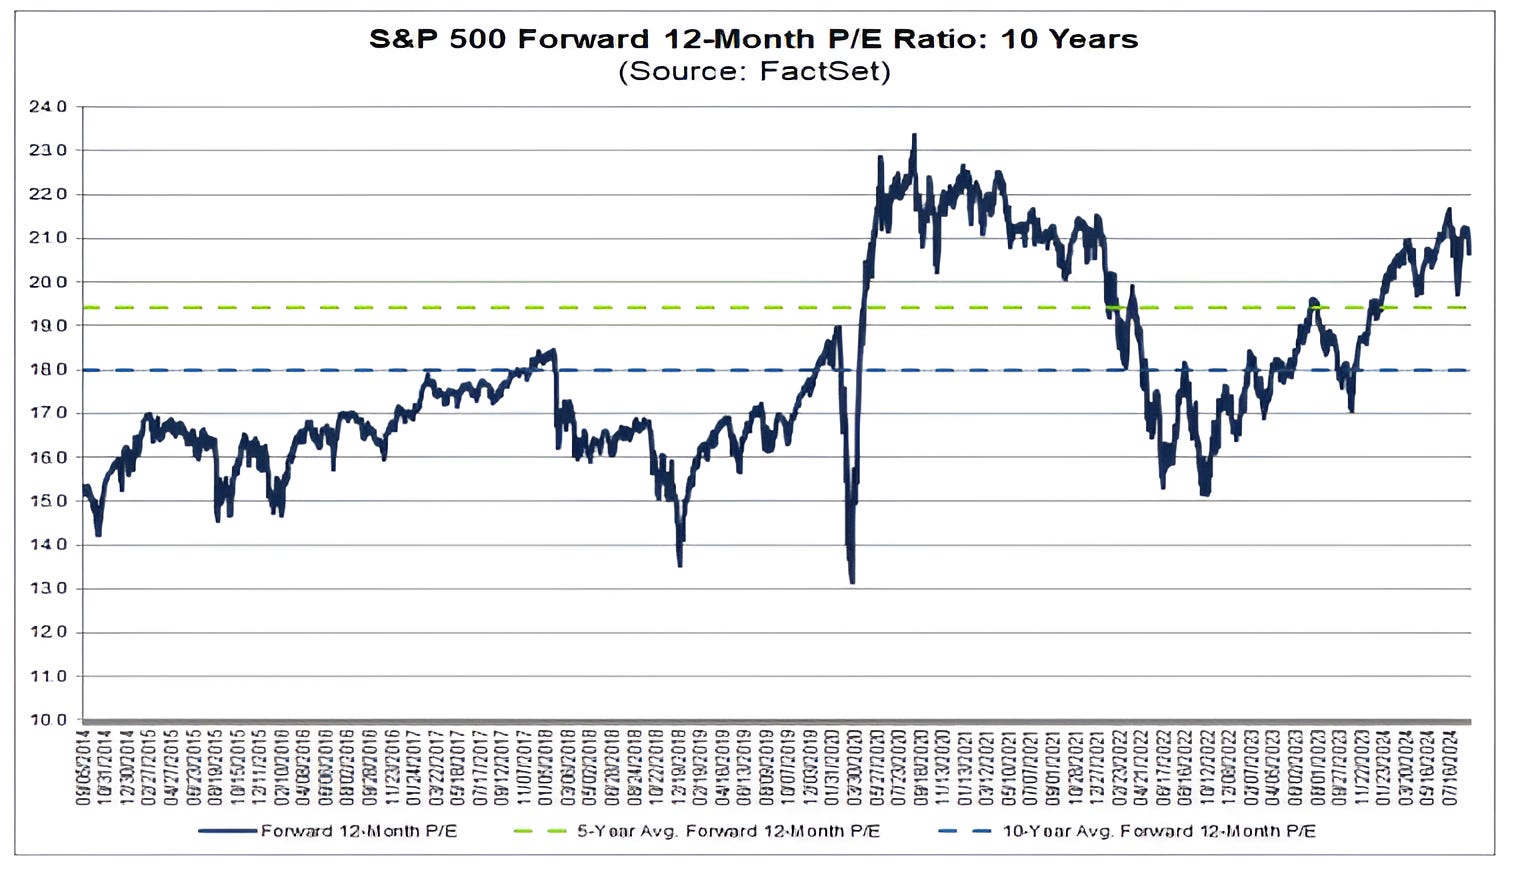
The chart above shows the 12-month forward Price to Earnings (PE) ratio of the S&P 500 for the past 10 years.
Valuation, in our view, is a measure of risk but not a catalyst.
We have discussed valuation many times in the past (recently chart 4 here and here), and have characterized the equity market as “fragile”.
At 20.5x next 12 months earnings expectations, the S&P 500 is trading in a valuation range that, was only surpassed once over the past 10 years.
The one time, over the past 10 years, that the S&P 500 has been more expensive (around 22x forward earnings) was in the post-covid period.
As a reminder, during the post-covid era, analysts had slashed their earnings estimates given the fact that the economy had been “closed” (earnings lower). When the Fed implemented aggressive monetary policy (0% interest rates + quantitative easing) investors began to price in a sharp rebound (higher S&P 500) before analysts adjusted their outlook and the PE expanded.
Despite last week’s rate cuts and the possibility of QE in 2025 (we highlighted this last Thursday here), we are not currently expecting a similar economic or earnings rebound. (“Soft landing” not “touch and go” landing).
While it is possible for the forward PE to expand further, in our view, multiple expansion from current levels is limited.
If we were to assume the multiple reached 22x (the post-covid period range) and 2025 earnings estimates remained steady at $278, the S&P 500 could trade up to 6125 by year-end. However, this, in our view, is a low probability scenario.
As we see the likelihood of multiple expansion as relatively low, significant further S&P 500 upside, in our view, will need to come from higher earnings expectations.
As we have described, this could occur as investors begin to look to 2026 earnings.
In our view, the combination aggressive future earnings expectations (regardless of current results) and an elevated multiple supported by easy Fed policy and the use of the Treasury General Account (stealth liquidity) continues to be the bull case.
(Past performance is not indicative of future results. This is not a recommendation to buy or sell any security and is not investment advice. Please do your own due diligence).
4. Keeping an Eye on the Economy

Source: Goldman Sachs Investment Research. Through year-to-date 2024.
The chart above from Goldman Sachs shows the probabilities of a recession beginning in one year (top portion) and the probabilities of being in a recession (bottom portion).
These probabilities are based on a univariate logit model using all available data for each indicator since 1959.
Although, based on the model, the US is not currently in a recession, the analysis suggests a 37% chance that a recession will begin in the next 12 months.
Within the model, the driver of the heightened recessionary risk is the 12 month forward market implied change in the Fed Funds rate (we discussed this in chart 2 here).
(Essentially market participants are expecting several rate cuts - as is the Fed -and this, historically, has been indicative of an upcoming recession).
Although it is not included in the model above, we have been highlighting the softness in employment (chart 4 here, chart 4 here) as well as equity market based indicators such as Consumer Discretionary relative to Consumer Staples (chart 2 here) and the strength in the Utilities sector (chart 3 here) as equity market signs of a potential economic slowdown.
Furthermore, the drop in oil price (down 18% since April) may also reflect a slowdown.
In other words, several economic growth indicators are flashing yellow if not red while the S&P 500 is achieving new highs.
We stated two weeks ago (chart 2 here) that in our view, given recent data, the likelihood of a US recession has increased (~30%), but we do not want to be premature in predicting one.
(Past performance is not indicative of future results. This is not a recommendation to buy or sell any security and is not investment advice. Please do your own due diligence).
5. Was China’s Liquidity Bazooka Enough?

Source: Trading View. Through year-to-date 2024.
The chart above shows the Chinese Internet ETF (ticker: KWEB).
We last showed this chart three months ago in chart 5 here and, truthfully, despite today’s move higher, little has changed. (We call this dead money in Charting Alpha parlance). (We also showed this chart here and in early February here).
Overnight, China provided significant stimulus in a move that many economists referred to as a liquidity “bazooka,” and we will see if this can change the trajectory of Chinese shares.
The liquidity “bazooka” consisted of changes to policy measures across five main verticals:
The Reserve Requirement Ratio (“RRR”): The People’s Bank of China (“PBoC”) cut the reserve requirement ratio (“RRR”) by 0.5%. This will free ~1 trillion yuan ($142 billion) for new lending. The RRR may be cut by another 0.25% in 4Q.
Interest Rates: The PBOC also cut the seven-day reverse repo rate, its new benchmark, by 0.2% to 1.5%. The prime loan rate (“LPR”) and deposit rates were also lowered by 20-25bps.
Mortgages: Minimum down payments on second homes to fall from 25% to 15%; annual household interest expense should fall by ~150bn CNY ($21 billion), for 150 million people.
Real Estate Loans to Local Governments: The PBOC will cover 100% of loans for local governments buying unsold homes with cheap funding, up from 60%.
Stocks: Institutional investors can use assets to obtain liquidity from the PBOC to buy stocks, initially up to 500 billion yuan ($70 billion). Banks are also being encouraged to lend to shareholders for stock buybacks and increasing holdings.
In our view, underconsumption and poor consumer sentiment remain the core problem to China’s imbalances.
While these policies are encouraging, they may only address supply of credit, while not necessarily spurring demand of goods (consumption).
We will see if this stimulus has broader long-term impact than the other attempts since 2023.
One unintended consequence of the Chinese stimulus policy, may be to move commodities prices higher.
As we highlighted last week, inflation tends to come in waves. Could the China stimulus be the catalyst for an inflationary wave?
As always, we will follow the charts to determine investors conviction and the resiliency of change.
For now, we see no need to chase the equities and we might prefer to play the Chinese stimulus through oil and gold.
(Past performance is not indicative of future results. This is not a recommendation to buy or sell any security, please do your own research).