


Too Shy Shy...
One of my readers put in a request for the title and remarked investors are "Too Shy Shy" to allocate more to equities. He's clearly a bull and sees equities climbing a wall of worry. Let's dig in...
Equities ignored the higher than expected Producer Price Inflation (PPI) report today and continued their journey back to the March all-time highs.
Are investors expecting a better (lower) than expected CPI print tomorrow?
Or do investors know that the Fed is no longer focused on what the inflation data says - because as Powell said the bar to raising rates is high and he and the wizard Yellen have already applied a new round of stealth liquidity.
Meanwhile, the combination of stealth liquidity, US fiscal spending and Chinese stimulus are creating a cyclical rebound at an atypical time in the cycle.
Too Shy Shy indeed!
I am traveling this week and will write again on Monday.
1. The Equal Weight Nasdaq 100, Where Do We Go From Here?

Source: TradingView. Through year-to-date 2024.
We showed the Equal Weight Nasdaq 100 two weeks ago (here).
At the time, we were concerned about demanding earnings growth, higher 10-Year Treasury yields and a potentially bearish technical set-up in the chart above.
Since that time, Q1 earnings have delivered (see below), 10-Year Yields have trended down and the potentially bearish set-up did not materialize.
Instead, the Equal Weight Nasdaq 100 moved back to its November 2021 high.
With CPI coming out tomorrow, and the Equal Weight Nasdaq 100 back at the level that rejected it in 2021, how will it react?
As we have continued to state the Fed’s bias is to ease. However, given the one month nearly 6% move in the Equal Weight Nasdaq 100 (and similar moves in other indexes), we wouldn’t be surprised to see a brief pull back before the climb back to the March 2021 high.
(This is not a recommendation to buy or sell any security and is not investment advice).
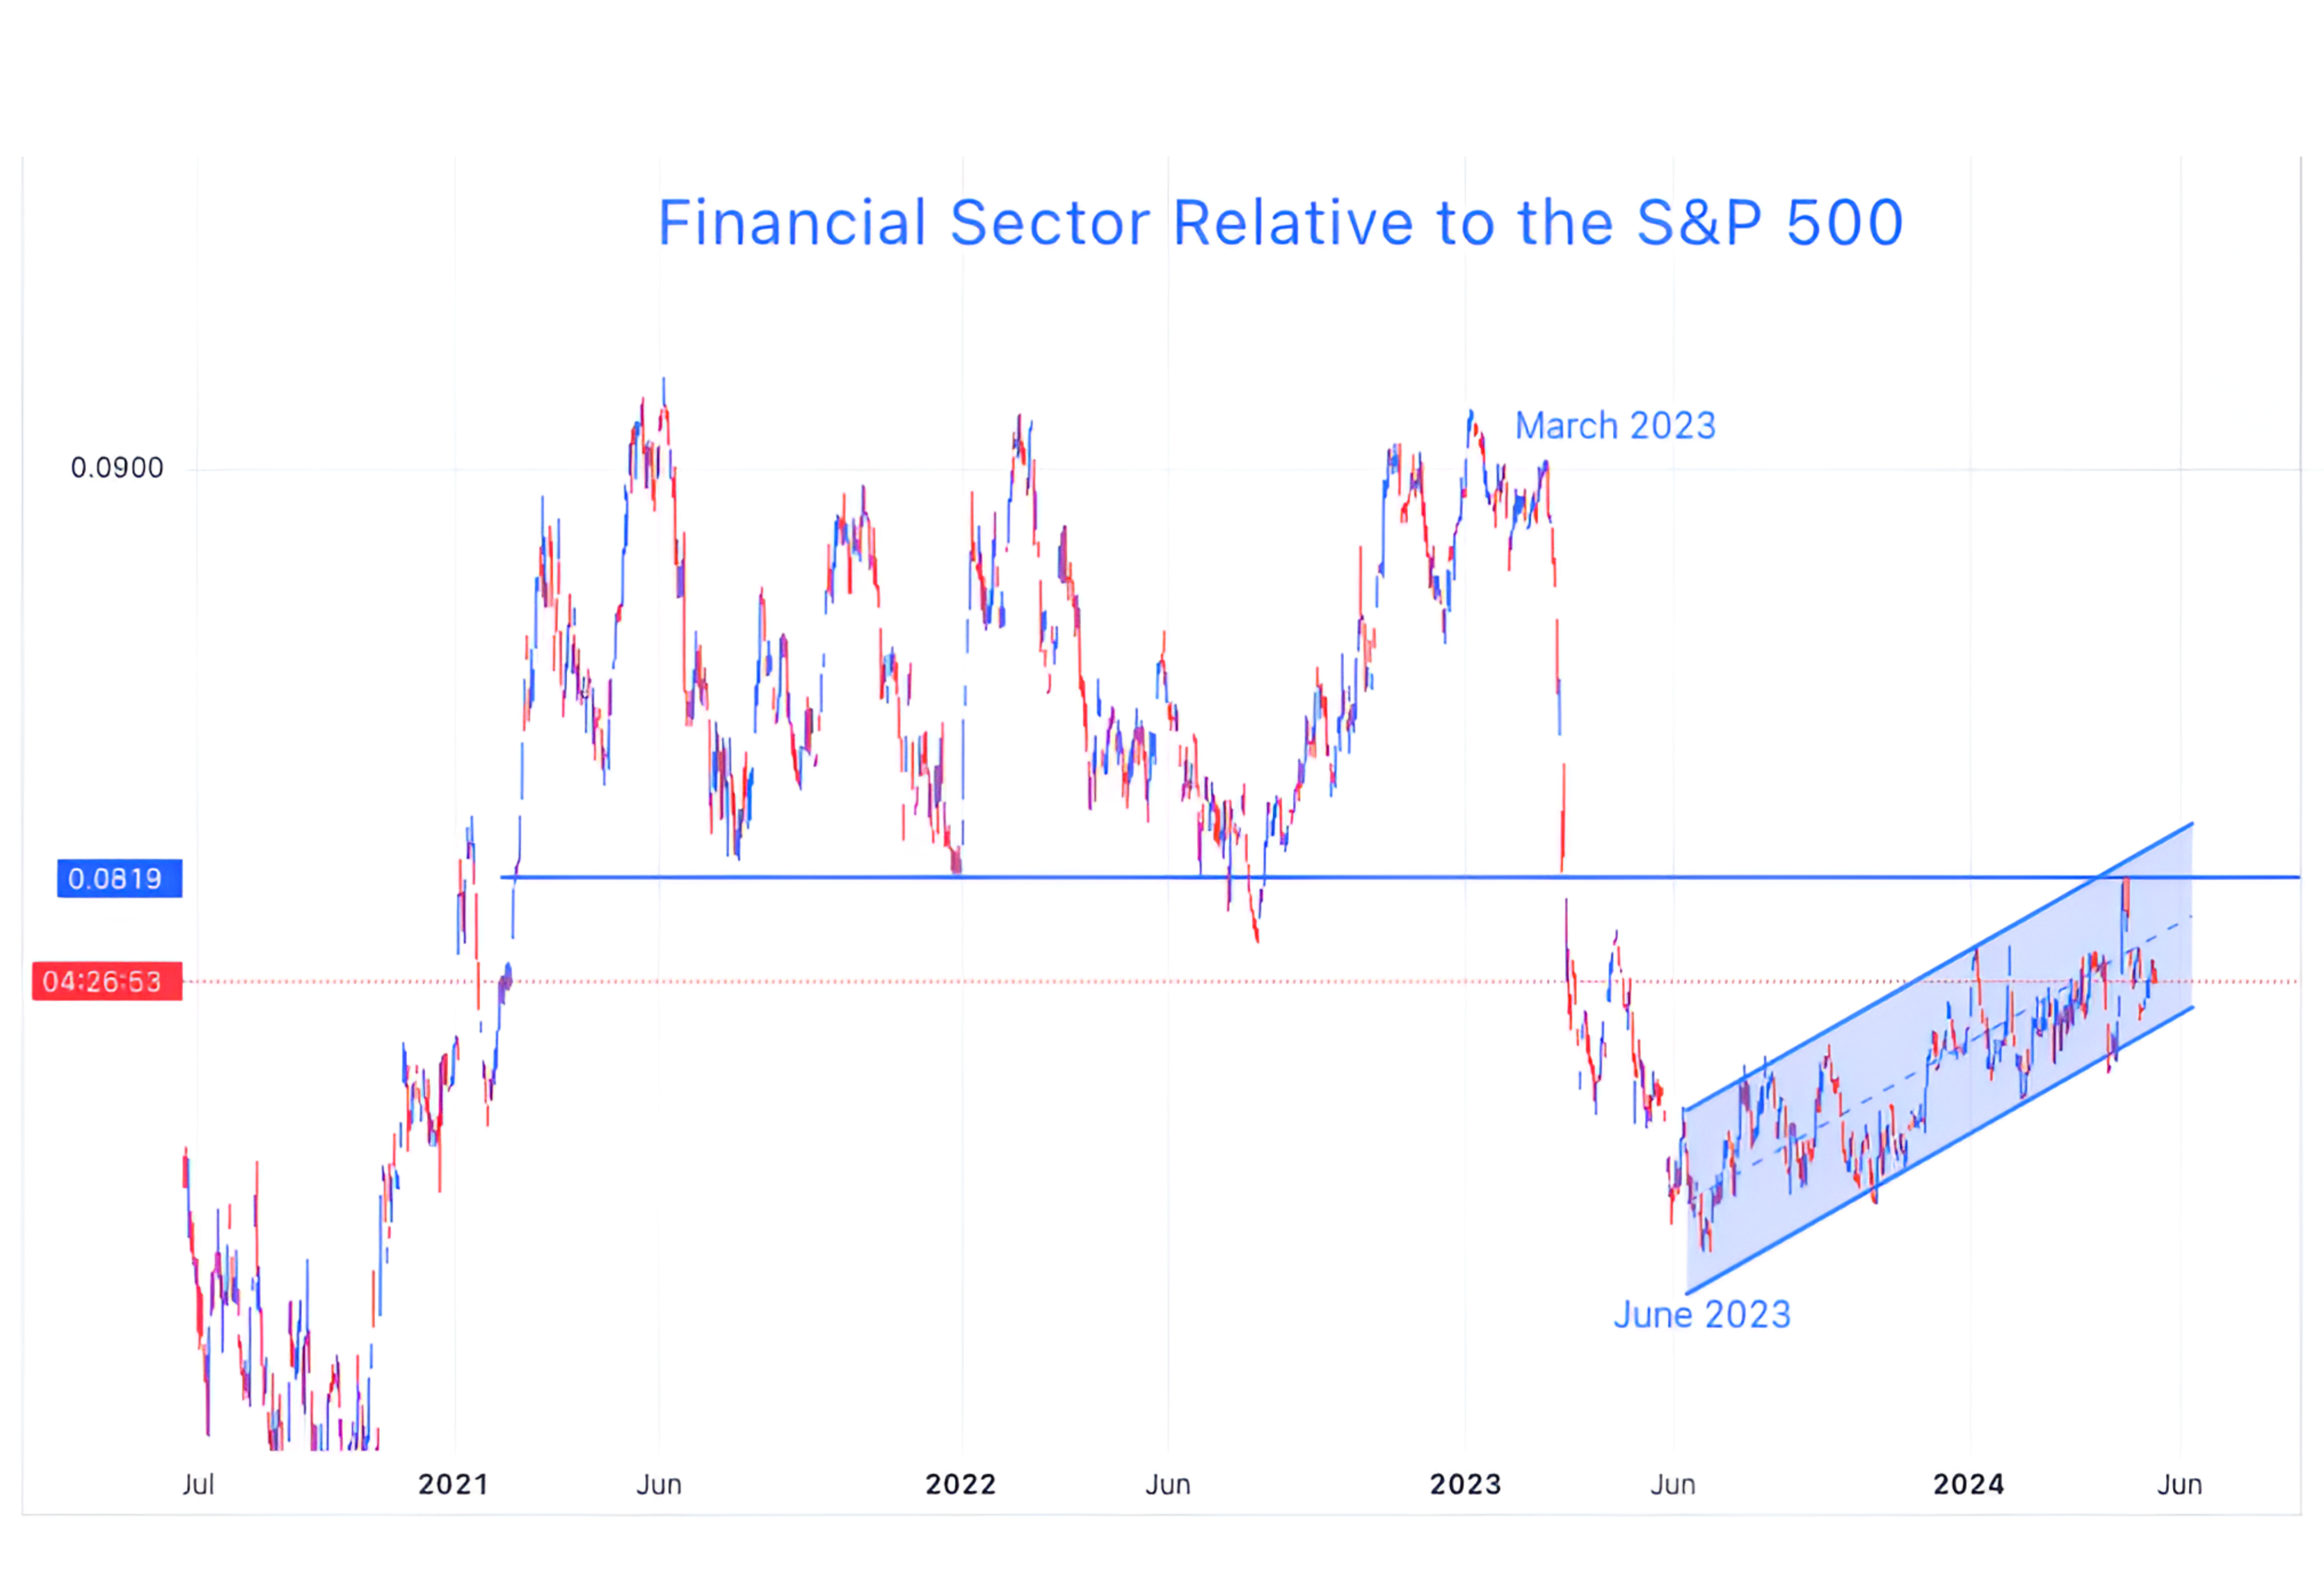
2. Financials, a Slow but Steady Relative Climb
Source: TradingView. Through year-to-date 2024.
After collapsing on both a relative (above) and absolute basis in March 2023 as regional banks struggled, the S&P 500 Financial Sector (includes large cap banks, asset managers, insurance companies, credit cards and other financial services companies) has been slowly outperforming the overall index.
We consistently write about diversifying our portfolios as the 2024 US equity market is unlike the 2023 US equity market.
Financials are one of the cyclical value sectors that we have highlighted and emphasized.
(This is not a recommendation to buy or sell any security and is not investment advice. Please do your own due diligence).
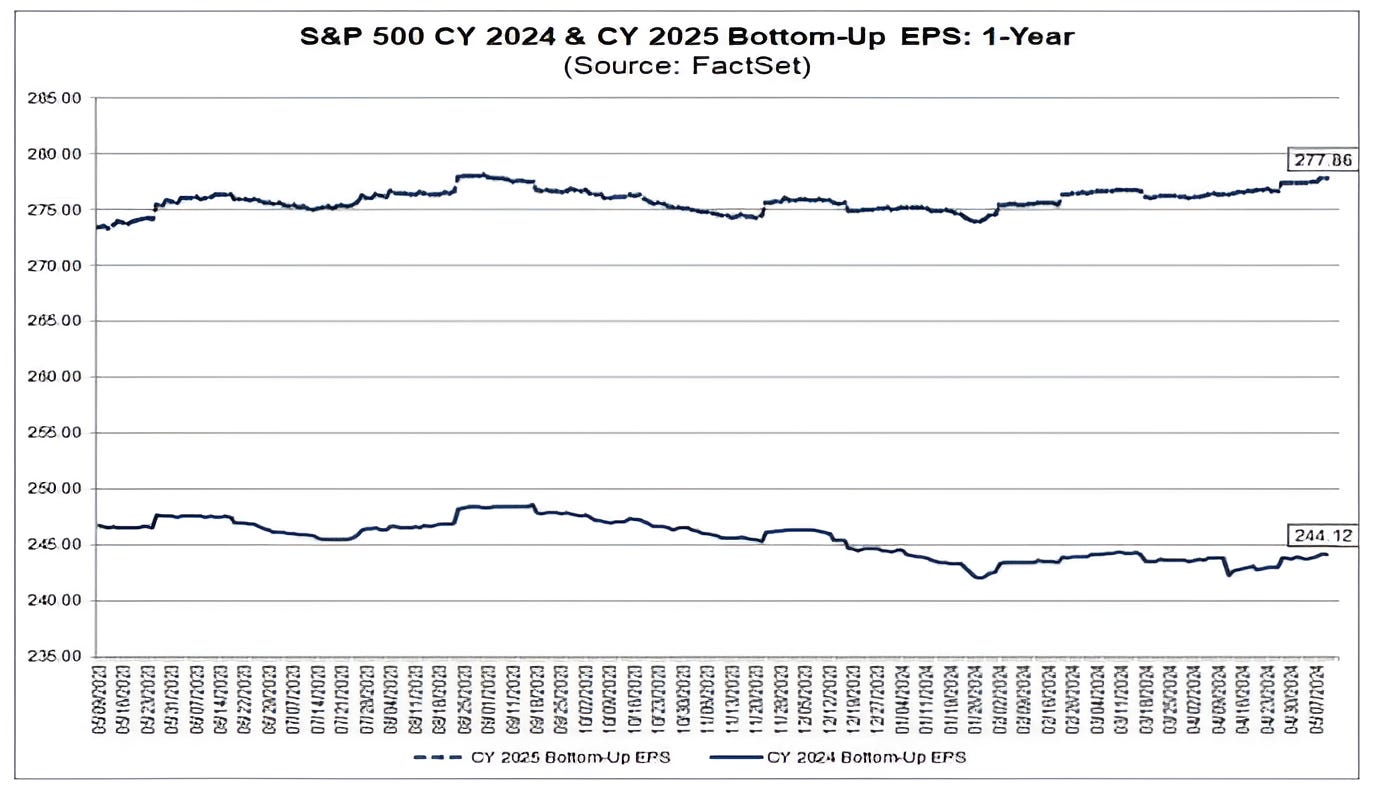
3. The Evolution of Earnings Expectations: 2024 / 2025
Source: FactSet. Through year-to-date 2024.
While we have questioned the projected earnings and earnings growth for 2025 ($278 and 14%, respectively), expectations have been remarkably stable.
Although we continue to have our concerns about growth projections, we don’t expect markets to price in the achievability (not sure that’s a word) unless there are significant downward earnings revisions before then.
Looking back at the year 2000, many investors questioned valuations and fundamentals (several companies with negative earnings).
While most people remember March 2000 at the top, few remember that in September 2000, the S&P 500 revisited the March 2000 closing high on an intra-day basis.
In other words, the S&P 500 hit the March 2000 closing high in the middle of the day on September 1, 2000, but it did not close there (also the March intra-day high was higher).
What led to the sell-off in September was a parade of companies missing earnings projections and being re-rated downwards.
It is important to note that this was not one company that had an execution misstep, but a wave of companies that significantly fell short of expectations.
It is with this in mind that we believe that the market can maintain an elevated valuation and trend higher on questionable earnings assumptions. As a result, we continue to expect 5500 by year-end as investors ascribe a 20x multiple to $275 in S&P 500 expected (but not necessarily achievable) earnings.
All of that said, it is also very important to recognize - particularly as I have questioned (once again) the earnings outlook - that S&P 500 earnings expectations for both 2024 and 2025 have remained stable and have recently trended up.
There have been many years for which the evolution of earnings expectations has continually sloped downwards in recognition that the initial outlooks were too aggressive (2014-2019, if my memory serves) and the markets were ok (albeit at a lower multiple).
(This is not a recommendation to buy or sell any security and is not investment advice. Please do your own due diligence).
4. Earnings (per Share) Support

Source: Goldman Sachs. 2024 and 2025 (green bars) are estimates Through year-to-date 2024.
One thing that we may consider when looking at the Evolution of Earnings Expectations chart (chart 3) is that it is constructed by aggregating the earnings per share (eps) projections of all 500 S&P companies.
The chart above shows annual stock buybacks and projections for 2024 and 2025.
While 2024 buybacks are in the range of those from 2021 and 2022, 2025 are expected to be a record.
As a reminder, in 2021 and 2022, there were 0% interest rates and corporate borrowing costs were historically low. In that environment, several companies borrowed money and “retired” their shares.
In the current environment, borrowing costs are higher, but that doesn’t seem to have deterred corporate buybacks.
If the buyback projections are correct, this could help support 2024 and 2025 earnings per share growth despite potentially lower operating earnings growth (that are not calculated on a per share basis).
(This is not a recommendation to buy or sell any security, please do your own research).
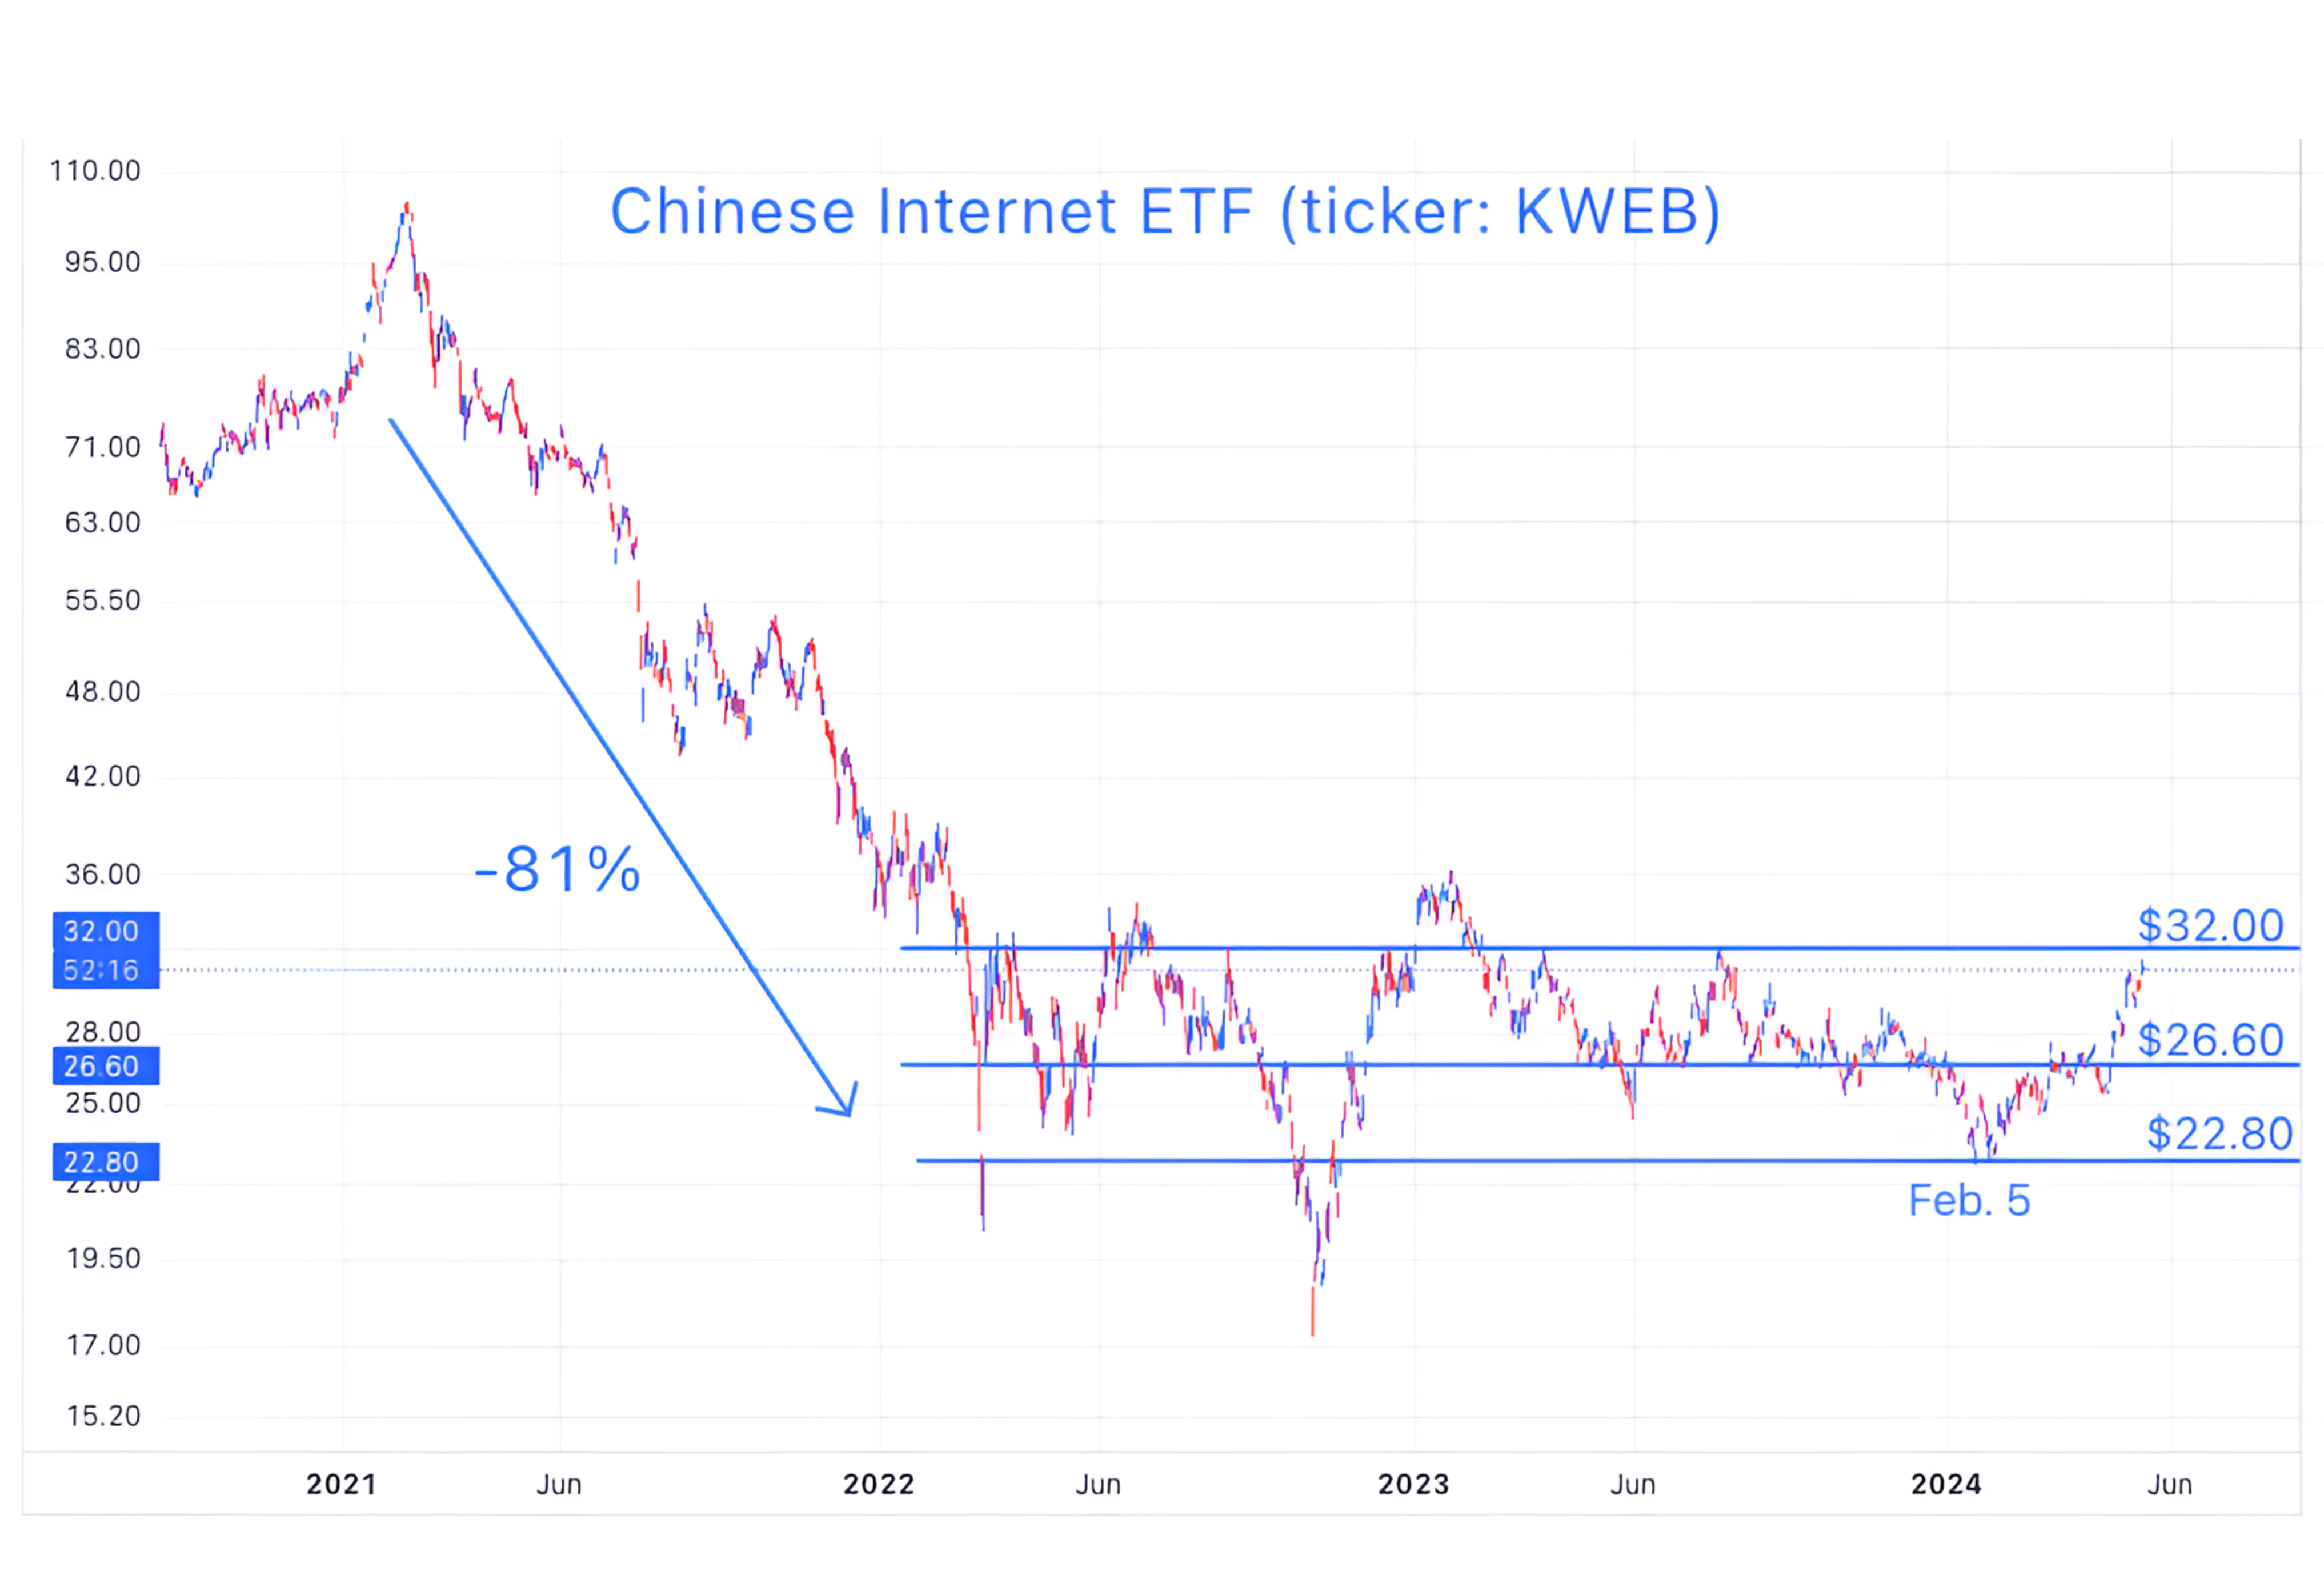
5. Chinese Internet, Nearing Our Target
Source: TradingView. Through year-to-date 2024.
We first showed the chart of the Chinese Internet ETF (ticker: KWEB) in early February (here).
At the time, the Chinese Internet ETF was sitting on the lowest line that we had drawn in on the chart and we said that we were “Looking for a Possible Bounce in Chinese Internet Shares.”
On April 9, when the Chinese Internet ETF had moved up to the middle line, we wrote “In our view, it will not take good news from China for upside, all that is required is less bad or not as bad as feared news.” (here)
As we noted yesterday, China has been continually adding stimulus to its economy.
President Xi is currently on a tour of European trading partner countries hoping to encourage growth in exports.
With the Chinese Internet ETF back at the top of its 2-year trading range and the good news on stimulus “known,” we wouldn’t be surprised to see a pause.
As the ETF is up 36% in 3-months (since we first wrote about it), we would like to see the Chinese Internet ETF move above its long-term ceiling before reiterating our constructive view.
(This is not a investment advice and is not recommendation to buy or sell any security).