


It's the Same Old Song...
The equity move higher continues as do the imbalances. Mega-caps (chart 1) and Tech (chart 3) are continuing to outperform as the valuation disparity looks ominous (chart 4). Let's dig in...
1. US Equity Performance Year-To-Date

Source: Thrasher Analytics. Through year-to-date 2024.
The chart above shows the US equity performance year to date for Mega-Caps (the S&P 100); Large Caps (the S&P 500); the Equal Weight S&P 500; and the Russell 2000 Small Caps.
Although we have been discussing this performance divergence (chart 4 here; Chart 3 here; and chart 5 here) and showing these charts individually, this chart neatly captures the character of US equities in 2024.
Year-to-date, Mega-Cap US equities are up 18% while Small Caps are down 2%.
Why do we care?
This difference in performance is the most significant characteristic of US equities in 2024.
These imbalances do not continue in perpetuity.
At some point, there will be a reversion to the mean - whether this will be a sell-off in Mega-Caps or a rally in Small Caps, we want to be aware.
Furthermore, whatever transpires, everybody - including us - will say the signs were there.
These divergences can persist longer than most believe (they are not a catalyst).
While the resolution of this imbalance does not need to be by Mega-Caps moving meaningfully lower, as we show and describe in chart 4, a valuation driven correction at some point would not surprise us.
(This is not a recommendation to buy or sell any security and is not investment advice. Please do your own research and due diligence).
2. 2024 S&P 500 Expected Sales Growth
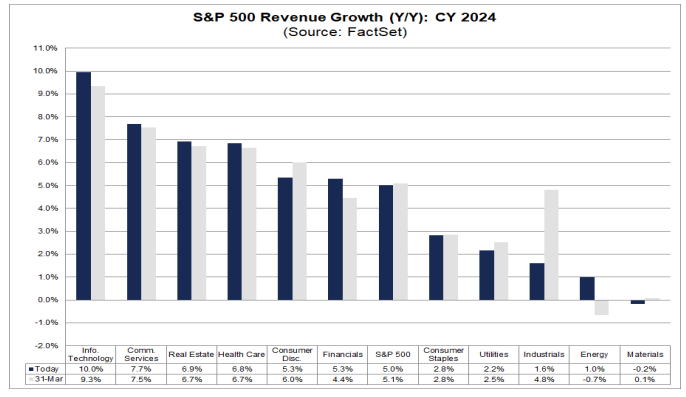
Source: FactSet. Through June 14, 2024.
The chart above shows S&P 500 2024 estimated Sales / Revenues Growth by sector as of last Friday (June 14) and March 31.
We have written about our concern with 2024 earnings growth estimates several times (most recently here).
As a reminder, S&P 500 earnings growth is expected to accelerate throughout the second half of 2024 and into 2025.
There are some that believe we are in the midst of an economic slowdown, others believe (Evercore ISI, as we noted yesterday) that we are in the early stages of an AI led productivity boom.
It would likely take a productivity boom to generate 17% earnings growth (the current consensus estimate) in Q4.
We wanted to start at the beginning - revenues growth - to better understand how 2024 earnings are going to achieve the lofty goals that companies and analysts have set and are continuing to re-affirm.
Despite 2024 expected earnings growth having moved up 0.6% since March 31, revenue growth has moved down 0.1%.
The Technology (Nvidia, Apple, Broadcom etc.) and Communications Services (Google, Facebook, Netflix etc.) sectors have seen both sales and earnings expectations increase.
While we have seen a semiconductor “arms race” driven by the hyper-scalers (see chart 2 here), enterprise and cloud software has been somewhat left behind.
In terms of Apple (neither semiconductor, nor software), although sales in China are improving, its “Apple Intelligence” AI features (I might write about these at some point) were not much different than a typical Apple iOS upgrade in my opinion.
The announcement included improved Siri, personalized emojis, better proof-reading (I could use this), phone call transcription and some photo and illustrator tools.
Are these going to lead to a near-term productivity boom?
More importantly, will it drive a phone upgrade cycle?
To consider this - let’s look at the revenues from the Consumer Discretionary sector. It has moved down 0.7% from March 31. Retail sales today disappointed.
If this is a reflection of a more cautious consumer, a significant phone upgrade cycle based on Apple Intelligence may be a stretch. We’ll see.
Corporate CEOs themselves have been focused on “expense management.” (see Chart 5 here). This may mean more lay-offs (or just cautious enterprise software budgets).
In other words, while we have confidence in the Semiconductor cycle, we are concerned about Enterprise Software and the consumer.
We still do not have confidence in the 2nd half and 2025 earnings growth acceleration story.
While 2nd half S&P 500 earnings will likely grow, we don’t see growth in line with current consensus expectations.
(This is not a recommendation to buy or sell any security and is not investment advice. Please do your own due diligence).
3. You’re Not Going Through Without a Fight

Source: TradingView. Through year-to-date 2024.
The chart above shows the Technology Sector relative to the S&P 500 and is a follow-up to yesterday’s chart on the Technology Sector (chart 3 here) and the last time we showed the chart above (here).
I could have also called this chart - “We didn’t come this far to only come this far.”
I believe that both the “fight” theme and the “we didn’t come this far” theme could both be relevant.
In other words, as we highlighted yesterday, the Technology Sector seems to be approaching a level where, at the very least, we would expect a pause.
Similarly, relative to the S&P 500, we would expect a battle at the year 2000 high.
However, over time, we expect Technology to make a new all-time high relative to the S&P 500.
(This is not a recommendation to buy or sell any security and is not investment advice. Please do your own due diligence).
4. Valuation

Source: Goldman Sachs. Through year-to-date 2024.
Yesterday, we described Goldman Sachs recent S&P 500 2024 “base case” year-end target upgrade and highlighted the accompanying scenarios. (here)
In that description, we wrote, “In general, the other scenarios are based on the valuation premium between the (traditional) S&P 500 and the Equal Weight S&P 500.”
Looking at the chart above, it is notable (in our opinion), that other than the current period, there have only been two periods of significant valuation disparity between the (traditional) S&P 500 and the Equal Weight S&P 500: the 1998-2000 period and the post-covid period.
One of the scenarios that Goldman Sachs presented was called the “Catch Up” scenario.
I described the “Catch-Up” scenario as: “the valuation multiple of the Equal Weight S&P 500 “catching-up” to that of the (traditional) S&P 500.”
In neither of the two prior periods of significant valuation disparity did the valuation of the Equal Weight “catch up” to the valuation of the (traditional) S&P 500.
That doesn’t mean it will not happen (past performance is not indicative of future results), it just means it hasn’t.
What has happened in the past is a “catch down.”
Goldman presented this scenario as well and I described it as: “this scenario incorporates a contraction of the (traditional) S&P 500 down to that of the Equal Weight S&P 500.”
Goldman provided a 4800 target on the “catch down” scenario.
Based on a multiple contraction down from the current respective multiples of 21x to 16x and $253 in expected next 12 months earnings, in this scenario, I would (based on this simple analysis) consider the possibility of a 1265 point move down from today’s level (around 5480). This would lead to a target of 4215.
Interestingly, this is almost exactly the level that I presented in the introduction of “The Fundamental Things” (here):
“Although it’s a fools errand to try to develop a 6, 12 and 18-month road map for the equity market, we see the possibility (10-15% likelihood) of a 30% sell-off that would see the S&P 500 bottom around 4000-4200 in 2025 from a peak of 5500-5800 in 2024.”
Furthermore, when we look back at the past 35 years of (traditional) S&P 500 valuation, it is clear there have been two bubble periods in valuation: 1998-2000 and the 2020 post-covid period.
The current period in (traditional) S&P 500 valuation while not quite at the two valuation bubble periods is closer to those than the more normal periods.
Both of those bubbles resolved with a multiple contraction. That said, the multiple can contract as earnings increase faster than the index level.
(This is not a recommendation to buy or sell any security, please do your own research).
5. EM Equities “Held the Line”
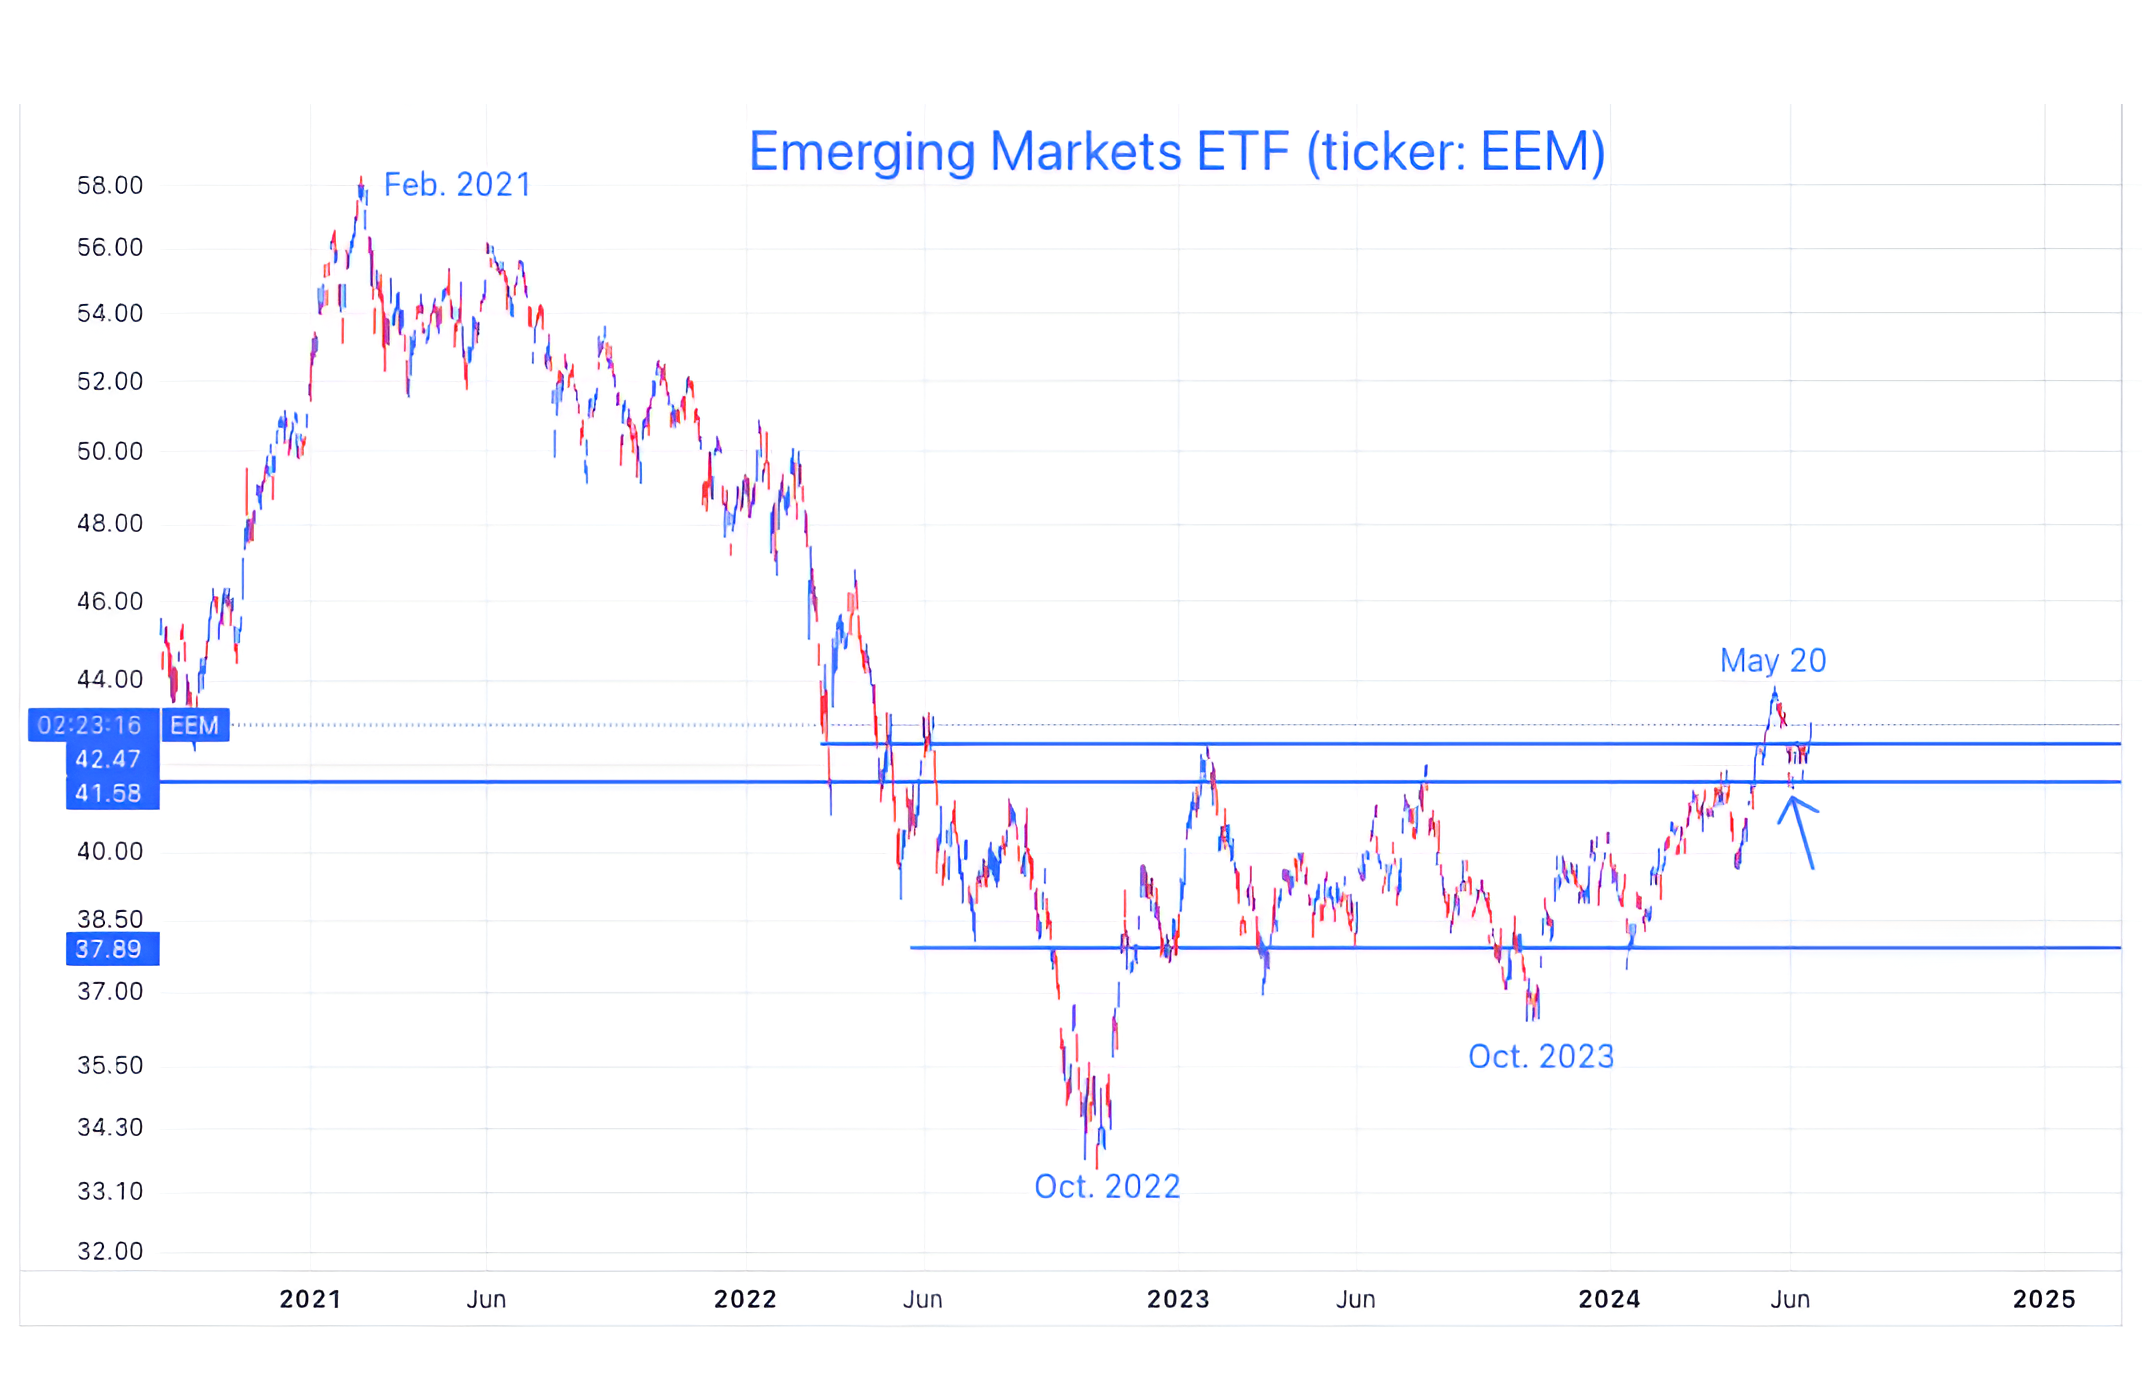
Source: TradingView. Through year-to-date 2024.
We last showed the Emerging Markets ETF (ticker: EEM) two weeks ago (here) when the chart was at the middle horizontal light blue line (the arrow) and we questioned whether EM equities would bounce or collapse.
They have bounced.
Truthfully, I was surprised when I pulled the chart up.
Over the past two weeks, Chinese equities haven’t done well; Mexican equities have sold off; and the Brazil ETF has collapsed.
The countries that have led the Emerging Markets ETF higher have been India and Taiwan. Each of these countries represent around 18% of the ETF.
While Indian equities have been doing well lately, they had an extra boost in the post Modi re-election period.
While Modi won his third-term, his party lost seats, and, perhaps like the US, the equity market likes the split government as it limits the power of the Prime Minister (in the case of India) and reduces the scope for surprise.
Taiwanese equities, like US equities, are a Semiconductor story.
Taiwan Semiconductor (TSMC) is the world's largest independent semiconductor foundry. They produce most of the chips that Nvidia designs.
TSMC represents 30% of the Taiwanese equity market (and we thought the the S&P 500 was concentrated).
If other regions can begin to bottom, the bounce in EM equities could be in its earliest stages.
(This is not a investment advice and is not recommendation to buy or sell any security).