


You Ever Had a Crystal Ball? (Prince)
"We’ve long felt that the only value of stock forecasters is to make fortune tellers look good," Warren Buffet. Over the weekend, two Wall Street houses raised their S&P 500 targets. Let's dig in...
Last week, I tried to describe the current market conundrum:
From a purely fundamental perspective, the new highs in the S&P 500 and Nasdaq 100 are difficult to explain or justify; however, from a technical perspective - historical trends, positioning, investor psychology, 4th year of the Presidential cycle etc. - the current market environment has been somewhat normal.
We have continued to show both sides of this coin and to try to keep investors “in” the market despite our fundamental questions (17% earnings growth in Q4? (see chart 4 here)).
In addition, we have aimed to identify and explain a potential fundamental force - what we have described as “stealth liquidity” (see here, here, here, here, chart 4 here and here) - as a key driver of higher equity markets. (“It's liquidity that moves markets,” Stan Druckenmiller.)
Over the weekend, Goldman Sachs and Evercore ISI raised their price targets on the S&P 500. (See Charts 1 and 2).
Today, JP Morgan reiterated their bearish view (also highlighted in Chart 2).
We look into all three below.
I have worked in banks and know the pressure of having a perspective or position that is not working.
Price is never wrong - this is why we show and analyze the charts.
1. Goldman Says Base Case is Higher but Market Can Do Anything

Source: Goldman Sachs. Through year-to-date 2024.
On Friday afternoon, Goldman Sachs revised their base case year-end S&P 500 target to 5600 from 5200.
The Base Case is based on Goldman’s view that there are likely to be smaller downward revisions to consensus S&P 500 earnings than they had originally estimated (in other words higher earnings) and a larger valuation premium for large cap stocks (which will drive the overall index valuation higher).
In addition to its “Base Case,” in the report, Goldman presented 3 other scenarios:
“Catch up”: the S&P 500 would end the year at 5900.
“Catch down / Recession fears”: the S&P 500 would end the year down at 4800.
“Continued mega-cap exceptionalism”: the S&P 500 would end the year at 6300.
In general, the other scenarios are based on the valuation premium between the (traditional) S&P 500 (we showed last Thursday here) and the Equal Weight S&P 500 (that we highlighted here).
Currently, the Equal Weight S&P 500 is trading at 16x expected earnings and the (traditional) S&P 500 is trading at 21x. This is a 30% premium.
Considering Goldman’s estimate of $274 in 2025 S&P 500 earnings, their new base case target reflects a 20x forward multiple in the (traditional) S&P 500 and reflects a 36% multiple premium over the valuation of the Equal Weight S&P 500.
The “Catch-Up” scenario reflects the valuation multiple of the Equal Weight S&P 500 “catching-up” to that of the (traditional) S&P 500; whereas, the “catch-down” scenario incorporates a contraction of the (traditional) S&P 500 down to that of the Equal Weight S&P 500.
The “Continued mega-cap exceptionalism” scenario basically shows the Magnificent 7 (see chart 4 below) continuing to trade in their own orbit as the average stock in the Equal Weight S&P 500 is left behind.
While the “Base Case” can be justified, the three other scenarios in my opinion sound convoluted.
I have never seen an analysis of the S&P 500 that considers or is based on a valuation premium relative to the Equal Weight S&P 500. Not from Goldman, not from anyone.
As far as I know, there is no correlation or causation here.
Historically, valuation has been somewhat correlated with inflation and 10-year yields.
However, as we’ve seen in periods of high liquidity (even stealth liquidity), these correlations are quick to break down.
As a reminder, our view on the S&P 500 (that we summarized here):
“In our view, the rally will continue for the next 3-9 months driven by technicals and seasonality and supported by stealth liquidity and the expectation of improving fundamentals.
While our S&P 500 target is 5500, it is possible in a blow-off top type scenario that the S&P 500 could move to 5600 or even 5800.
From a technical perspective, this remains a very healthy market.
When we look for a potential price target based on the chart, we would look at the 1.618 extension of the January to October 2022 sell-off which is around 5560.
As we always state, we do not rely solely on technicals (chart patterns) for market views or targets, but this level is somewhat consistent with our fundamental view of 5500 based on 20x 2025 earnings of $275 (slightly lower than current consensus).”
And continued here:
We continue to believe that at some point, the “bill will come due” in this market and a more extreme correction (~30%) will take place.
In our view, this is likely to occur within the next 6-18 months.
In our experience, closely watching the internals of the equity market and inter-market relationships can be a helpful guide in risk management.
(This is not a recommendation to buy or sell any security and is not investment advice. Please do your own research and due diligence).
2. Price Leads, Narrative Follows…

Source: Strategas. Through year-to-date 2024.
The chart above from Strategas shows the Year-End 2024 S&P 500 from Wall Street strategists.
The chart is updated for the weekend’s new Evercore ISI year-end S&P 500 target of 6000, but does not reflect the Goldman Sachs target revision to 5600.
A couple of highlights:
The average 2024 S&P 500 target from the Wall Street Strategists is 5243 which is below Friday’s close of 5432 (this does not include Goldman Sachs).
11 of the 28 Strategists have revised their view since the beginning of May (this includes Goldman Sachs).
JP Morgan has the lowest target of 4200. (Explanation below).
Evercore ISI now has the highest target - 6000 - among Wall Street firms.
In its upgrade from 4750 to 6000 (quite a change) Evercore ISI cites:
AI: “AI’s potential in every job in every sector is “inflecting.” We can only assume that Evercore ISI sees a productivity boom.”
Inflation: “Inflation is slowing.”
The Fed: “Intent on cutting rates.”
[As an aside, what I would say here is that the Fed “put” is alive and well, but there is a risk, after last weeks announcement and dot plot that the Fed will be late to put water on any fire. We wrote about this in chart 2 here.]
Combined, these factors (in Evercore ISI’s view) can lead to a “goldilocks” type period of consistent growth, low inflation and increased liquidity.
While I don’t necessarily disagree with the factors that Evercore ISI cites for its upgrade, there is nothing here that they couldn’t have written in December. In other words, what’s changed (to move from 4750 to 6000)?
Also, as I have alluded to, I don’t see a significant near-term AI use case that is going to significantly drive revenues.
Upgraded Siri on iPhones (basically what Apple announced)? Better Google search? My son can write a paper in the style of Shakespeare (thank you Chat GPT).
I have little doubt that the innovation from AI over the long-term will be meaningful, however, other than the current spend from hyper-scalers, I don’t yet see a revenue generating application.
In fact, most of the applications we hear about are cost savers.
“We can now write code faster than ever with fewer people.” etc.
Over the medium-term, this could lead to lay-offs and slow economic growth rather than stimulate a productivity boom.
Finally, pivoting back to Evercore ISI’s price target, based on their estimates, “6000 reflects 25x trailing price to earnings which is just shy of the 28x dot-com peak.” (They wrote this not me).
In other words their target is based on an S&P 500 priced to perfection or near bubble. Aggressive in my view.
On the other hand, today, JP Morgan reiterated their street low (4200) view stating:
“Our cautious stance has been based on our view that there is no re-rating upside, and that any upside had to therefore come from earnings growth, which we see being insufficient to take on equity risk even under best case scenario assumptions.
For equities to avoid a 20%+ correction, you have to believe that tech will become a much more meaningful driver of growth for the broad economy in short order.
While we believe tech will continue to be the key driver of economic growth for years to come, we don’t think its impact on corporate P&Ls across the board will be that profound so suddenly, and so we remain cautious here, expecting economic growth to weaken, equities to correct, and investors to find a better entry point.”
I read the JP Morgan note after I wrote my explanation of tech / AI above, but I see similarities in our analysis (of tech / AI) but not necessarily in our S&P 500 targets.
Considering both the Evercore ISI view and the JP Morgan stance - we could get there mentally and justify either.
However, in my view, it looks like Evercore ISI is doing mental gymnastics to justify providing an out of consensus target to garner attention and trading.
As a reminder, I am not trying to sell you anything.
(This is not a recommendation to buy or sell any security and is not investment advice. Please do your own due diligence).
3. A Technical Look at the Technology Sector
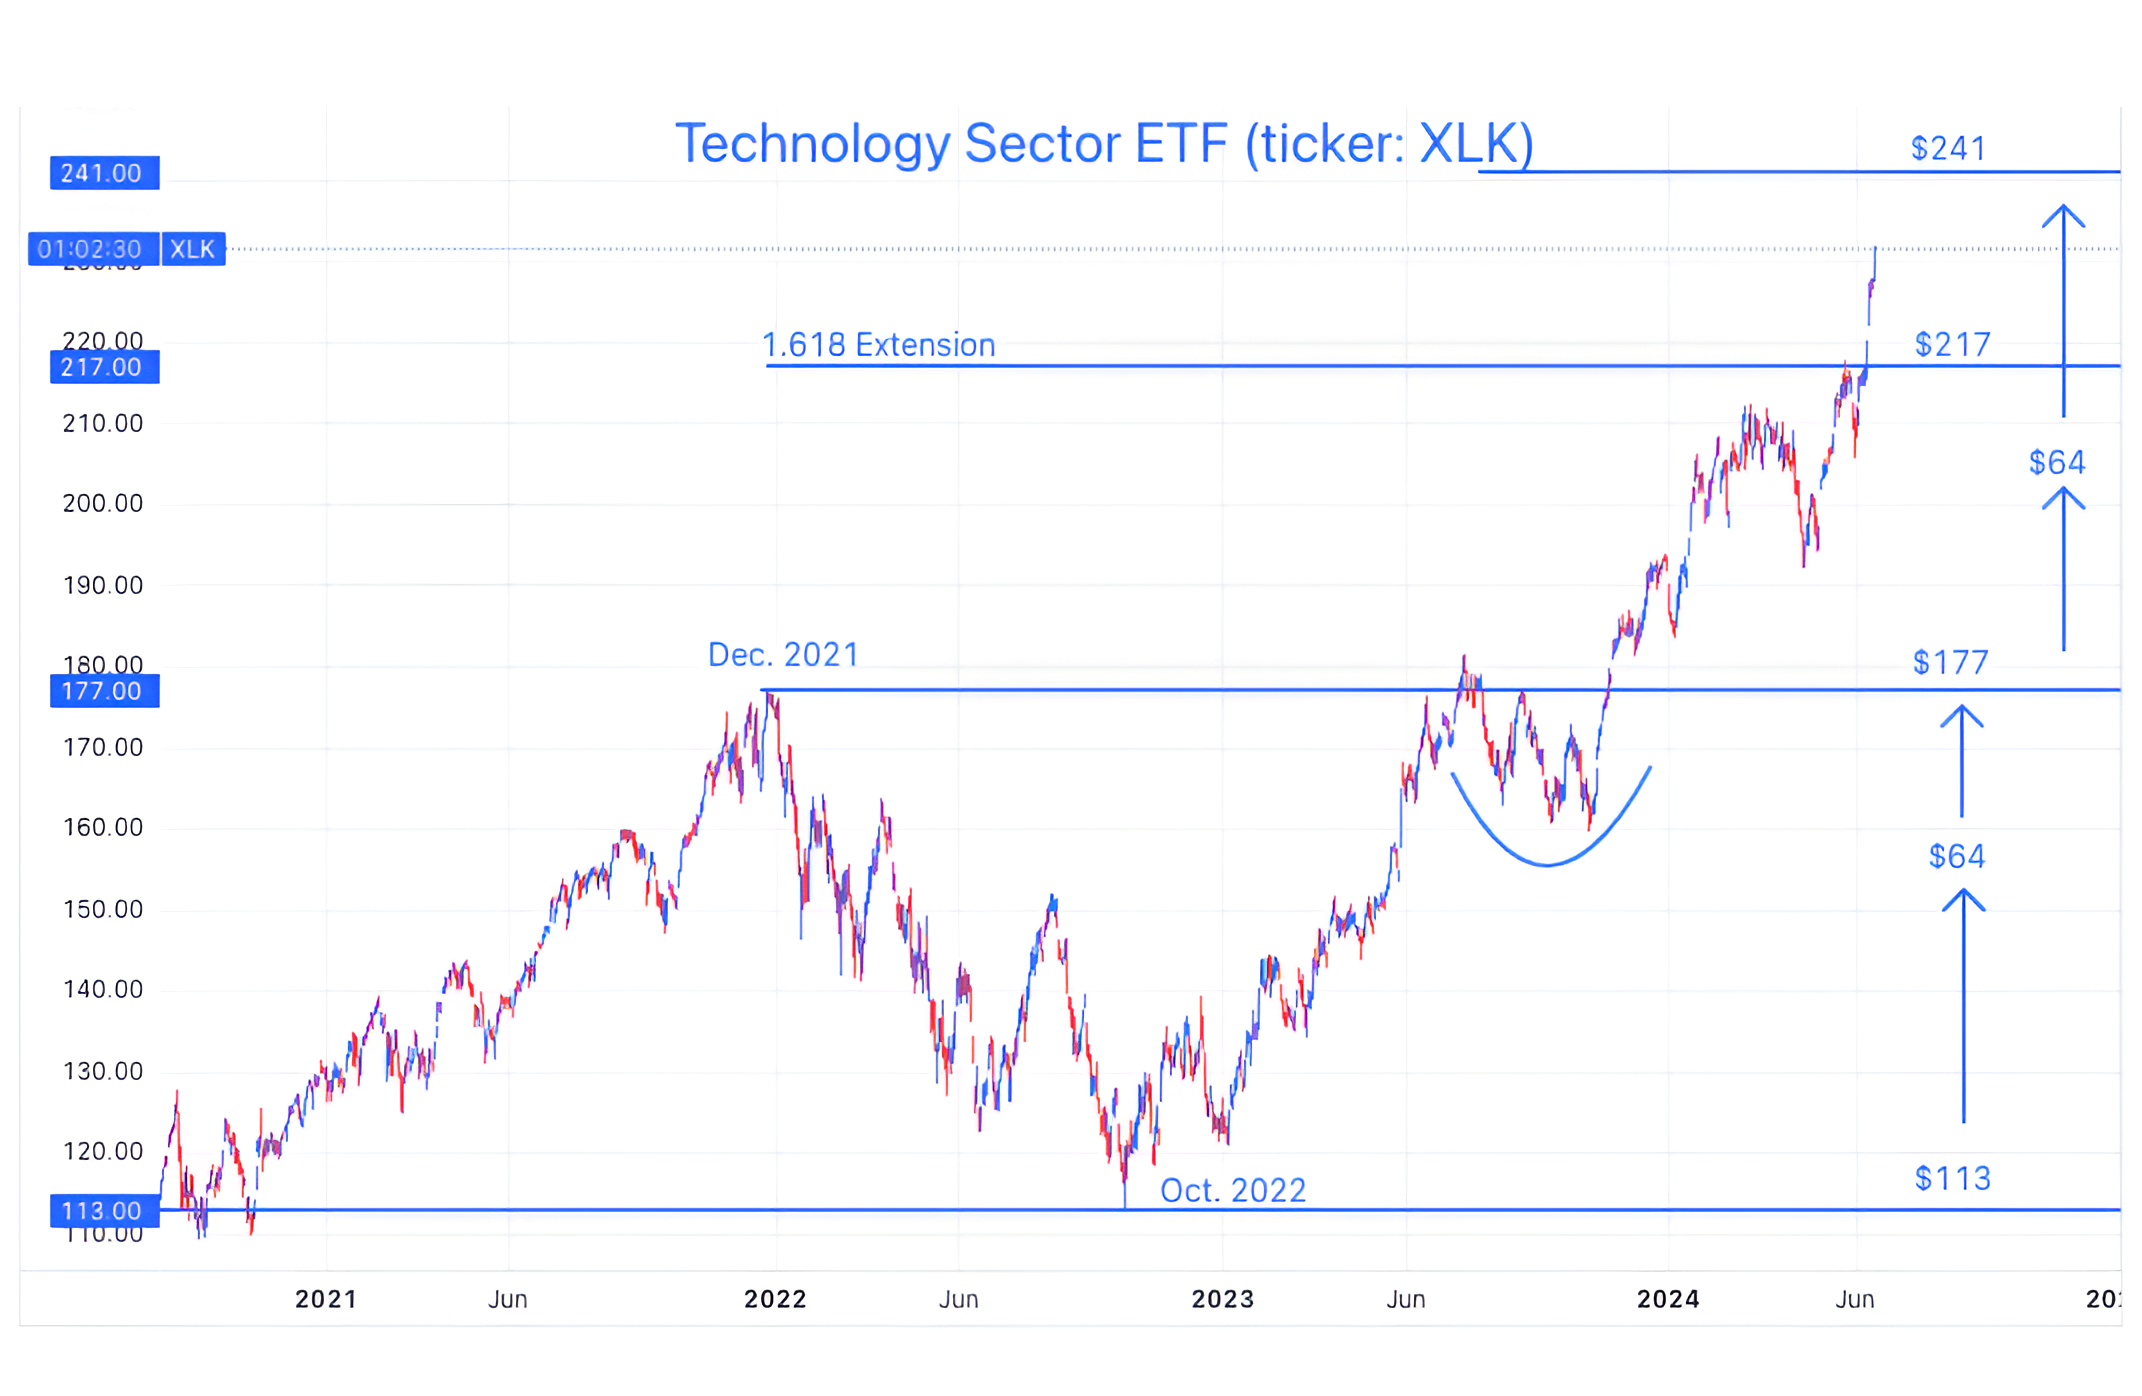
Source: TradingView. Through June 10, 2024.
The Technology sector which includes Nvidia, other semiconductor companies, Apple, software, security and other growth companies has been the best performing of the 11 S&P 500 sectors year-to-date.
When we look at the Technology sector, there are several characteristics to note:
After falling 36% from December 2021 to October 2022, the Technology sector first recaptured its high in July 2023 and then broke through in November.
The December 2021 high - was a month before the S&P 500 made its January 2022 high and the break out to a new high in November 2023 was six weeks before the S&P 500 broke out to a new high in January 2024.
In other words, moves in the Technology sector foreshadowed moves in the overall S&P 500. (Past performance is not indicative of future results).
The Technology Sector battled with the 1.618 Fibonacci extension of its December 2021 to October 2022 sell-off before surpassing it.
Our S&P 500 target level (based on the chart) is the 1.618 extension of its January 2022 to October 2022 sell-off (around 5560). At the very least, we believe that there will be a struggle for the S&P 500 to surpass that level.
Based solely on “symmetry,” we believe that the Technology sector can move to $241. This is about 4% above the current level.
The “symmetry” is based on the $64 range in which the technology sector traded from December 2021 to November 2023.
There are different ways to view the “symmetry” on the S&P 500 - the broadest measure (with the highest upside) targets 6100, whereas the most conservative measure targets 5470.
(This is not a recommendation to buy or sell any security and is not investment advice. Please do your own due diligence).
4. The Magnificent 1

Source: Dow Jones. Through year-to-date May 31, 2024.
We have been highlighting how “narrow” the market has been. (Chart 3 here and chart 5 here.
The chart above shows the “Magnificent 7” (from 2023) and their 2024 return and contribution to the total return of the S&P 500 through May 31.
After the performance in Apple and Tesla over the past two weeks, the 53% contribution to the performance of the S&P 500 from the Magnificent 7 has likely grown.
As we showed last Thursday (chart 3 here), through June 10, the largest 10 positions in the S&P 500 have been responsible for 76.5% of the return in the S&P 500.
We continue to show this as a condition rather than a catalyst or a signal.
That said, we have characterized the condition of “narrow” markets as fragile and when exhibited over extended periods, have resolved negatively. (Past performance is not indicative of future results).
(This is not a recommendation to buy or sell any security, please do your own research).
5. “In the Business World, the Rearview Mirror is Always Clearer than the Windscreen,” Warren Buffett

Source: Creative Planning / Charlie Bilello. Through year-to-date 2024.
I am showing the chart above, not to write about US equity outperformance, but to consider what will come next.
I have had so many people come to me recently that have invested in venture capital, private real estate, private equity, fixed income, non-US stocks, commodities and say, I should have just been invested in the S&P 500 or the Nasdaq 100.
Maybe you should have.
However, in my view this is in the past. Like other market cycles, this will subside.
Non-US equities will have another period of outperformance.
I am old enough to remember 2003 - 2007 when global diversification in equities generated returns outperformance over US equities.
These periods will happen again.
Although I am a believer in exchange traded funds (like SPY and QQQ that mimic the performance of the S&P 500 and Nasdaq 100, respectively) which are considered passive investments, I am also a believer that passive investments should be actively managed.
At some point, it will likely make sense to diversify SPY and QQQ holdings into Emerging Markets (ticker: EEM); Europe (ticker: VGK); Japan (ticker: EWJ) and / or other regions.
Our goal is to help identify and benefit from the changes in trend and performance by looking forward and not back.
(This is not a investment advice and is not recommendation to buy or sell any security).