


Let's Dance!
On Tuesday, we wrote "Please Don't Stop the Music." With Wednesday's data the market continued to move higher as if the music has not stopped. Can it continue? Let's dig in...
Last week, I wrote, “In my view, there is an above average possibility (60-70%) of a 2- to 6-week correction that could range from 3-7%.”
In retrospect, that expectation clearly seems wrong and the puts and put spreads we added to our portfolios will likely expire worthless. This is the price of insurance.
I was asked recently why I continue to point out the equity market’s blemishes.
I have a fundamental background focused on earnings, earnings growth, the macro-economic environment and valuation. For the last 18 months, fundamentals have been questionable (1% earnings growth in 2023, tightening policy, difficult macro, top decile valuation).
For those that view the market solely through a fundamental lens, the 40%+ return in the S&P 500 over this period has been confounding.
This is why I show and have added technicals (charts, market psychology, positioning and sentiment) to my work.
Rather than saying this is how the market should be priced, this allows me to ask what is the market pricing and why?
In my view, the foundation for the equity market, remains fragile.
The largest 10 stocks are responsible for over 70% of the performance year-to-date (see chart 3).
The S&P 500 is trading at over 21x expected earnings (top decile expensive).
There is a questionable economic foundation with extreme fiscal spending in the US (outside of recessionary periods) that at some point will likely have to be resolved through higher taxes, reduced spending or higher inflation.
10-Year yields - despite moving lower in the last week remain elevated and in our view, the “bull market” in Treasuries is over (see chart 4).
Earnings growth that is expected to accelerate to 17% in Q4 and average 14.5% in the first half of 2025 (see chart 4 here) seems aggressive to us.
AI - which has been the spark underneath the market’s fire - is an expense for most companies and has little current revenue use case.
However, as Chuck Prince - the former CEO of Citibank, once said and we wrote in the headline on Tuesday - "while the music is playing, you have to dance."
In our view, the key to the current period will be identifying and timing (to a certain extent) the eventual sell-off.
Trees don't grow to the sky.
Markets that are characterized by imbalances (either elevated valuation or limited / negative earnings growth) are generally cured through time (the move sideways for a period) or price (a drop).
I think it's likely that over the 6-12 months, we will see the imbalances in US equities begin to cure.
That said, despite pointing out the imbalances, within portfolios ,we have been careful, as don’t want to sell prematurely or over-react.
We believe the charts that have kept us “in” on the way up, will also be a guide on the way down.
This is why we take the approach that we do.
1. The S&P 500 Closing in on Our 2024 Target

Source: TradingView. Through year-to-date 2024.
Given the move higher in the S&P 500 this week, we wanted to update the S&P 500 chart that we last showed here.
Despite the trouble “under the surface” in terms of the average stock (that we highlighted here) and the lack of participation in general that we noted here and in chart 3 below, the broad index continues to move higher.
When we last showed the S&P 500 chart, we wrote:
“In our view, the rally will continue for the next 3-9 months driven by technicals and seasonality and supported by stealth liquidity and the expectation of improving fundamentals.
While our S&P 500 target is 5500, it is possible in a blow-off top type scenario that the S&P 500 could move to 5600 or even 5800.
From a technical perspective, this remains a very healthy market.
We would view any small sell-off [the 3-7% sell-off that we were expecting but did not occur] as establishing the initial stages of a higher-high, higher-low pattern, and we would consider this a healthy pullback within an ongoing up move.
When we look for a potential price target based on the chart above, we would look at the 1.618 extension of the January to October 2022 sell-off which is around 5560.
As we always state, we do not rely solely on technicals (chart patterns) for market views or targets, but this level is somewhat consistent with our fundamental view of 5500 based on 20x 2025 earnings of $275 (slightly lower than current consensus).”
We continue to believe that at some point, the “bill will come due” in this market and a more extreme correction (~30%) will take place.
In our view, this is likely to occur within the next 6-18 months.
In our experience, closely watching the internals of the equity market and inter-market relationships can be a helpful guide in risk management.
In the meantime, despite having bought short-term puts and put spreads, we don’t want to over-anticipate a market sell-off given the strength of the current rally.
While there are questions about the foundation of the equity market (and we have highlighted several), those questions are not catalysts.
Catalysts often come in the form of new information: earnings misses; surprise economic data; a spike in oil prices; higher 10-Year yields, or; a wave of defaults.
Thus far, we are seeing none of these and while there may be pullbacks in the equity markets, we do not currently see the set-up for an extreme near-term sell-off.
(This is not a recommendation to buy or sell any security and is not investment advice. Please do your own research and due diligence).
2. Dissecting Yesterday’s Inflation and Fed News
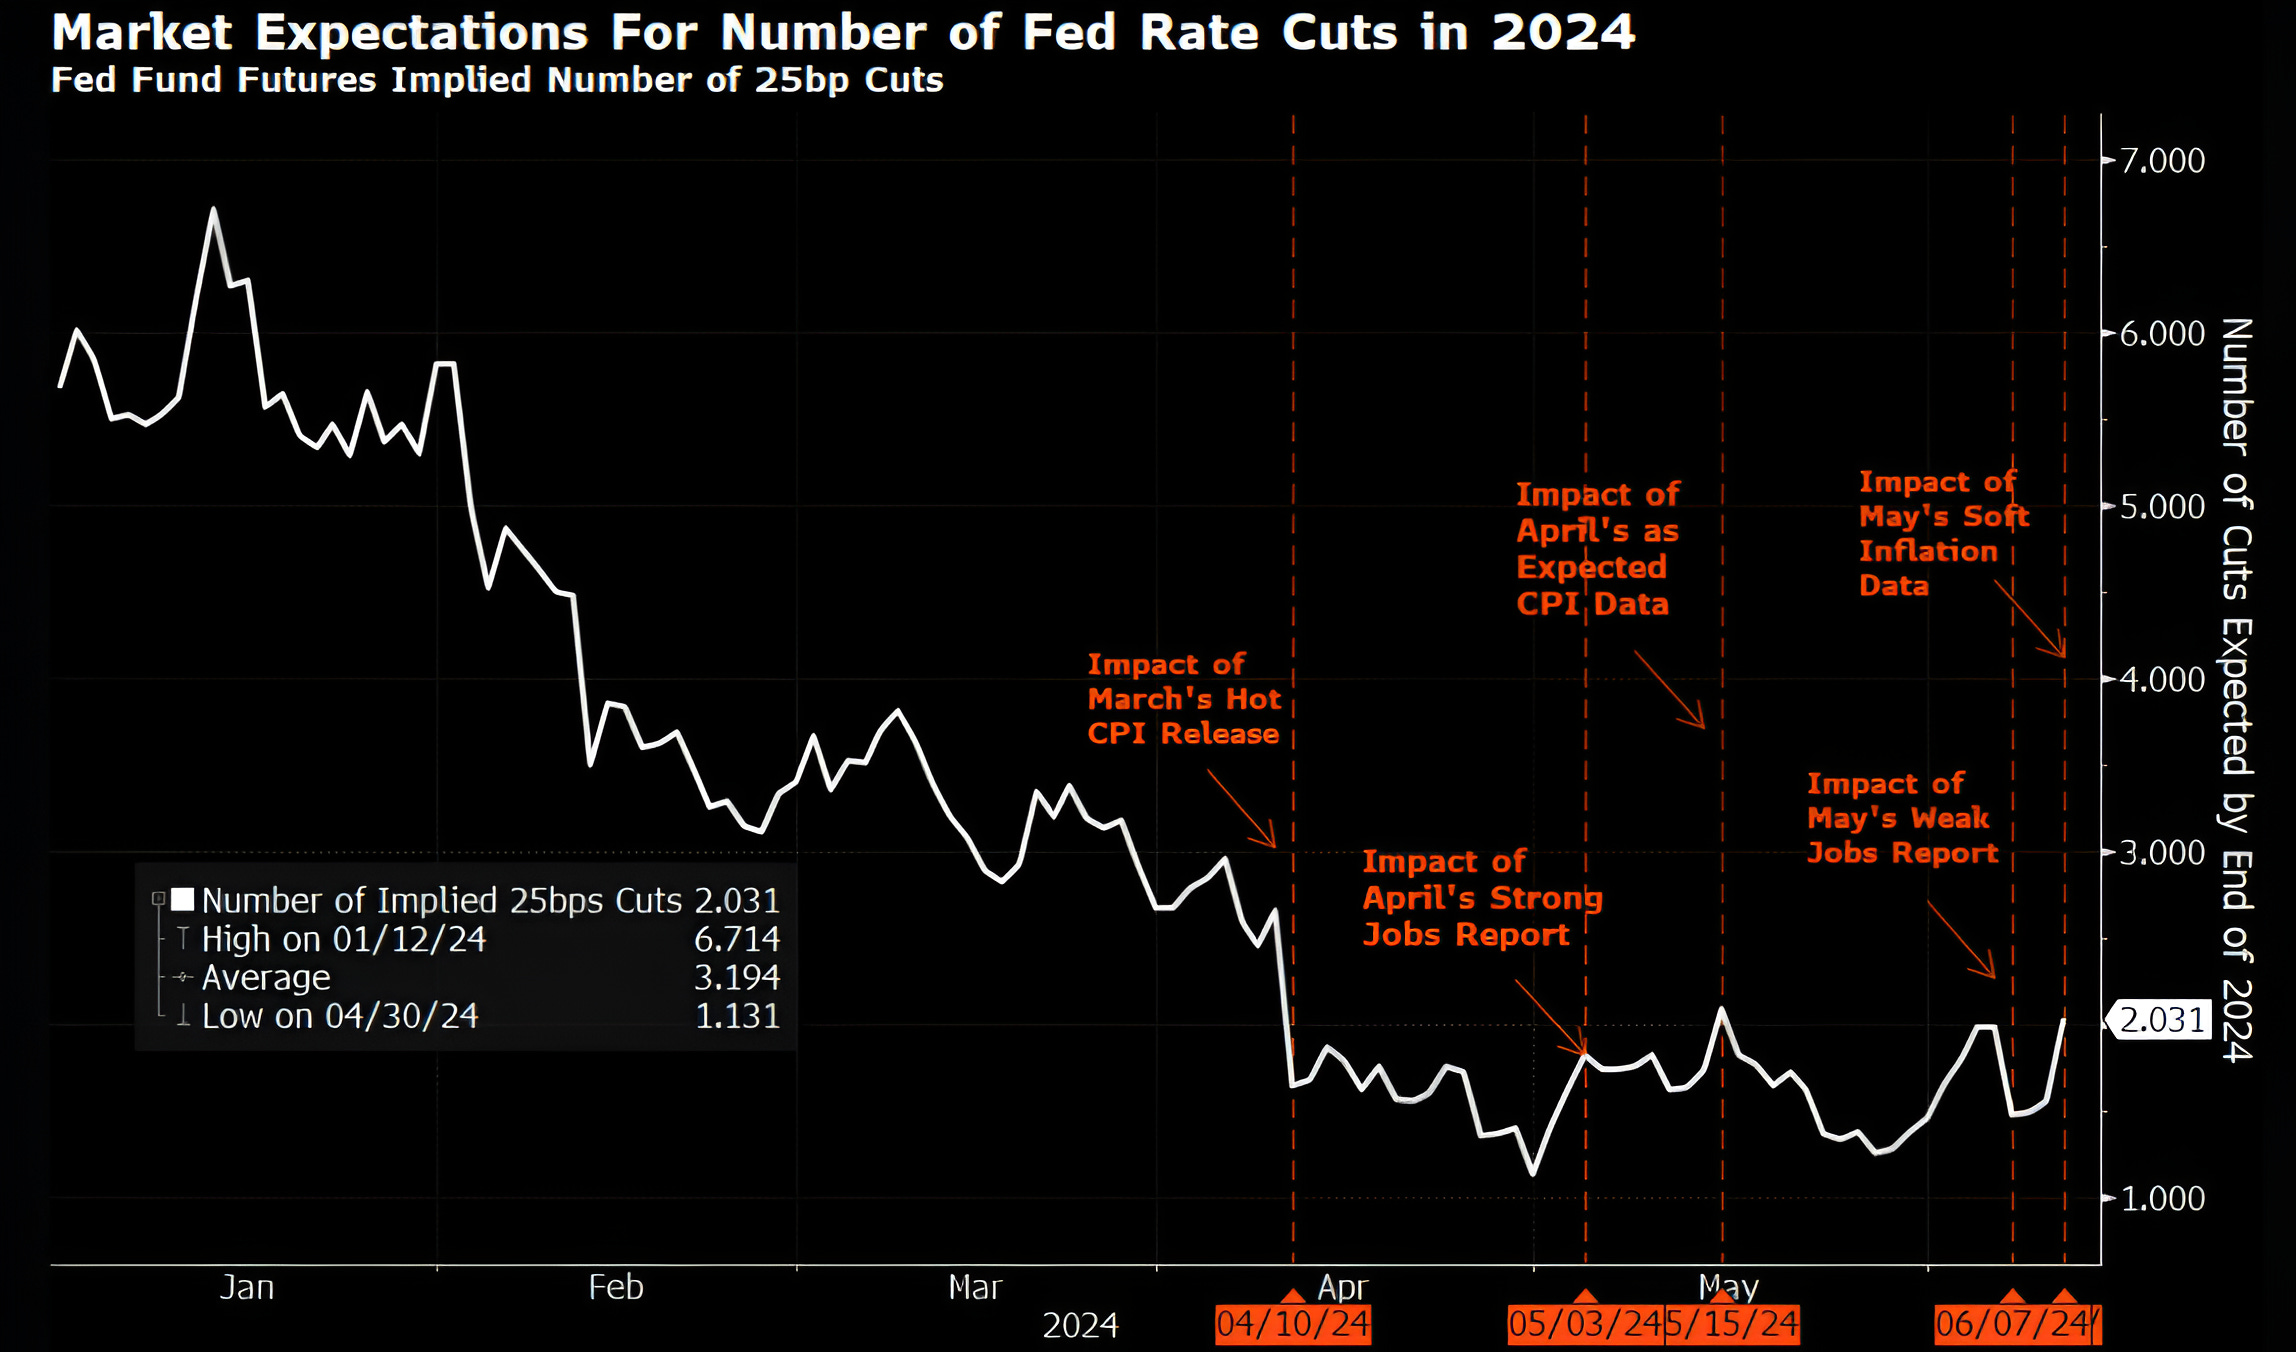
Source: Bloomberg. Through year-to-date 2024.
The chart above shows the market expectations for 2024 Fed Funds rate cuts.
Yesterday, the inflation data came in lower than expected, but the Fed was perceived to be more hawkish than expected.
The May Consumer Price Index (CPI), released yesterday, showed a year-over-year increase of 3.3% down from the 3.4% in April 2024 and slightly lower than the consensus forecast of 3.4% that we showed in chart 3 here.
While there are different ways to parse the data, in general, this was a good report that showed moderating inflation after a Q1 that was characterized by stubbornly resilient inflation data.
Later yesterday afternoon, the Fed, announced its Fed Funds rate policy decision, Chair Powell had his normal accompanying press conference and the Fed released its “dot plot” of expected policy decisions.
Despite the positive inflation news, the “dot plot” reflected a consensus among Fed members of only one rate cut in 2024.
The market (chart above), which was expecting over six rate cuts for 2024 in January, increased its rate cut expectations for the year from 1.5 to 2.
From our perspective, yesterday’s “dot plot” confirmed to us that the Fed will make no policy change at its July meeting and the next “live” meeting will be September.
That said, if the data changes - either growth or inflation - between now and September, we would expect the Fed, either at Jackson Hole, where they will be discussing why monetary policy tightening hasn’t slowed the economy (see chart 4 here - suggestion ask Janet), or at another time, to signal upcoming easing measures (see chart 5).
There are some who believe that the Fed is already late in cutting rates to preserve a soft landing. While others do not believe the inflation battle has been won.
We view ourselves as spectators in this game and are watching equity and Treasury markets for our signals.
Our goal is to navigate markets, make money and ignore academic arguments.
(This is not a recommendation to buy or sell any security and is not investment advice. Please do your own due diligence).
3. Largest 10 Shares are Responsible for 76% of S&P Performance Year-to-Date

Source: Strategas. Through June 10, 2024.
There have only been 5 years of the past 35 when the S&P 500 has had positive performance and the top 10 shares have been responsible for over 50% of that overall performance.
Currently, 2023 and 2024 represent two of those 5 years.
Notably, the year with the highest performance concentration was 2007. If you remember, 2008 was not a great year for the S&P 500.
Similarly, 1999 is another member of this “top 10 account for greater than 50% of S&P 500 performance” club and that too was followed by a challenging year.
What happened in 1999 and 2007 was that few shares were leading the market higher until the economic imbalances that had been holding back the other shares began to impact the leaders. (Past performance is not indicative of future results).
Obviously, imbalances like these can be resolved in two ways:
the under-performers can take the baton from the out-performers and the market can “broaden” out as investors rotate; or
the out-performers, like in 1999 and 2007, can begin to falter as earnings expectations are not realized and valuations are rationalized.
We are open to either outcome. However, this condition in our view is a characteristic of what we have described as a fragile market.
We showed a different but similar view here.
(This is not a recommendation to buy or sell any security and is not investment advice. Please do your own due diligence).
4. The End of the Treasury Bull Market
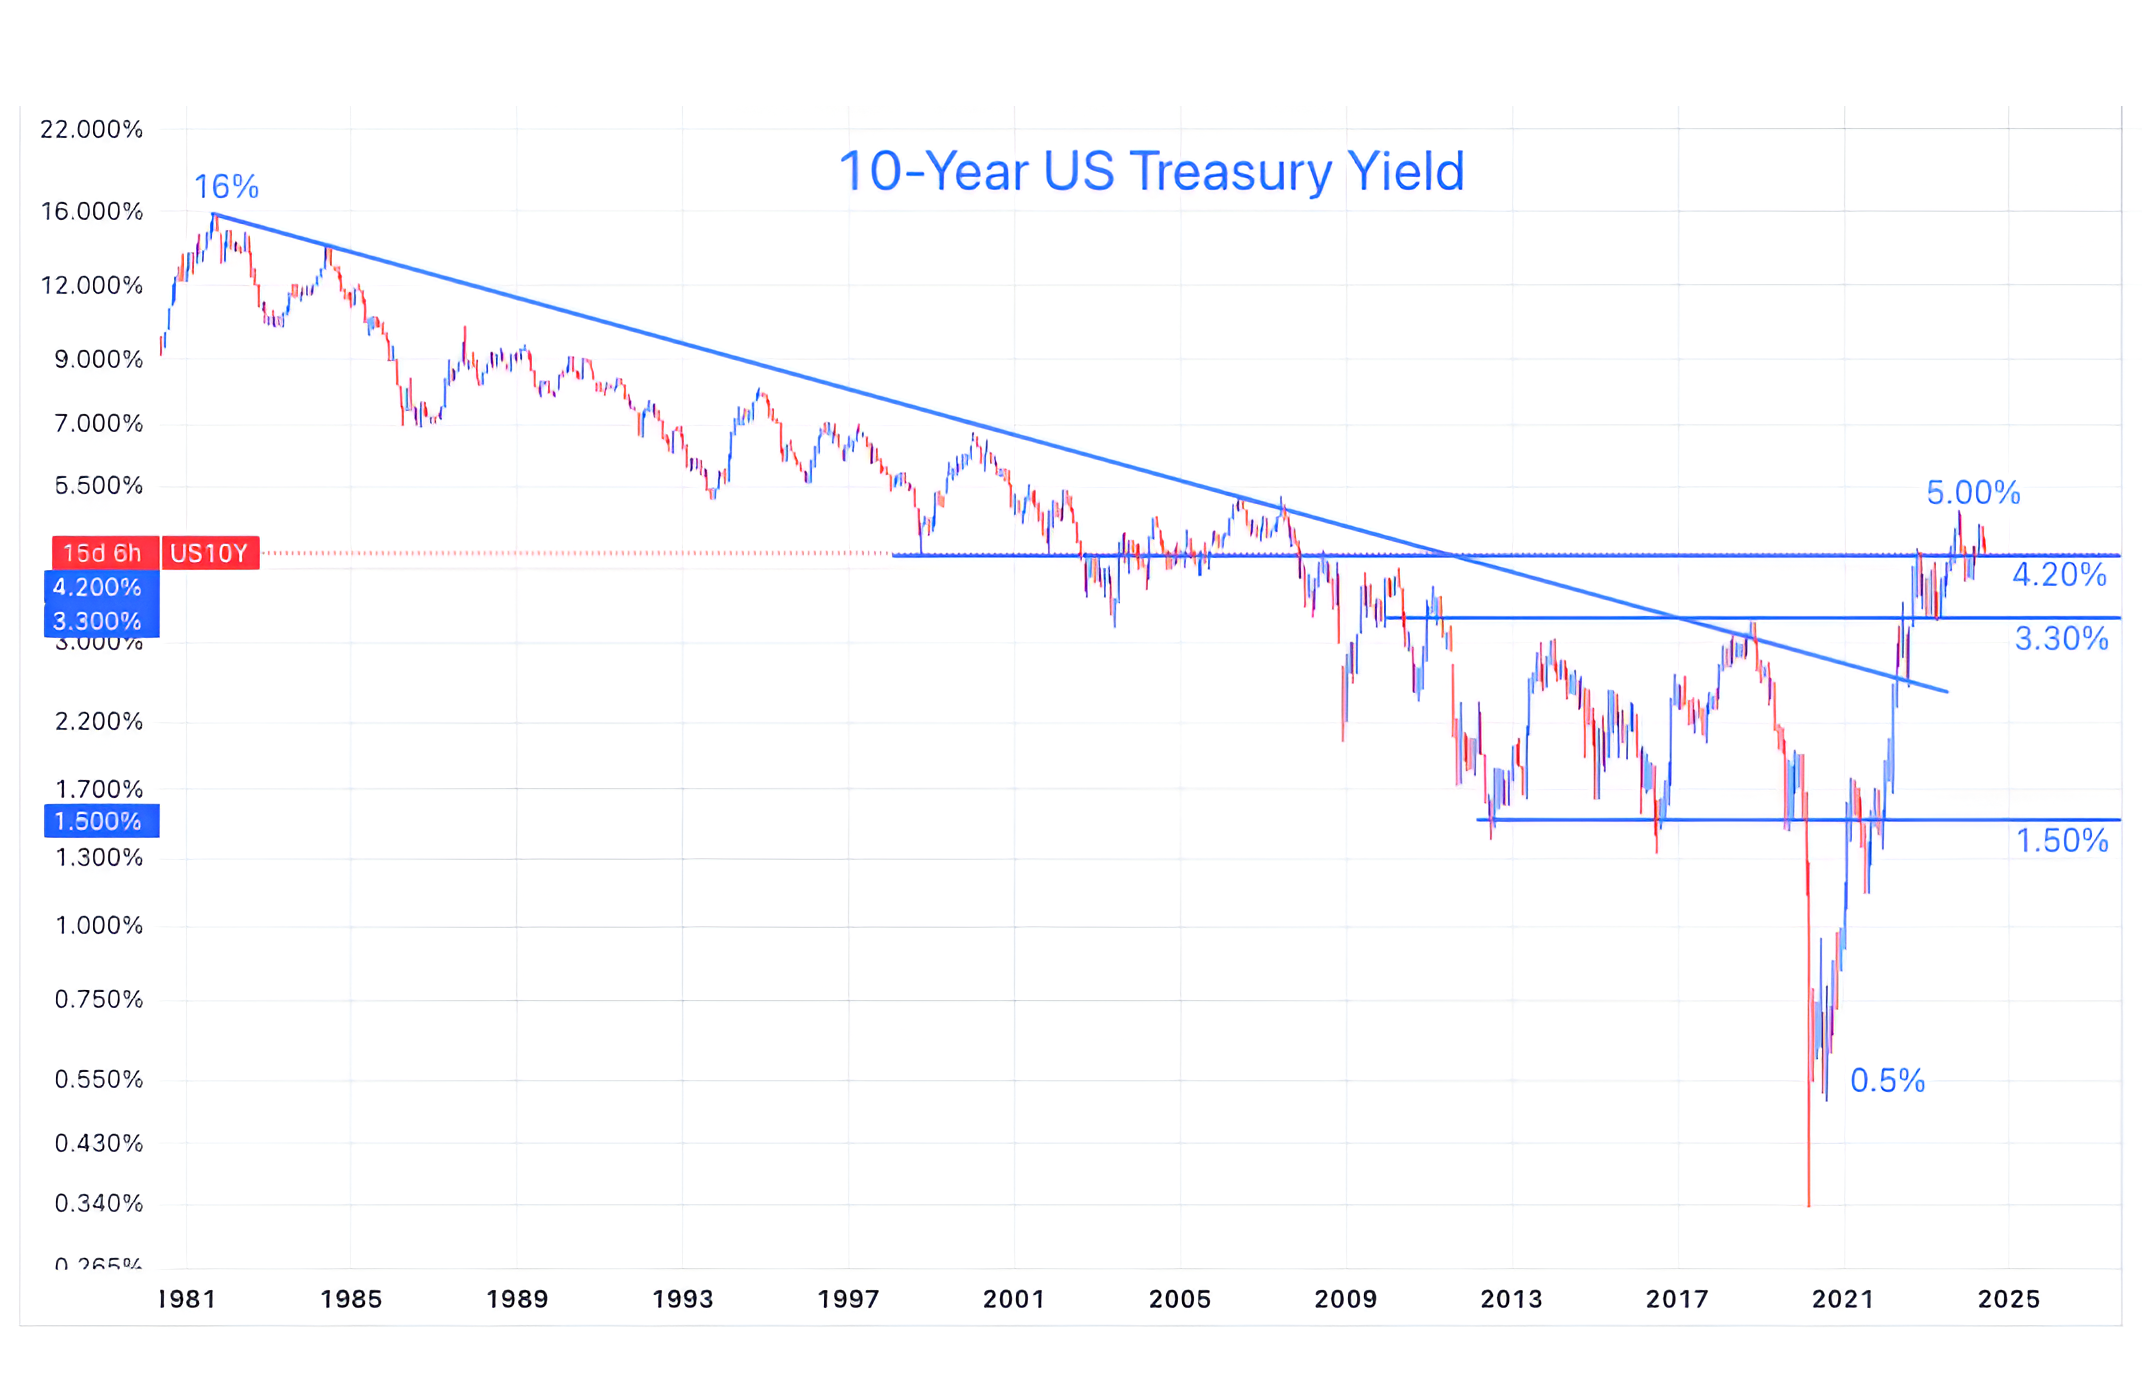
Source: TradingView. Through year-to-date 2024.
On Tuesday, we wrote, “we believe that the nearly 40-year bull market in 10-Year Treasuries is over.” (here)
While we have shown a number of 10-Year US Treasury yield charts (most recently here, chart 4 here as well as here, here, here, here, and here, we realize that we have never shown the long-term (45-year) chart.
When looking at this chart, it is clear the downtrend that characterized yields from their peak in 1980 to their trough in 2020 is over.
Although there is scope for 10-Year yields to move lower, we see the primary trend as stable to higher.
Furthermore, as we’ve continued to reiterate, given the US fiscal deficit, we believe a risk is that “bond vigilantes” could require higher yields to fund the borrowing demands of the US government.
Although it has not been the case in the current period, typically, higher 10-Year Yields are associated with lower equity valuation multiples. (Past performance is not indicative of future results).
Regardless, in our view, Treasuries are in a new regime.
(This is not a recommendation to buy or sell any security, please do your own research).
5. US Monetary Policy in Presidential Election Years

Source: Strategas. Through year-to-date 2024.
Given the changing narrative around Fed rate change expectations, I thought the charts above were interesting.
Rate cuts in US Presidential election years are more common than I thought; however, they have often occurred in Q4 (we have written about Q4 equity rallies in Presidential election years).
Dan Clifton (the best Washington analyst on the street) from Strategas said:
“My guess is that Powell has two rate cuts scheduled in his dot plot, with one pre-election and one post-election.
A pre and post-election cut allows the Fed to say the election did not matter and the central bank is data dependent.
Still, if Powell feels constrained politically later this year, he can replicate Bernanke’s 2010 model when Bernanke used his August Jackson Hole speech to communicate QE2 taking place post-midterm election.
The Fed did not formally launch QE2 until the day after the election, but investors knew what was coming pre-election.”
Interesting to consider.
Have a great weekend!
(This is not a investment advice and is not recommendation to buy or sell any security).