


Please Don't Stop the Music!
Despite our cautious call, equities continue to power higher. As Chuck Prince once said, "As long as the music is playing, you've got to get up and dance." Let's dig in...
On Thursday, I wrote, “In my view, there is an above average possibility (60-70%) of a 2- to 6-week correction that could range from 3-7%.”
Equities clearly did not care what I wrote as the S&P 500 and Nasdaq 100 both closed at all-time highs today.
As I cited US growth as a possible catalyst for near-term equity softness last week, equity and fixed income investors viewed last Friday’s employment report constructively.
However, given some of the mixed data points underneath the headline, the report was ripe for interpretation depending on perspective and agenda (see chart 2).
With the CPI release and a new Fed dot plot on Wednesday, it is certain to be an exciting eventful week.
1. The Average Stock is Still Battling the Jan. 2022 High

Source: TradingView. Through year-to-date 2024.
Unlike the S&P 500 that we showed here and the Nasdaq 100 that we showed here that are both flirting with all-time highs, the Equal Weight S&P 500 peaked in March, made a lower high in May and has been fighting to remain above its 2022 high (top light blue horizontal line).
The average S&P 500 stock is not doing as well as the S&P 500 as we showed in chart 5 here.
We view this as a sign of fragility as fewer and fewer shares are carrying the S&P 500 (and Nasdaq 100) higher.
While this narrow leadership is not a sign of strength, it is also not necessarily a sign of an upcoming sell-off.
In our view, with the employment report and earning season in the past, the inflation report and the Fed announcement - both on Wednesday - will set the tone for equities over the next month.
Our expectation is that there will be near-term equity market weakness, however, the current equity environment has consistently defied any type of bearish expectation.
Rather than prematurely react, we have selectively added puts and put spreads to our portfolios while continuing to emphasize our highest conviction individual equity ideas, sectors and themes.
(This is not a recommendation to buy or sell any security and is not investment advice. Please do your own research and due diligence).
2. Maybe Signs of the “Stag”
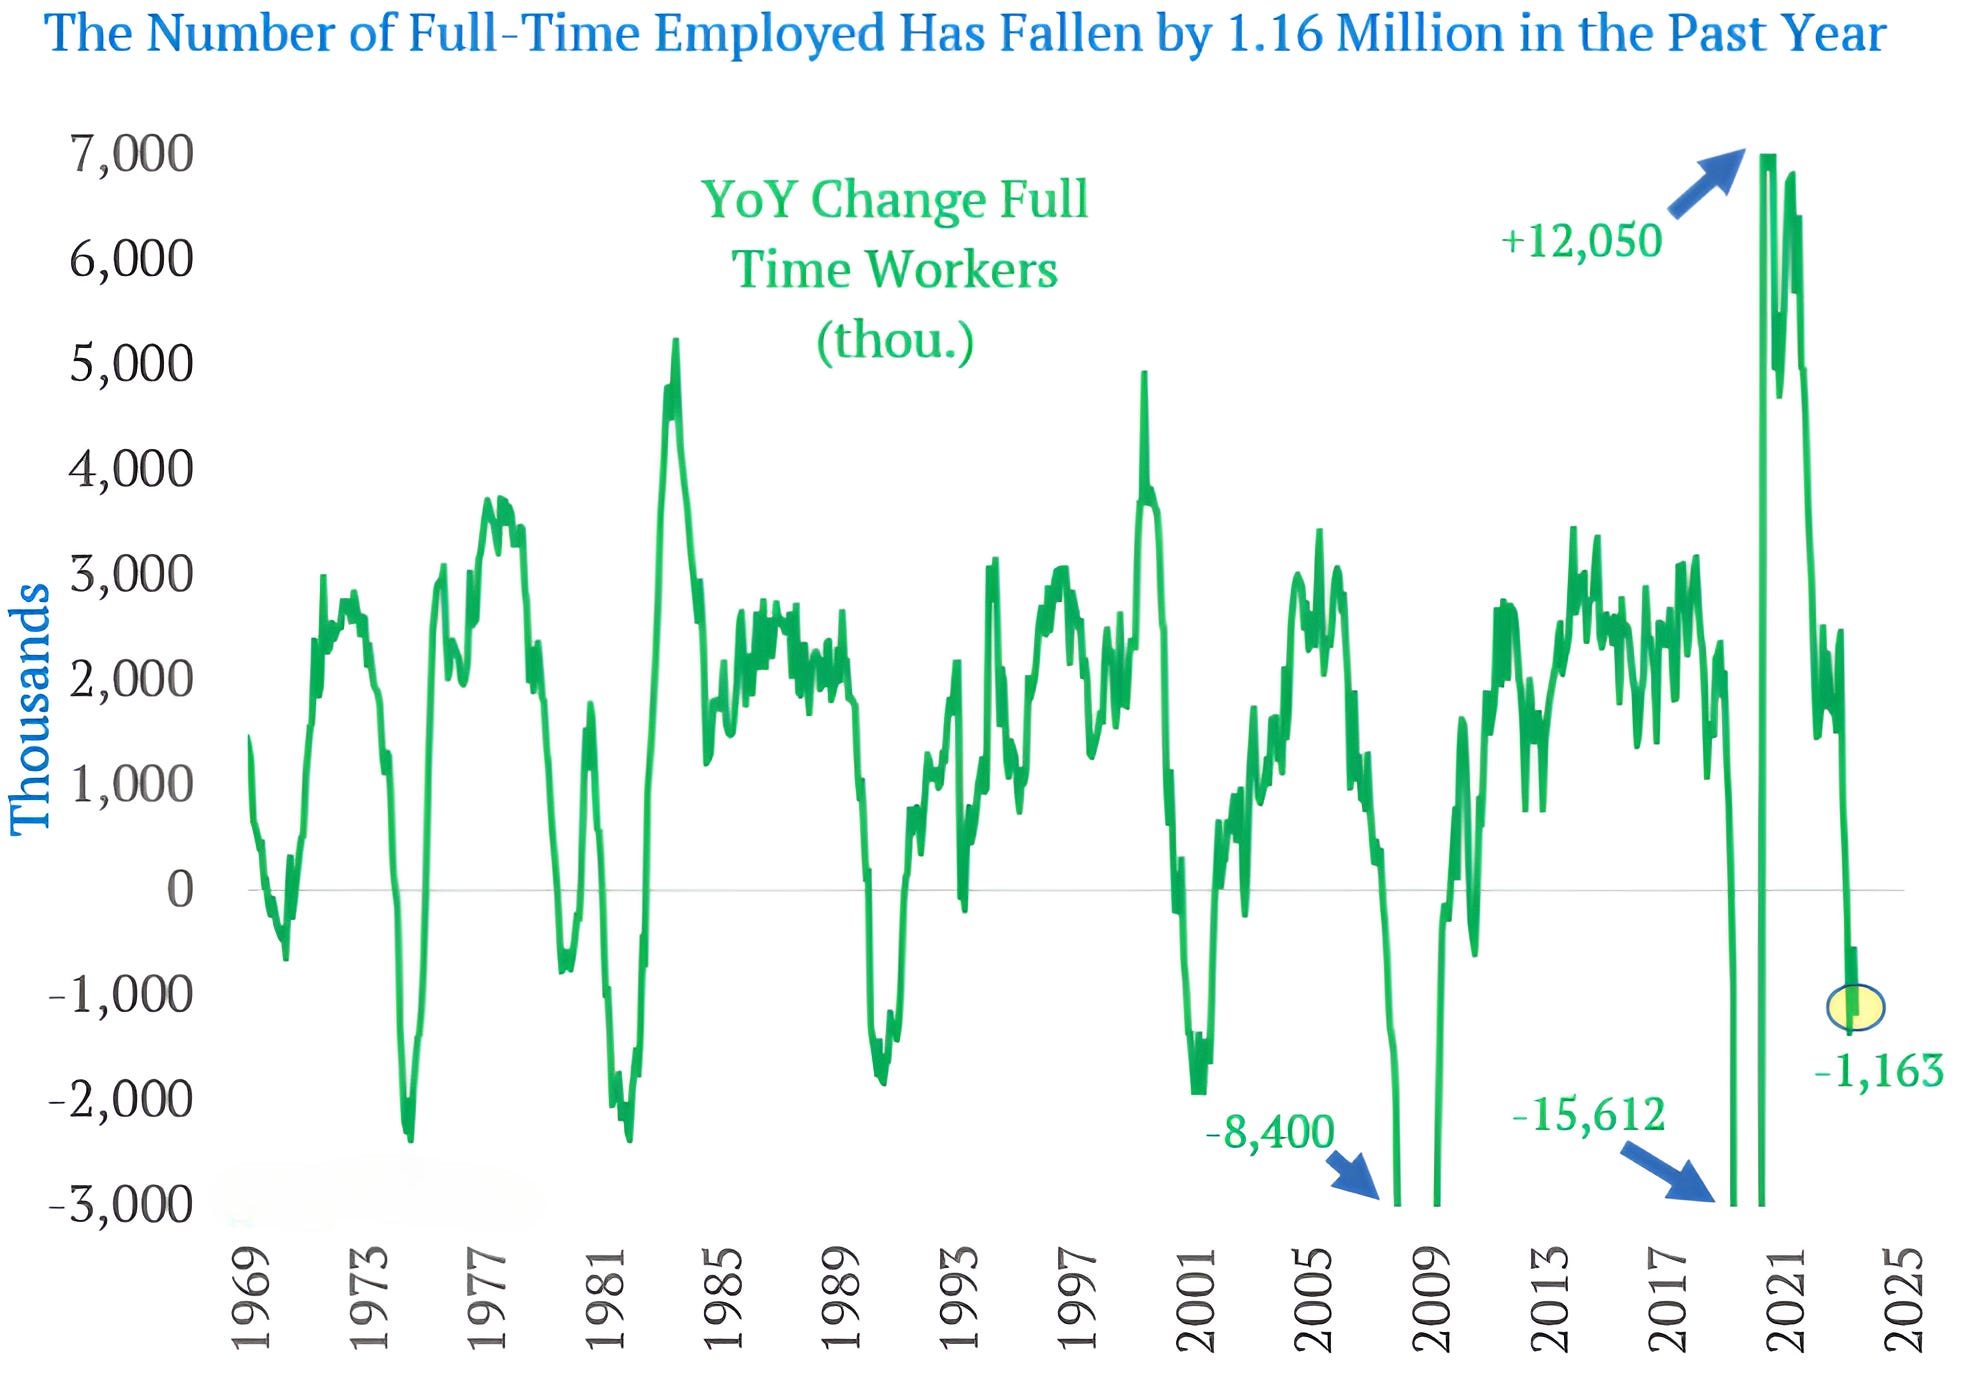
Source: Refinitiv, BLS, Dept. of Labor. Through year-to-date 2024.
Remember 5 weeks ago when Fed Chair Powell said, “I don't see the "stag" or the "flation."”
The chart above that shows the year over year change in full-time workers might be a sign of the “stag” (slowing growth).
In our view, it is notable that the decrease in full-time employment over the past year is at levels at or close to the trough levels of several previous US recessions (1974, 1981, 1990 and 2001).
As we wrote on Thursday, economic storm clouds may be becoming more pronounced.
(This is not a recommendation to buy or sell any security and is not investment advice. Please do your own due diligence).
3. 10-Year Treasury Yields Had a Definitive Reaction to the Employment Report
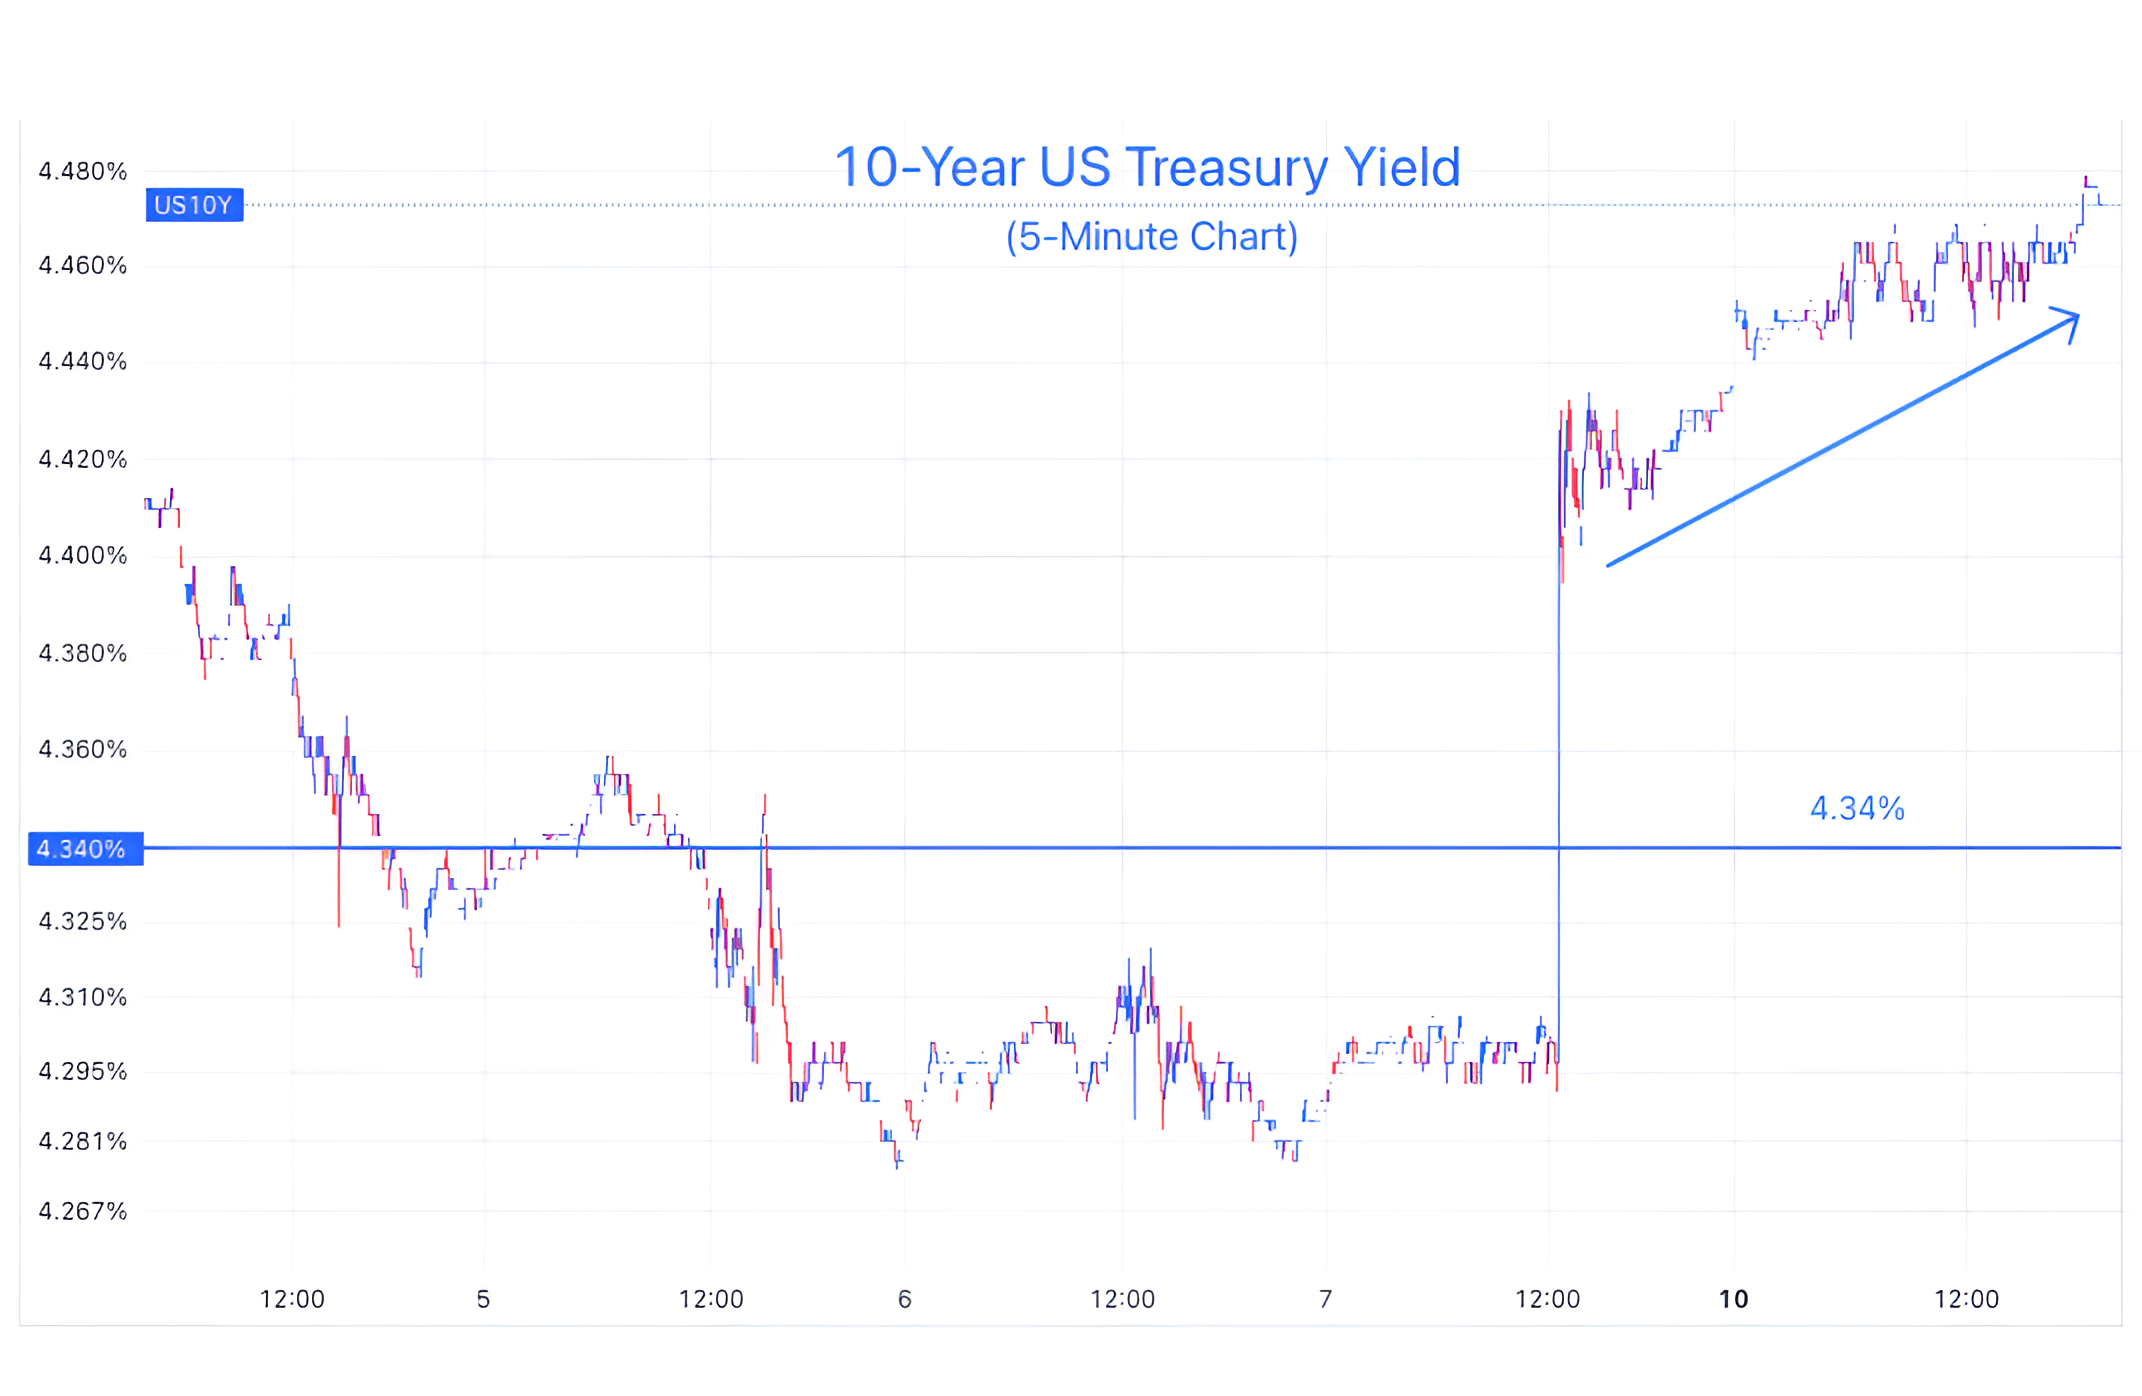
Source: TradingView. Through year-to-date 2024.
While equities seemed to have different reactions to the employment report throughout the day on Friday (down, then up, then down), Treasury yields - as can be seen on the chart above - moved higher (above the 4.34% level that we’ve cited in past) and never wavered.
In general, 10-Year Treasury Yields are considered to price in 1) future growth; 2) inflation expectations and; 3) some additional yield over shorter maturities as compensation for the longer-holding period (term premium).
Given that basic theoretical framework, it is difficult to interpret the driver for higher 10-Year US Treasury yields on Friday:
Are investors considering higher growth given the headline employment number?;
Are they pricing in higher inflation given the above expectations wage component within the release? or;
Was there greater uncertainty of holding for a longer period given the complicated scenario?
Whatever the reason, our view has been that 10-Year US Treasury yields would remain stubbornly high.
While not a theoretical framework, we have believed for sometime that treasury investors, barring a recession, would require higher returns given the US fiscal deficit.
Furthermore, from a technical perspective, we believe that the nearly 40-year bull market in 10-Year Treasuries that saw yields move from above 14% in 1981 to below 1% in 2020 is over.
Within this context, we have believed that higher 10-Year US Treasury yields would pressure US equity valuations lower.
While we saw pressure on equities as 10-Year US Treasury yields moved towards 5% last October, recent 10-Year yields in the 4.30-4.70% range have not seemed to impact equity valuation.
If Treasury yields continue to rise, the inverse relationship with equity valuation may re-assert itself.
(This is not a recommendation to buy or sell any security and is not investment advice. Please do your own due diligence).
4. Growth vs. Value

Source: TradingView. Through year-to-date 2024.
After 3.5 years (since September 2020), it appears that Growth has now established a new level relative to Value.
Although Growth has been outperforming Value since January 2023, the relationship did not make a new high until January 2024.
The relationship peaked in mid-February - around the time when we began to highlight a tone change in equity market - and fell until the end of April.
For the last 6 weeks, Growth has been outperforming and has once again surpassed its September 2020 / November 2021 relative high and has made a new all-time high.
While we would continue to emphasize growth in portfolios, we would not ignore value.
We see the possibility of a move higher in oil prices that could compress some growth multiples. We have added to our Energy exposure as a hedge to our Growth emphasis within our equity portfolios.
(This is not a recommendation to buy or sell any security, please do your own research).
5. An Update on Fiscal Dominance

Source: Convera, Macrobond. Through year-to-date 2024.
We have written about one of our themes - Fiscal Dominance - several times. (See chart 5 here; chart 2 here; and chart 2 here).
Fiscal Dominance is the idea that government debt outstanding and interest payments are so great that they impact central bank policy decisions.
Despite inflation of 3.4% (all eyes on Wednesdays CPI release); reasonable employment (depending on how you view last week’s employment report); and equities at an all-time high, the Fed is biased towards cutting rates and has already slowed its quantitative tightening (“QT”) policy.
Looking at charts like the one above - which shows the amount of US government debt that will mature in the next year - it is clear that no entity is more sensitive to higher Fed funds rates (that impact the borrowing costs on shorter maturity “bills” that the Treasury has been emphasizing) and longer-term Treasury yields than the US government.
This will continue to impact policy makers and it remains a concern of ours that given the US fiscal condition, Treasury yields could spike higher.
In the meantime, however, while the music is playing, we have to dance!
(This is not a investment advice and is not recommendation to buy or sell any security).