


Groove is in the Heart
Last week we highlighted the correction under the surface. The Nasdaq 100 and Nvidia closed with a fragile technical patterns. We continue to determine if its noise or signal. Let's dig in...
1. Bearish Engulfing Candles…

Source: TradingView. Through year-to-date 2024.
Despite last week’s late Friday rally, the Nasdaq 100 was left with a “bearish engulfing candle” on its weekly chart.
A “bearish engulfing candle” is when the week (or any time frame) opens above the prior week’s open and closes below the prior week’s close - in this way the price action exhibited in the candle “engulfs” that of the prior week.
Visually, on the chart above, this has occurred when there is a red candle (down week) following a blue candle (up week) and the top of the body of the red candle (ignoring the “wicks”) is above the top of the body of the blue candle and the bottom of the body of the red candle is below the bottom of the body of the blue candle.
I have circled the times over the past 4 years when there have been “bearish engulfing candles” at 52-week highs and have arrows identifying times when they have occurred not at a 52-week high.
Last week’s “bearish engulfing candle” occurred at a 52-week high.
In general, since covid, weekly “bearish engulfing candles” have foreshadowed further equity market turbulence. (Past performance is not indicative of future results).
In some cases this equity market turbulence has been innocuous sideways “chop” and in other cases it has been much more meaningful such as at the November 2021 high.
In the current case, it should be noted that the “bearish engulfing candle” on the weekly chart coincided with a “bullish engulfing candle” on the monthly chart.
I am not sure which will be dominant or how this might work.
In general, we never consider one indicator to draw a conclusion and we always look for “confirmation” in the form of price action and other evidence.
Given our constructive view of equity markets through year-end, we could see the current “bearish engulfing candle” as foreshadowing some downward and frustrating “chop” through the month.
If this is the case, we would try to be opportunistic.
As always, we remain open-minded and our views can change as the facts change.
For the time being we would put this condition in our things to be aware of basket rather than our things to react to basket.
(This is not a recommendation to buy or sell any security and is not investment advice. Please do your own research and due diligence).
2. Watching Nvidia for Clues…

Source: TradingView. Through year-to-date 2024.
There is not single stock that we have written about more than Nvidia.
We believe that is for a good reason - we have called Nvidia the “Straw that Stirs the Market’s Drink” and there has been no more important share in the US for the past year.
While we have covered the company’s fundamentals in Chart 2 here, here, here and here; we also believe that the technical pattern of Nvidia is important to the overall S&P 500.
Unlike the Nasdaq 100 (chart 1), last week, Nvidia formed a “shooting star” pattern (the red candle with the long top wick all the way on the right).
A “shooting star” is composed of a small body at the lower end of the trading range with a long upper wick and a little lower wick.
This can sometimes indicate a reversal after a rally.
We would note that the shooting star took place in the $1100-$1150 zone which is just below the $1200 target we presented here based on 30x an estimate of $40 in 2026 earnings.
Similar to the “bearish engulfing pattern” in chart 1, we need to see confirmation and would not take history as a guide.
We will conclude with two thoughts:
We are watching Nvidia to provide clues and / or confirmation about equity market direction;
Nvidia, similar to the Nasdaq 100 ended last week with a fragile chart pattern.
(This is not a recommendation to buy or sell any security and is not investment advice. Please do your own due diligence).
3. 4 Months Up, 1 Month Down, Next Month Up = Bullish
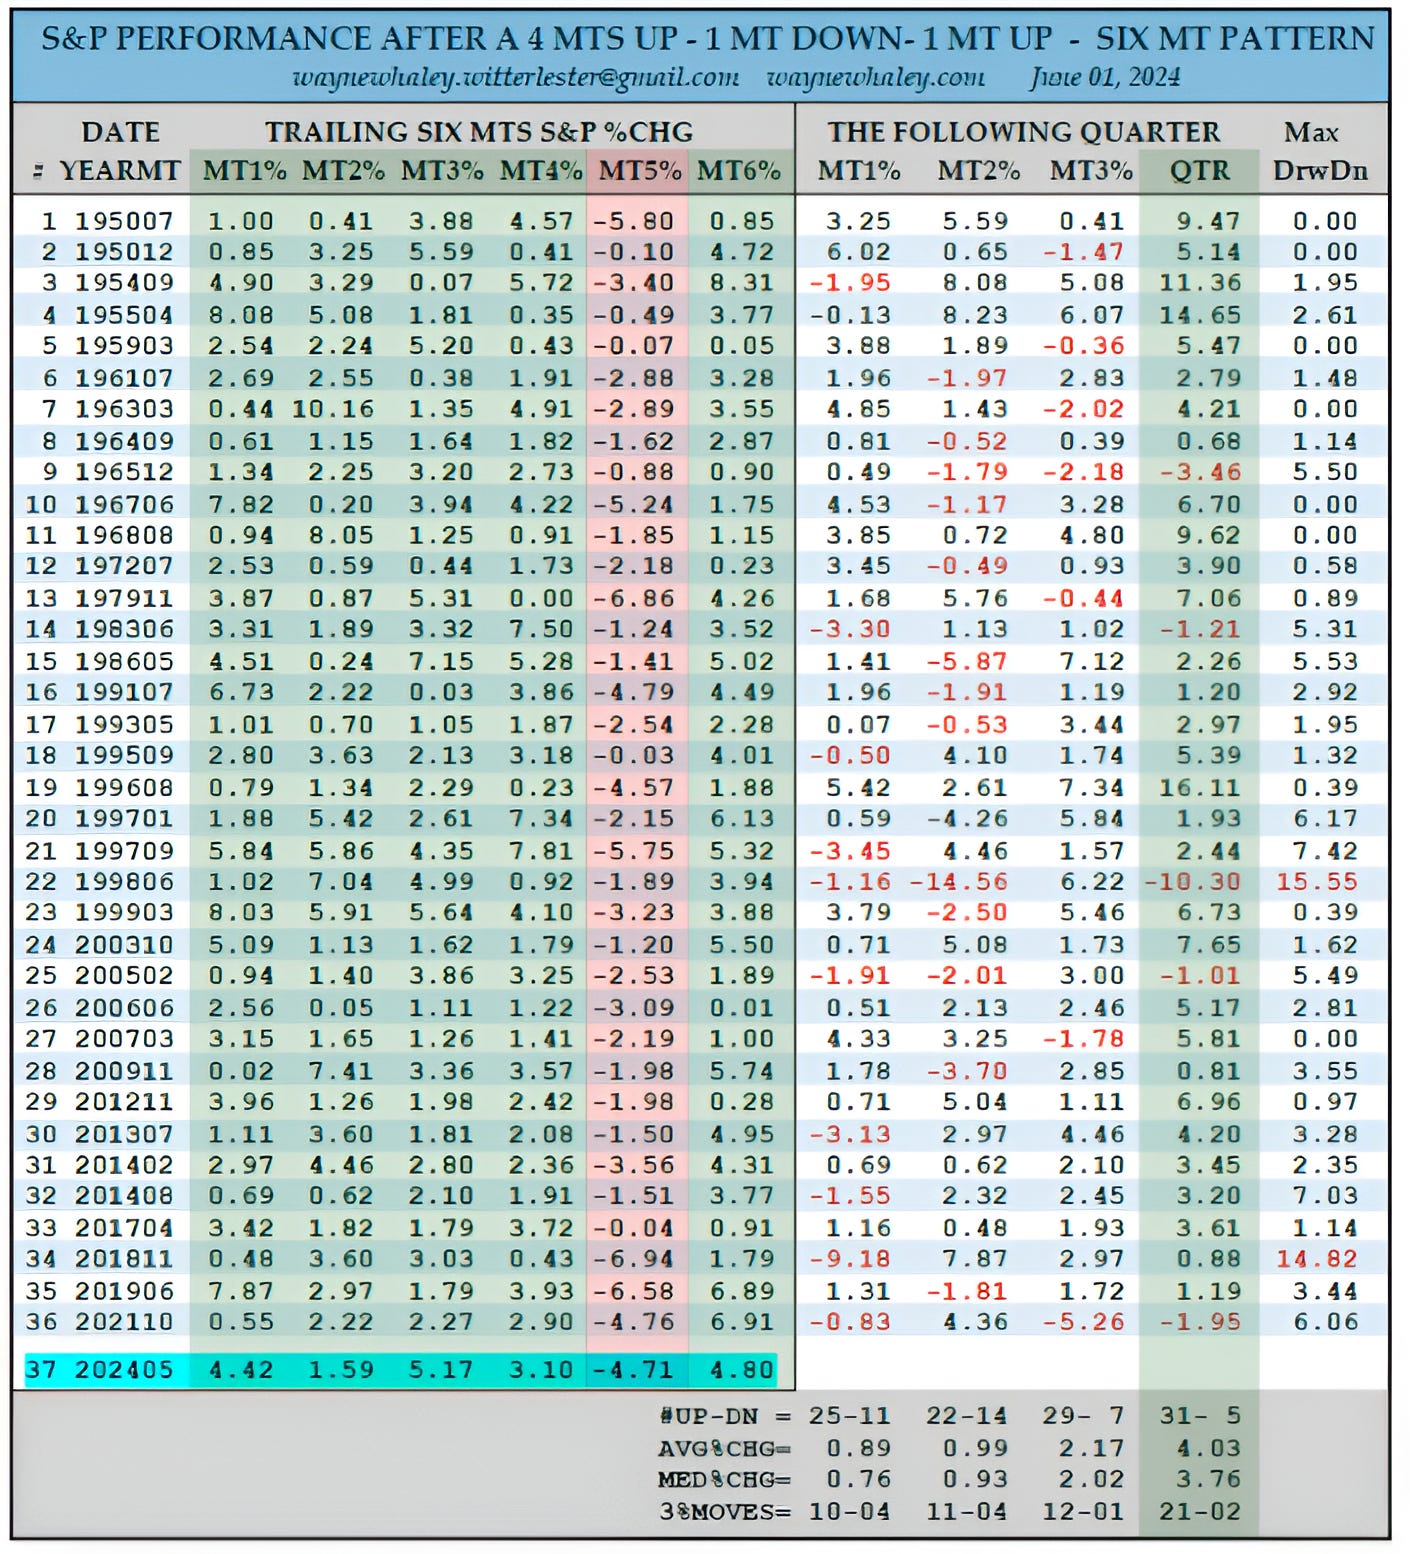
Source: Wayne Whaley. Through year-to-date 2024.
While it seems obscure, the S&P 500 has had a 6 month pattern of 4 months up, 1 month down and the next month up 37 times (including the past 6 month period) since 1950.
In the month following this pattern, the historic “win” rate (positive instances) has been 69%.
There have been 10 instances of 3%+ up months and 4 instances of 3% down.
While the 3 individual months post this 6-month pattern exhibit similar characteristics to those cited above, the historic results for the full quarter following this 6-month pattern are worth noting.
Historically, the quarterly win rate after this pattern has been 86% with an average return of 4%. There have been 21 3%+ moves and only 2 3% down moves. (Past performance is not indicative of future results).
Last week, when looking at seasonality (chart 5 here), we presented the analogy of a good black jack draw or poker hand. It doesn’t guarantee success, but it may alter the odds and your betting style.
We might put this chart in that category.
(This is not a recommendation to buy or sell any security and is not investment advice. Please do your own due diligence).
4. AI is Not Green
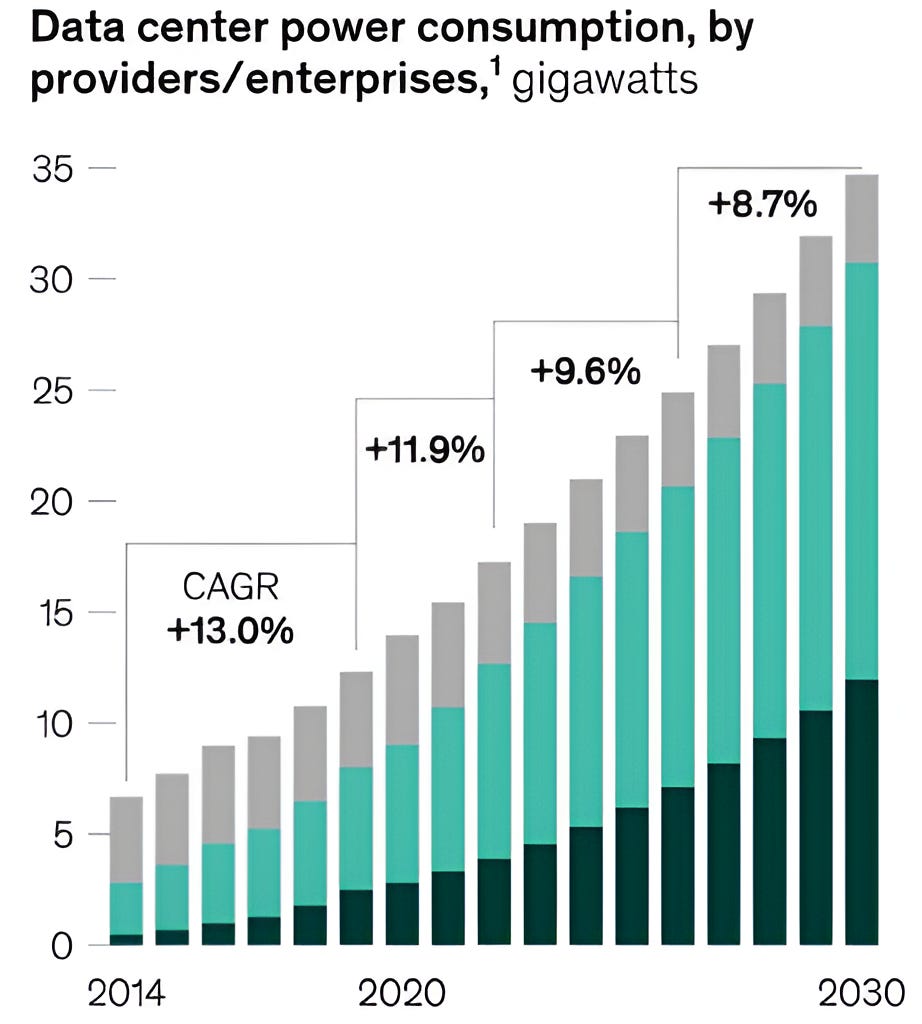
Source: McKinsey. Through year-to-date 2024.
One of the challenges in the race to our AI future is energy production and consumption.
The chart above from McKinsey estimates that data center power consumption will double from 17 gigawatts currently to 35 gigawatts in 2030 (roughly 10% growth per year).
We’ve shown the increase in hyper-scaler CapEx here.
While the numbers will likely be wrong, the trend of increased power consumption is likely to be accurate.
Combined with electric vehicle goals and charging station infrastructure, AI will likely drive demand for utilities, copper and, potentially, uranium (non-carbon energy).
We have showed utilities here; here; and here.
We have showed copper here and copper miners here.
And we showed uranium here.
(This is not a recommendation to buy or sell any security, please do your own research).
5. Can EM Equities Hold the Line?
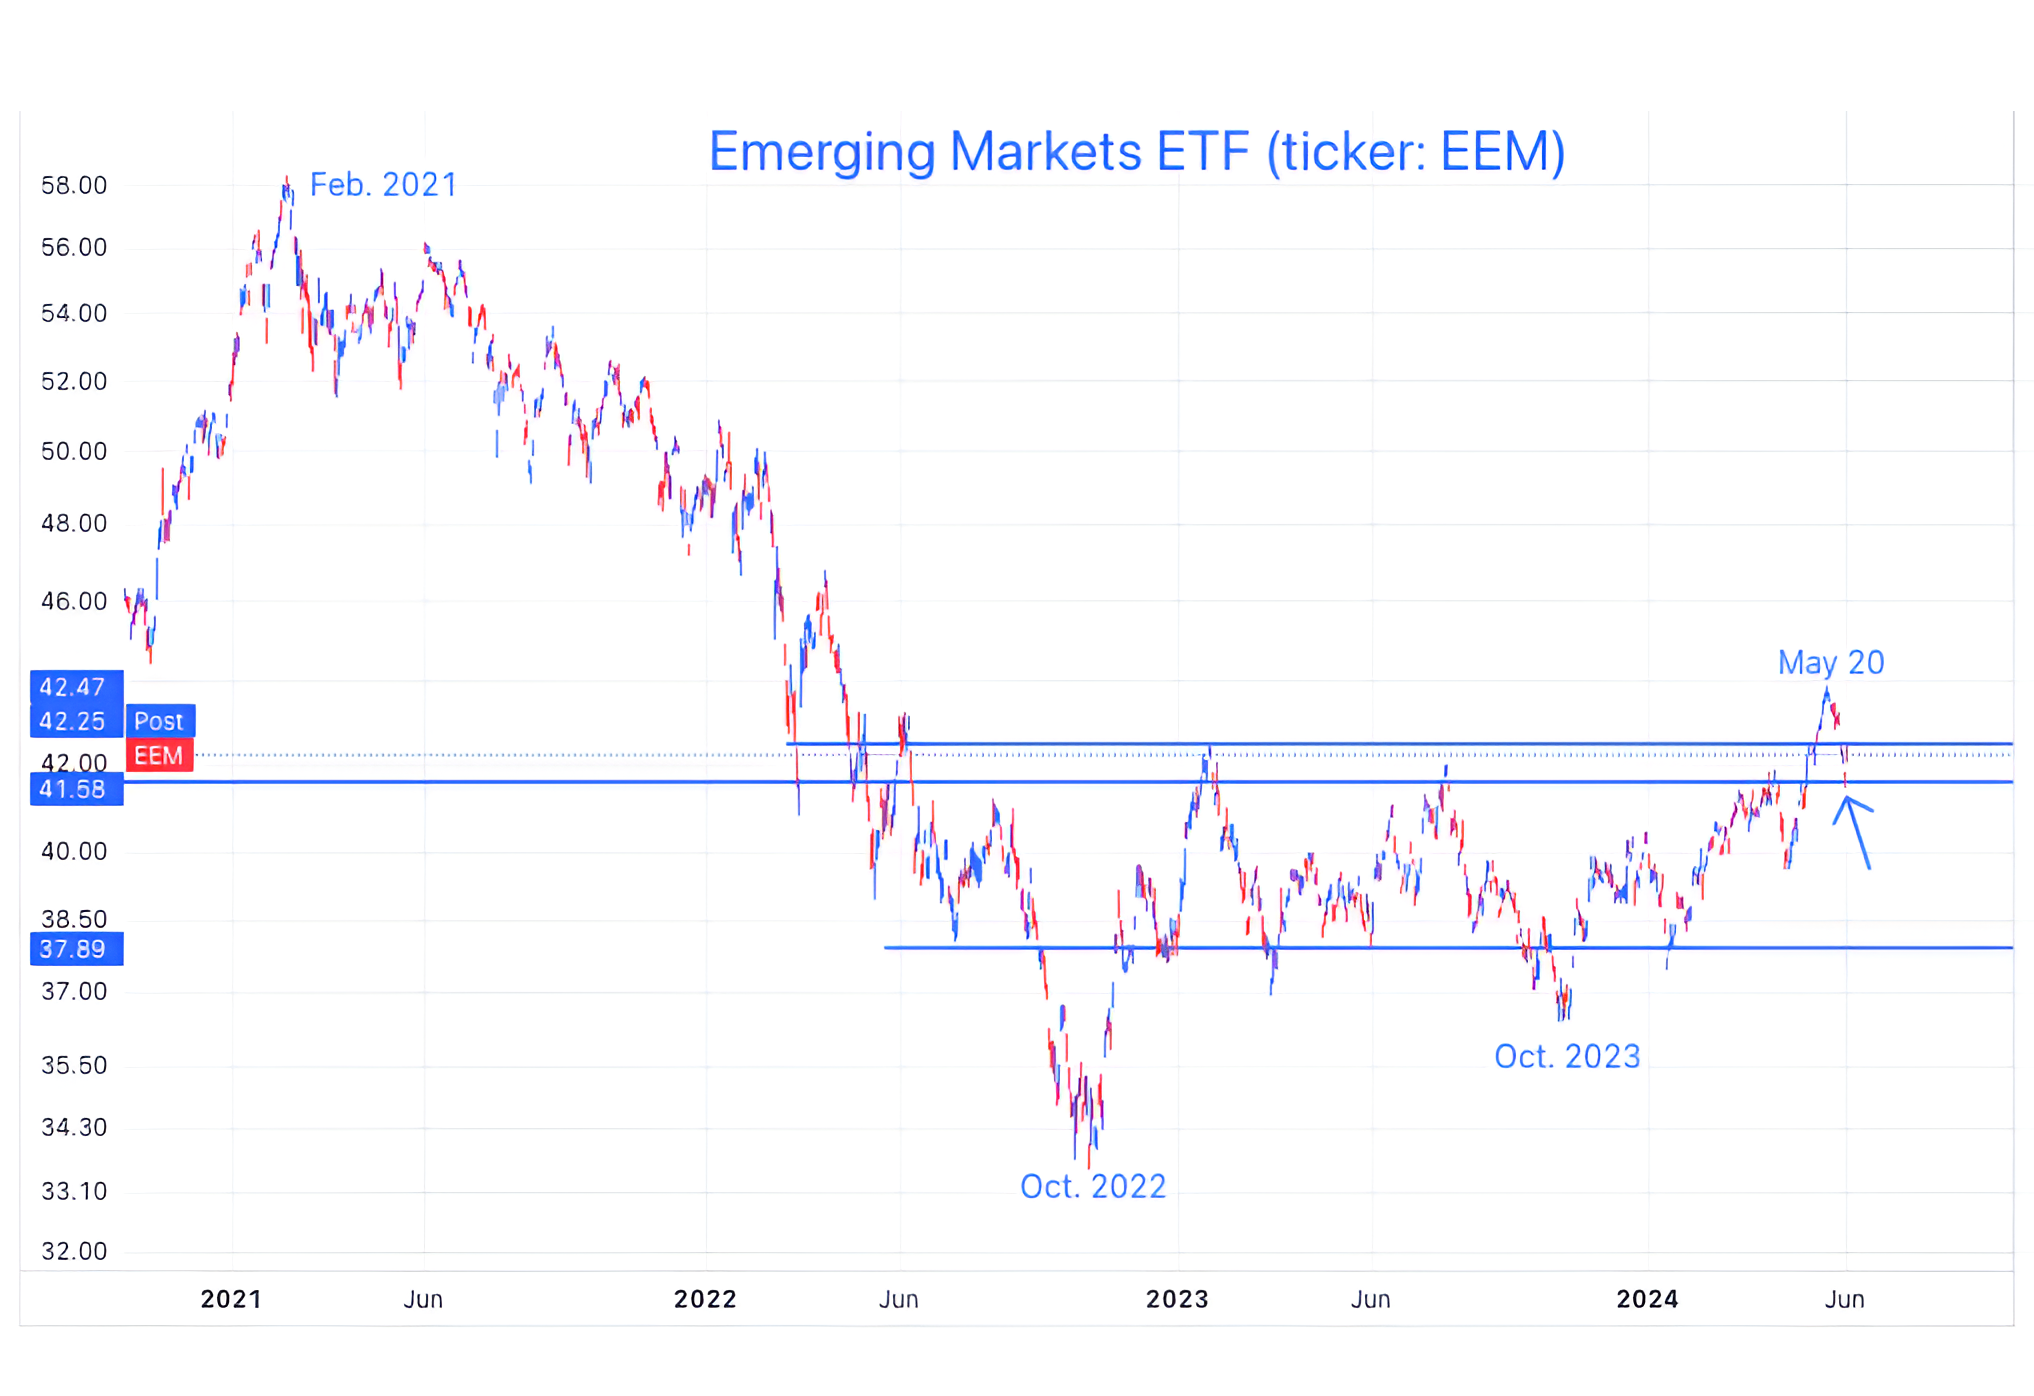
Source: TradingView, Bloomberg. Through year-to-date 2024.
We looked at EM equities about 6 weeks ago (here).
At the time, the EM ETF was trading in its 2023 trading range (between the two lower horizontal light blue lines) and we wanted to see if it could move to the north.
In May, the EM ETF broke above its 2023 trading range and hit a 2-year high. However, over the last 2 weeks it has fallen back to its prior ceiling level.
What will EM Equities do - bounce or collapse?
As a reminder, 25% of the EM Equity Index (and ETF) is in Chinese equities.
We last showed the Chinese Internet ETF just over 2 weeks ago here, and wrote that it was nearing our target.
Since that time, it has dropped 11% and pulled the EM ETF down with it.
We believe that if Chinese equities can stabilize and move back towards our target level and the dynamics of the other EM countries remain resilient, the Emerging Market ETF could bounce from (or near) current levels.
(This is not a investment advice and is not recommendation to buy or sell any security).