


Don't Stop Believin'
Nvidia reports tomorrow. Over the past year, no other company has set the tone in global equity markets like Nvidia. Will they exceed expectations or disappoint? Let's dig in...
“'Twas the night before Jensen, and all through the Street,
Every trader was nervous, fearing defeat.
For Huang's big reveal was just hours away,
Nvidia's earnings due the next day.
The market had banked on Nvidia's rise,
With growth in data centers and GPUs priced,
Hopes pinned on revenue, twenty-seven billion or more,
A forecast of strength to calm worries galore.
Pod shops were fretting over tough comps ahead,
With large cap growth they’d all made their bed,
AWS halting orders of Hopper chips raised concern,
Adding to worries of what tomorrow might learn.
The threat of hyperscalers shifting to ASICs loomed near,
Or halting new orders, should tech gains be mere.
Yet bullish tales of Meta’s rising capex persisted,
With new AI use cases that investors insisted.
CoreWeave’s GPUs as collateralized loans,
Saving levered beta or getting tech longs owned,
“Eventually they’ll miss” the bears would complain,
“35 price to sales!” they groaned through the pain.
Jensen in his leather jacket, cool and composed,
Will he meet the high bar that last year imposed?
Can he pull it off once again, and deliver the goods?
Or will our hopes leave us worse off than Cathie Woods?”
— Citrini (Substack and Twitter) vis AI.
1. Nvidia.
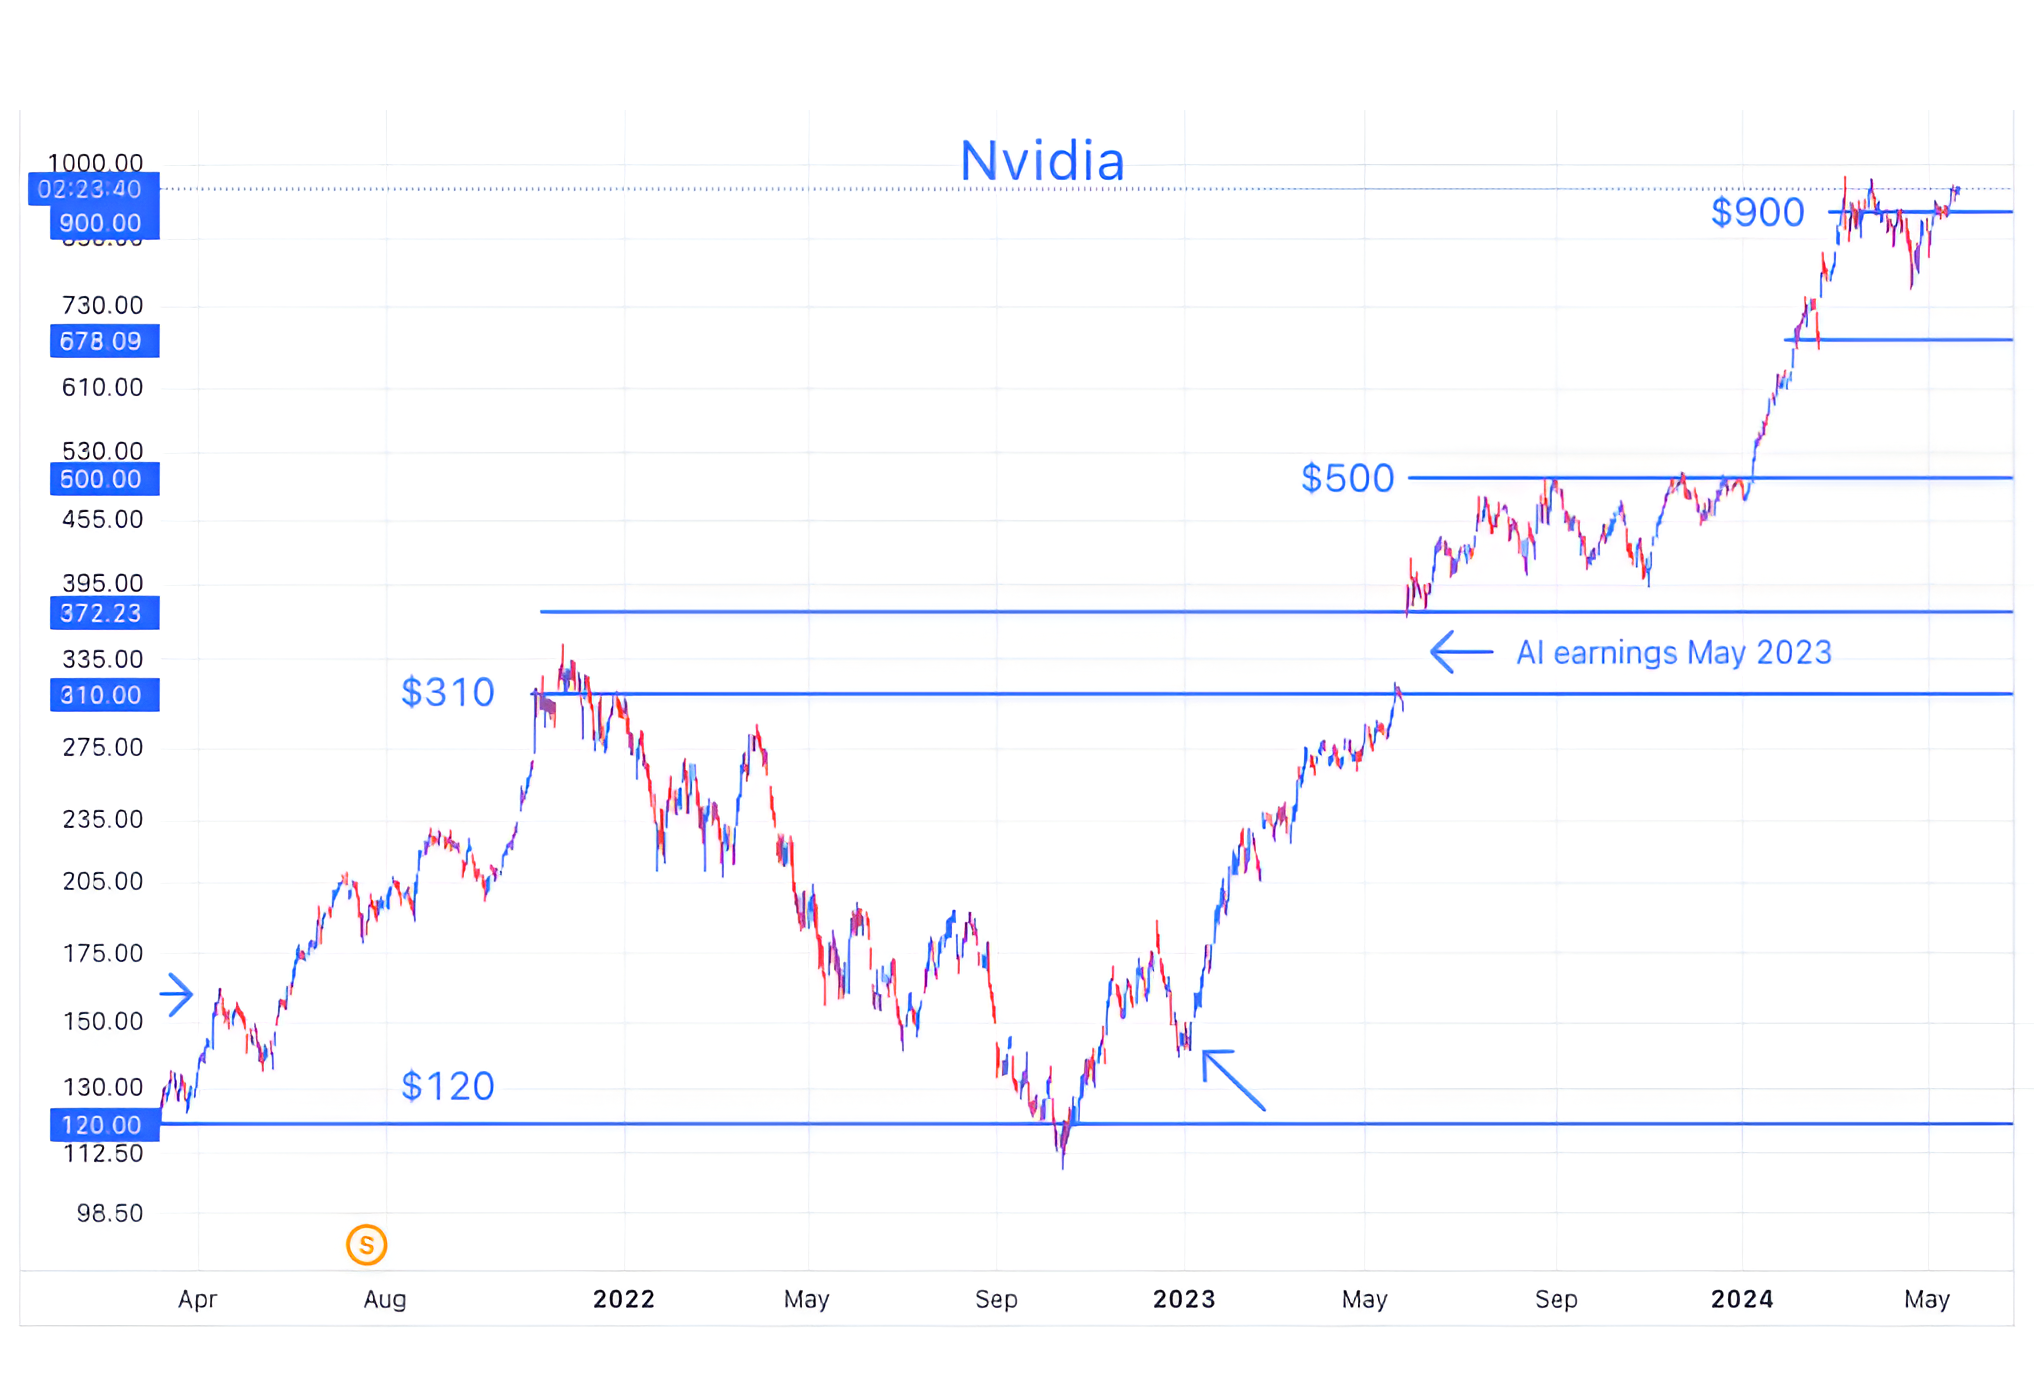
Source: TradingView. Through year-to-date 2024.
We discussed Nvidia’s results before (here) and after (here) the company’s last earnings release.
On February 23rd (after Nvidia’s last earnings release) we wrote:
“Nvidia’s earnings obviously showed incredible year-over-year growth, but from a quarter-over-quarter perspective, growth is slowing.
Most importantly, the report has allowed analysts to project at least $30 in earnings per share for fiscal year 2025 (calendar year 2024) and many can apply a 30x multiple to one of the fastest growing mega companies ever to come to a price target of $900.
With continued earnings growth in fiscal year 2026, higher price targets can be justified.
With Nvidia at $800 this morning up 70%+ year to date, even a move to $1000 per share (+25%) would suggest that the majority of the near-term gains may be in the past.”
After the recent earnings releases from Meta, Google, Amazon and Microsoft (the “hyperscalers”), we highlighted their CapEx estimates (chart 2 here) and acknowledged that those projections had been priced into Nvidia shares.
In other words, the demand story and backlog for Nvidia is understood.
The only worry is if there are enough chips that can be made on the supply side. Taiwan Semiconductor on its earning call announced that it had almost doubled capacity to facilitate the Grace Hopper rollout and prepare for Blackwell (the new Nvidia AI chips).
As we consider what could drive shares higher than the $900 price target that we established, it will require, in our view, either a multiple re-rating or visibility into 2026 (calendar year 2025) earnings or both.
Where could this come from?
In our opinion, it could come from Nvidia Enterprise.
Nvidia Enterprise will serve as a software layer for the DGX cloud.
The DGX Cloud is a cloud-based AI supercomputing service offered by NVIDIA that provides enterprises with instant access to powerful infrastructure and software for training and deploying advanced AI models, including large language models and generative AI.
Essentially the DGX cloud is the connective tissue for chips and platforms. The key from a valuation stand point is that unlike the chips that Nvidia provides, the DGX cloud is software.
Software warrants a higher multiple (due to higher recurring revenue, margins, etc.) than hardware.
If Nvidia provides specific guidance on the DGX cloud and detail around another software as a service that the company recently announced - Nvidia Inference Microservices - this allow analysts to start including these numbers into their 2026 estimates.
In my view, if this were to occur, it would justify 35x on our $30 2025 estimate or $1050.
(This is not a recommendation to buy or sell any security and is not investment advice. Please do your own research and due diligence).
2. US Mega-Caps Are Outperforming
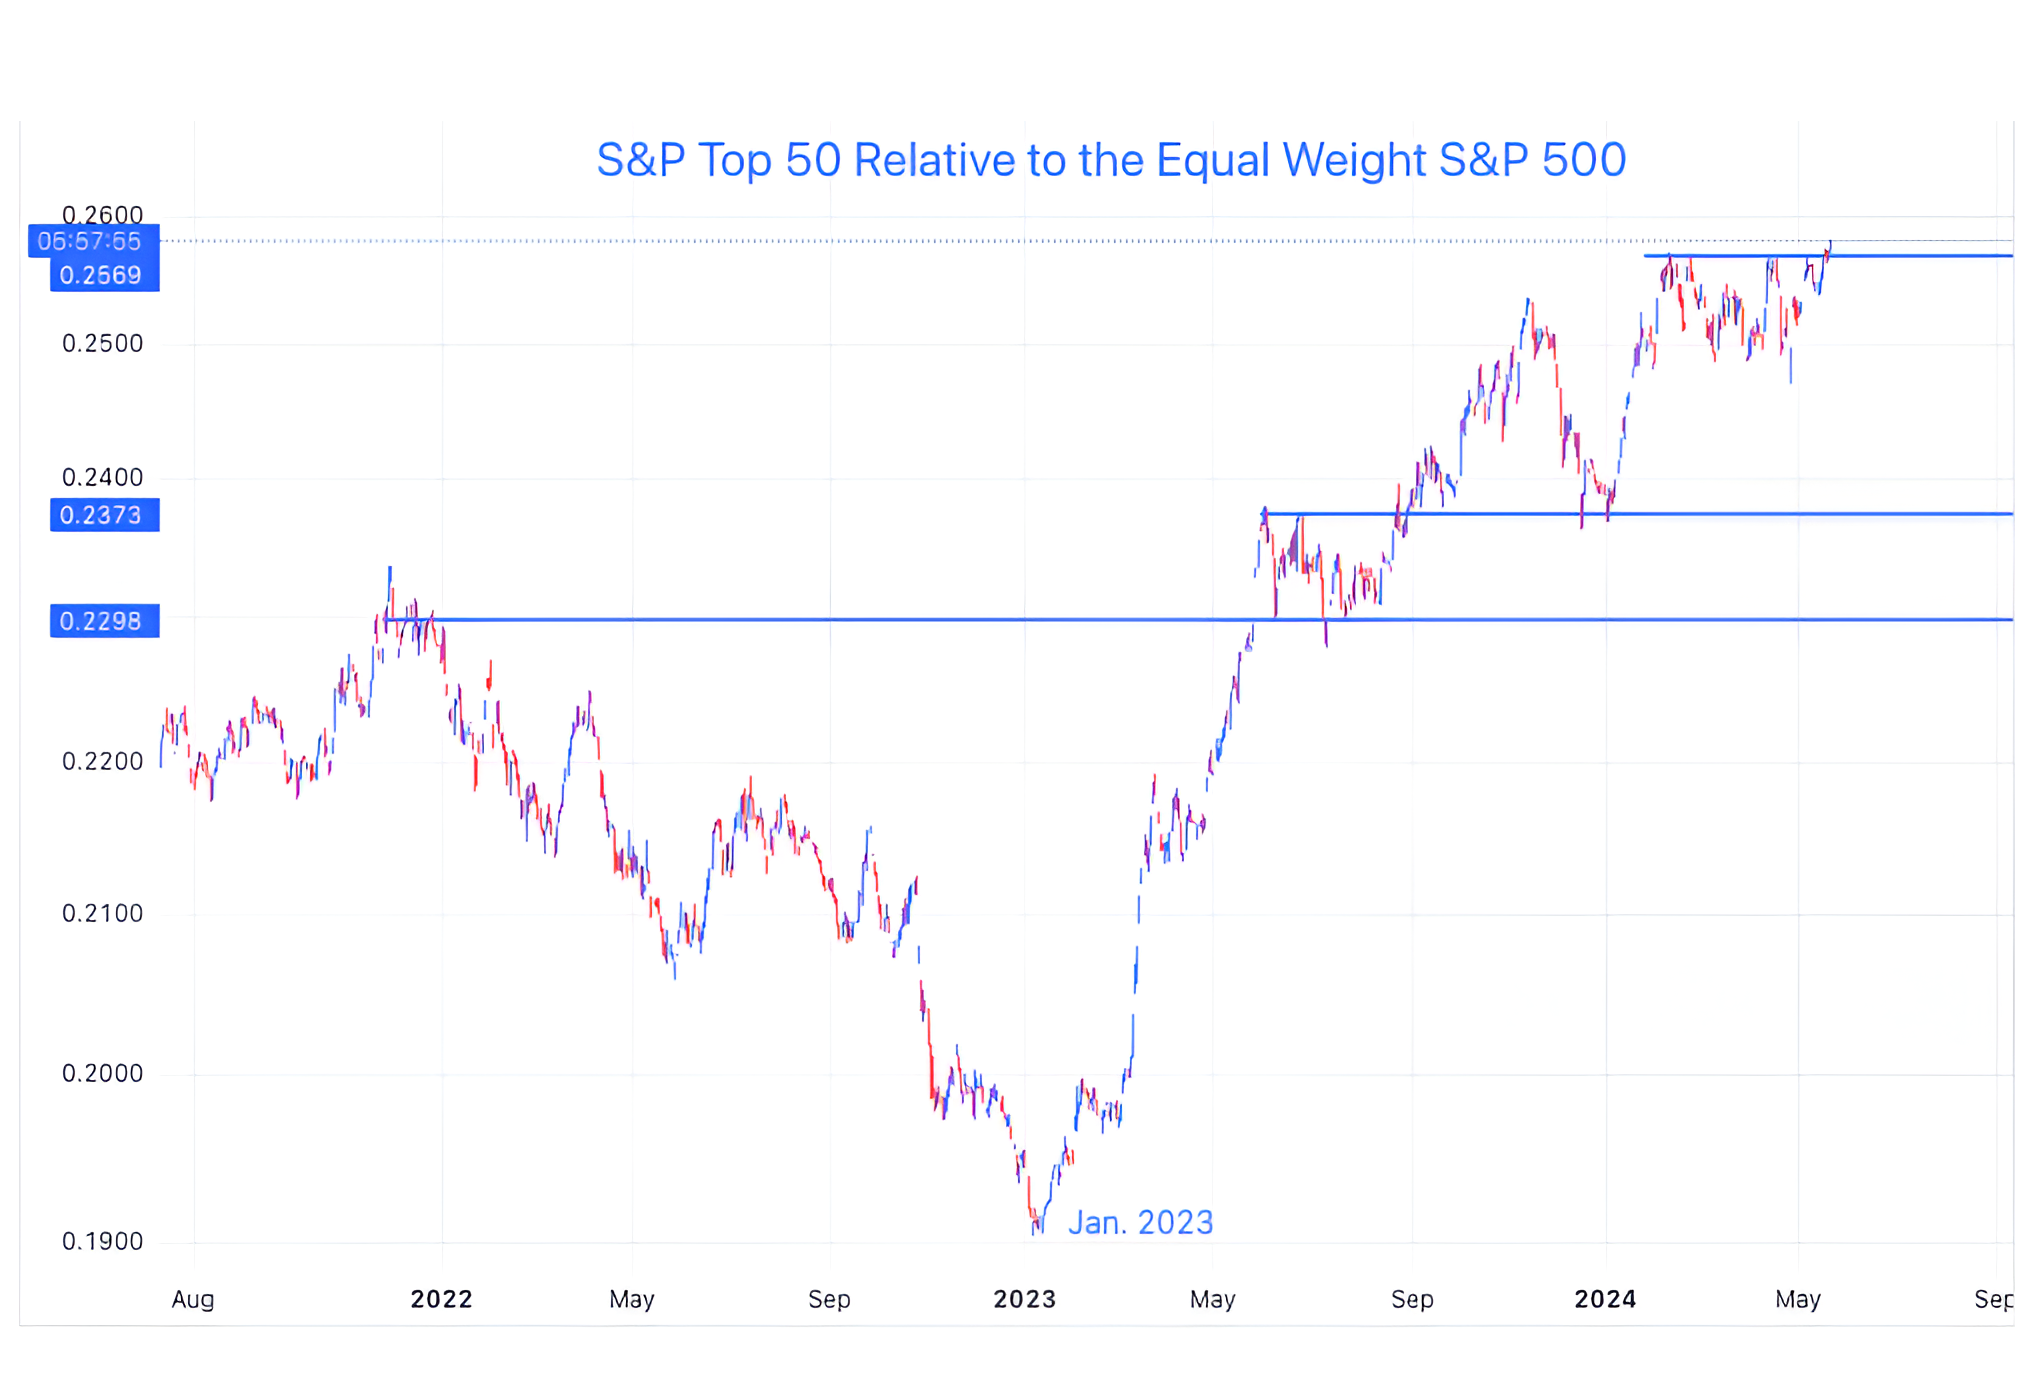
Source: TradingView. Through year-to-date 2024.
As we wrote yesterday, we are always trying to identify what is outperforming.
At the highest level that is cash vs. fixed income vs. equities; within equities it is region, size (large vs. small), sector and style (value vs. growth).
The chart above considers size as it compares the largest 50 companies (by market capitalization) in the S&P 500 to the Equal Weight S&P 500. The Equal Weight S&P 500 attributes 0.2% to each S&P 500 company. and, as a result, emphasizes the smaller S&P 500 companies at the expense the larger ones.
What the chart shows is that after underperforming during the Q4 2023 market rally, the largest 50 companies (think Microsoft, Apple, Nvidia, Google, Facebook, Berkshire Hathaway, Eli Lilly, Visa, Exxon etc.) outperformed early in 2024.
After a sideways movement (what we characterized as the “everything rally”), the largest 50 companies have taken the baton in leading the market to a new all-time high.
We often write that we want to see a meaningful move above or below a prior ceiling or floor (resistance or support) before officially acknowledging the significance of the move.
In the case of the top 50 vs. the Equal Weight S&P 500, it may be a little too early to declare the move meaningful, but the change in character from the Q4 2023 rally (led by the equal weight) and the 2024 rally (led by the Top 50) is notable.
(This is not a recommendation to buy or sell any security and is not investment advice. Please do your own due diligence).
3. Copper Miners…
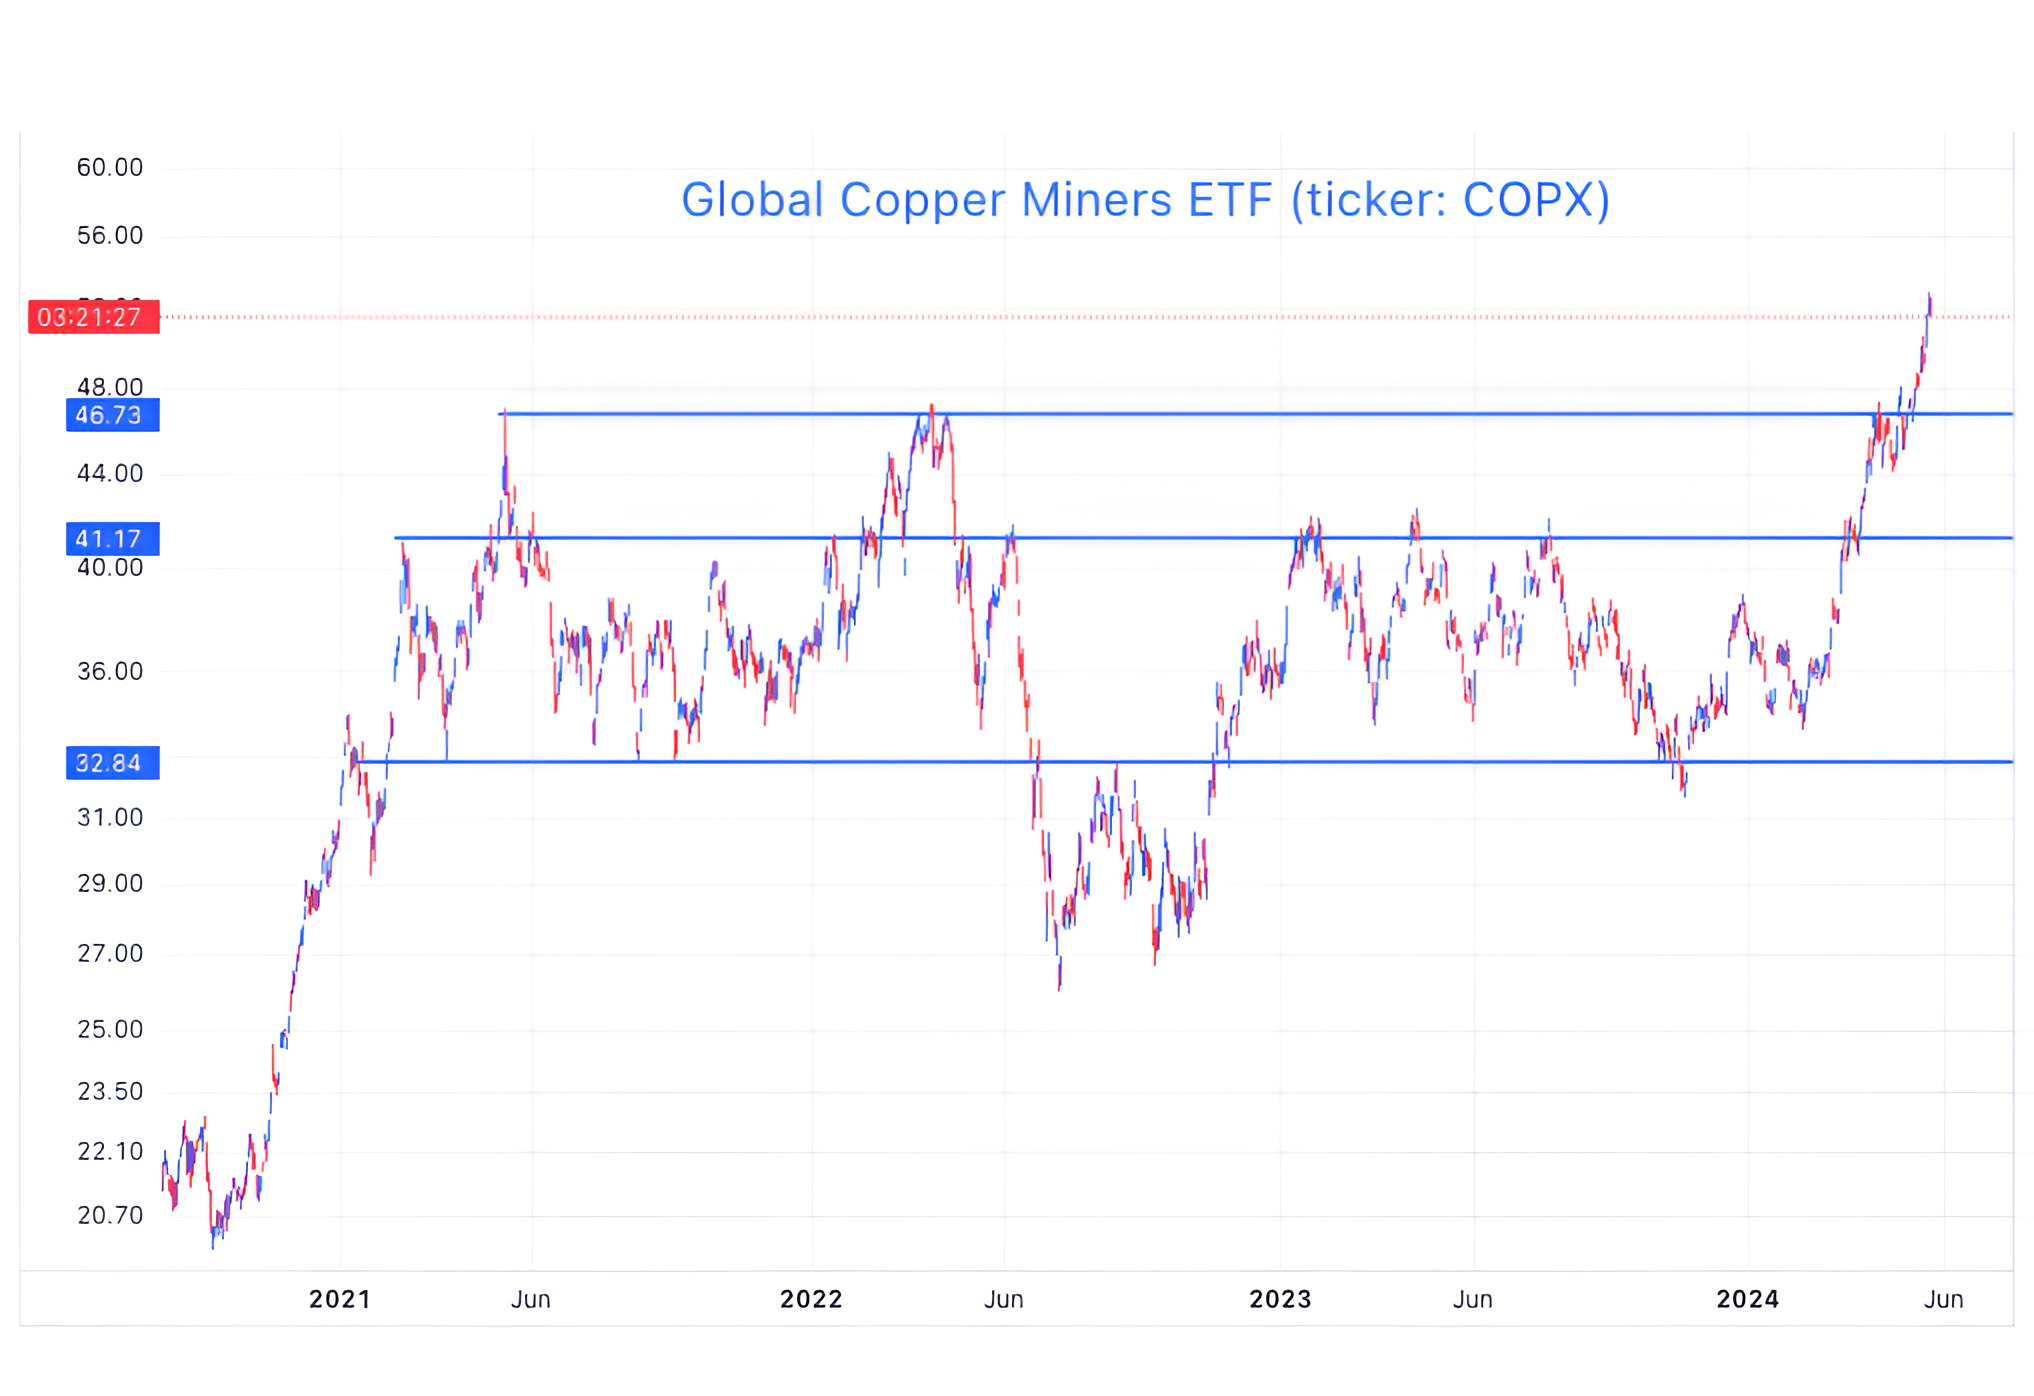
Source: TradingView. Through year-to-date 2024.
We looked at copper about a month ago (here).
At the time, we were trying to determine what had occurred in late January / early February that had changed the markets character.
The change in the price of copper helped us identify China as a catalyst for the change and focused us on Chinese stimulus as a market driver.
Above is a chart of the Global Copper Miners ETF (ticker: COPX).
In general, we like thematic ETFs that have non-US shares that are not easily purchased from the US.
The largest holding in the Global Copper Miners ETFs is KGHM Polska Miedz SA - a Polish copper miner. 50% of the ETF overall is allocated to non-US companies.
Combined with the infrastructure requirements for data centers and electric vehicles, Chinese stimulus could continue to push copper prices higher.
While it is stretched (too far, too fast) in our opinion, for those that want equity exposure to Copper, the ETF may be interesting.
(This is not a recommendation to buy or sell any security and is not investment advice. Please do your own due diligence).
4. One Market Blemish That Has Our Attention: the Transportation Index

Source: TradingView. Through year-to-date 2024.
The Transportation Index, like Small Caps, is seen as a barometer of the overall economy.
There is a school of market thought called Dow Theory that believes that any new high in the Dow Industrials Index (the commonly referred to Dow Index) needs to be confirmed by a new high in the Transport Index.
The basis of the theory is that while it might be great that Industrials are hitting new highs and that goods (theoretically) are being produced, if the production of those goods is not confirmed by the transportation of raw materials to factories or finished goods from factories, than the economy might not be as robust as the industrials (on their own) indicate.
The concept of Dow Theory may have been more applicable in the past when the US economy was more manufacturing based and less service-oriented, but we continue to see instances in the market when there is a divergence between the Transports and the Industrials or the Transports and the overall market, such as we are seeing today, that has foreshadowed overall volatility.
While we would not rely solely on this indicator or theory, it is, in our view, worth noting.
(This is not a recommendation to buy or sell any security, please do your own research).
5. Global Equities vs. US
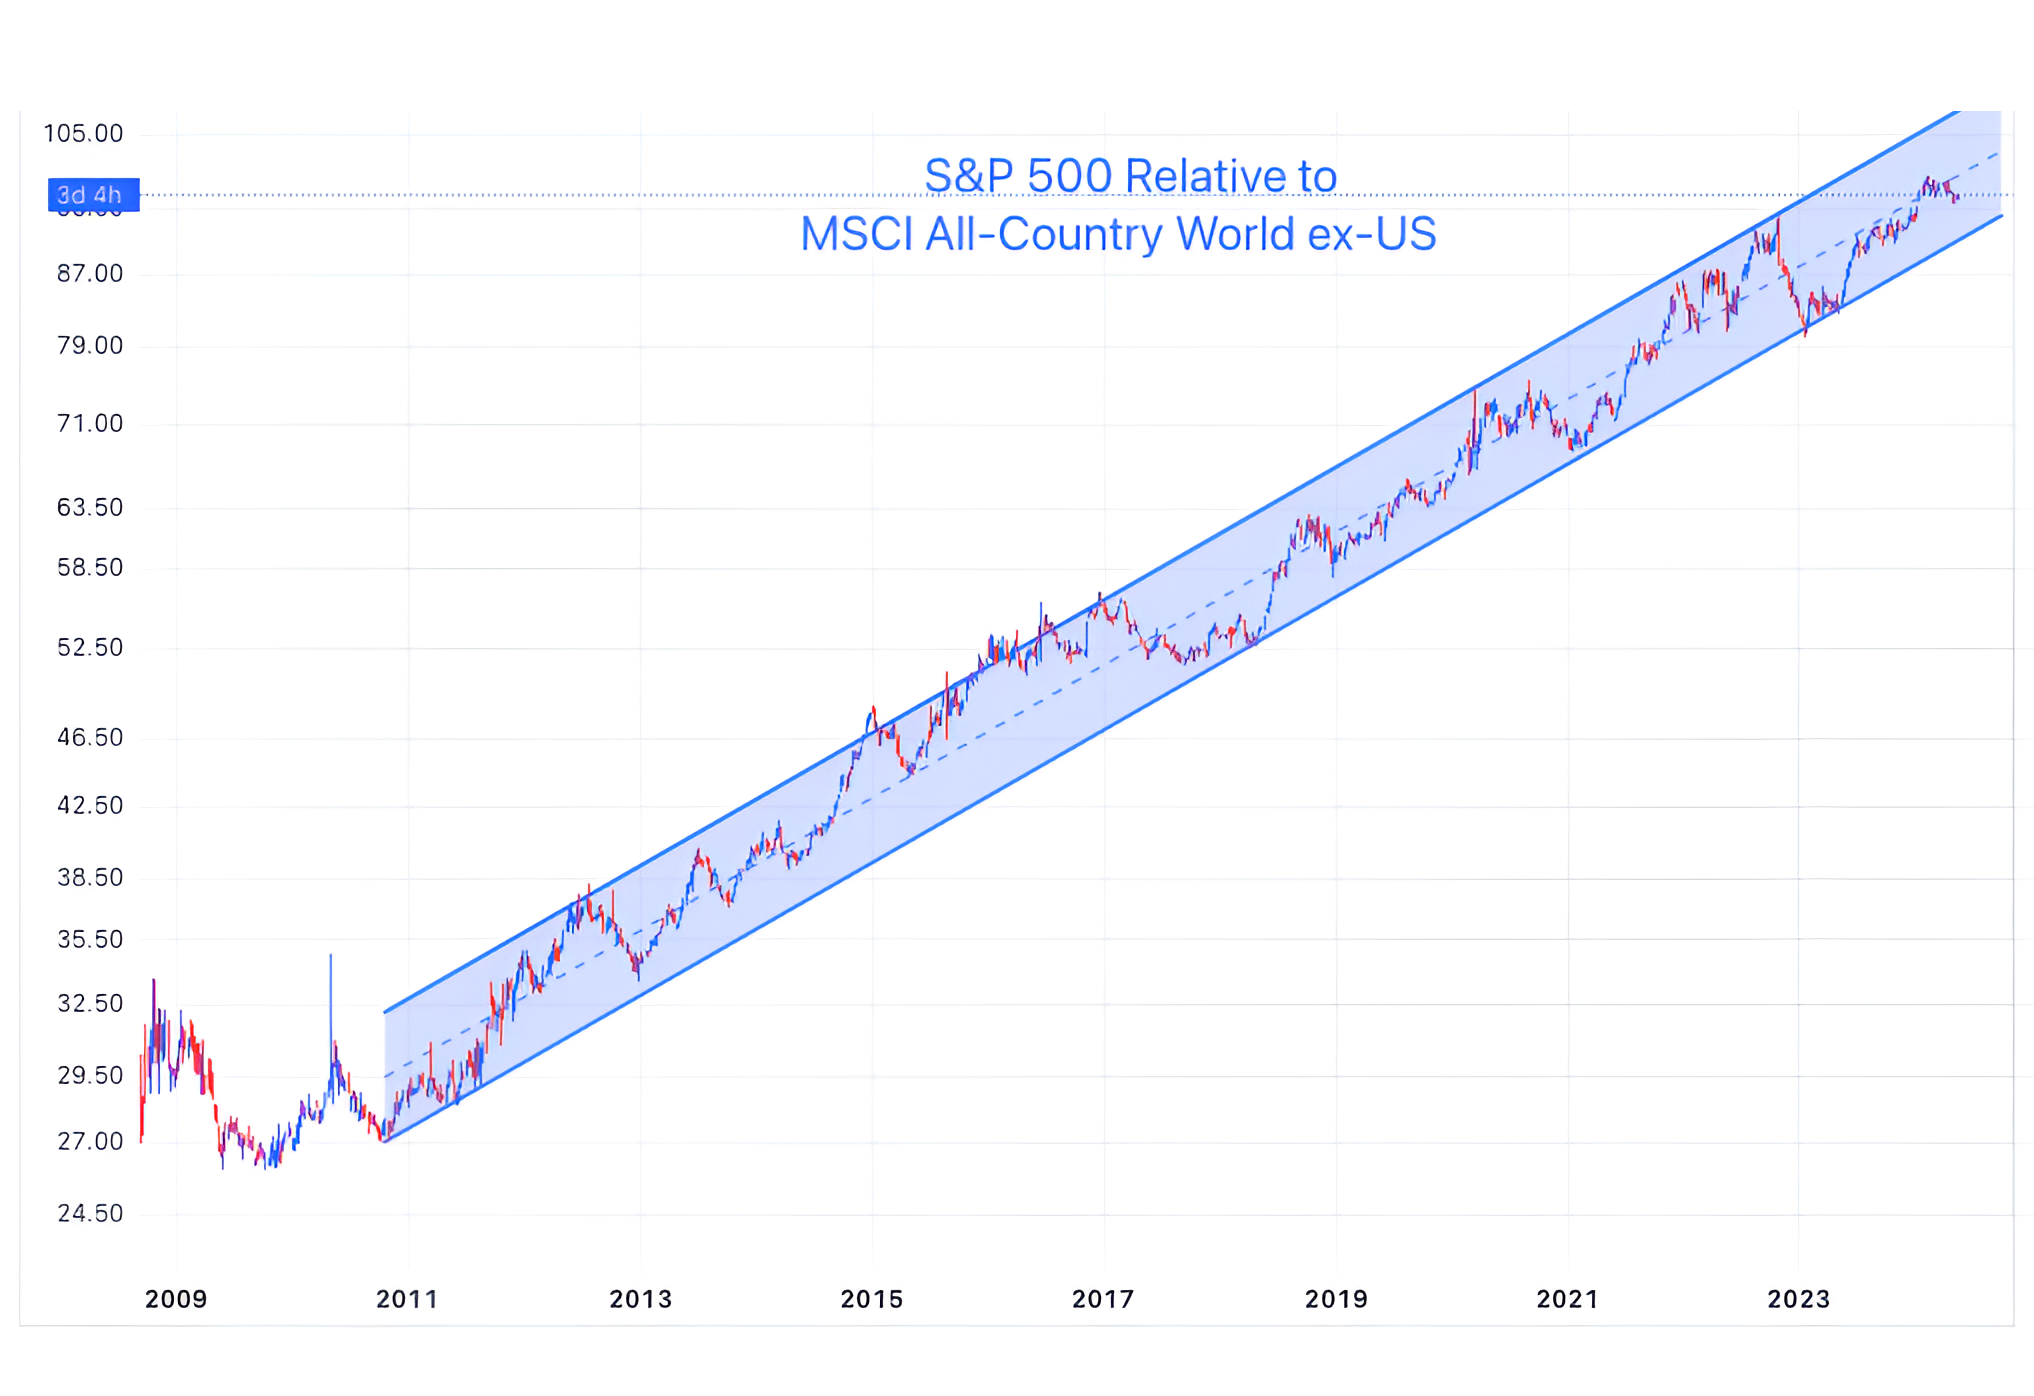
Source: TradingView. Through year-to-date 2024.
The chart above shows the S&P 500 relative to Global Equities ex-US.
Essentially, this chart answers the question, “Is there a benefit to allocating outside of the US?”
In the mid aughts, after the dot-com collapse, as the Euro was being adopted and China was welcomed into the World Trade Organization (WTO), investing in and having a large allocation to global equities provided a significant benefit (both risk and return) for US investors.
After the financial crisis, with the adoption fiscal stimulus measures (TARP) and unorthodox monetary policy (zero percent interest rate policy “ZIRP” and Quantitative Easing “QE”), US equities began to outperform.
With the help of persistent stimulus, technology and AI, US equities have continued to outperform (as reflected in the chart).
Despite the fact that in general non-US equities have not been additive to US dollar based portfolios, we have highlighted Chinese Internet shares (here, here and ), EM equities (here); Brazil equities (here); European equities; Japanese equities; German equities (here); and Argentine equities (here).
In other words, we continue to see pockets of opportunity outside of the US, but these are tactical in our view.
From a strategic (more long-term) perspective we remain very overweight US equities relative to non.
(This is not a investment advice and is not recommendation to buy or sell any security).