


I Walk the Line
Nvidia reports earnings on Wednesday. While we expect solid results, expectations are elevated and a lot is priced in. We would rather play AI and equities in other ways. Let's dig in...
1. US Equities, in General, Have Hit New All-Time Highs

Source: TradingView. Through year-to-date 2024.
While many have acknowledged the new all-time highs in the Nasdaq 100, S&P 500 or the fact that the Dow Industrials Index is above 40,000, we wanted to show a more broad measure of US equities, the Russell 3000 (the 3000 largest shares) as an indication of the overall stock market strength.
We have been calling the current period “the Everything Rally” since early March and this chart seem to be an indication that the Everything Rally is continuing.
When looking at this chart, in addition to the new all-time high, there are some characteristics that are worth considering:
The stair-stepping nature of the 2021 market.
From June 2020 (the low on the left of the chart) to January 2022, the Russell 3000 climbed 63%.
However, particularly in 2021 (above the lowest blue line), it is easy to see that the climb was not in a straight line higher. Each move up was met with a small move down. (I highlight this in contrast to the October 2023 - April 2024 ascent, described in point 3, below).
The vicious counter-trend rallies as the Russell 3000 was falling from January 2022 to October 2022.
As the Russell 3000 was dropping 28% over 8 months, there were a number of rallies along the way. The most significant rally was 19% from June to August 2022.
Shorting with conviction is difficult!
While the October 2022 low undercut the June 2022 low, the number of shares making 52-week lows peaked in June - this type of divergence is what we look for to at investible bottoms to determine the sell-off is over.
The relentless ascent from October 2023 to April 2024.
Over this 5-month period, the Russell 3000 climbed 29% in nearly a straight line (unlike the stair-step higher in 2021).
Does this mean that more of a pause than the 2-week first half of April drop is warranted? While that was our working thesis, the bazooka of stealth liquidity from the Fed and Treasury (see here) negated that view.
It is critical (not just important) to remember, that the January 2022 market peak (and really the November 2021 high which was just a hair below that of the January 2022 high) coincided with the Fed’s decision to bring forward the end of quantitative easing and the beginning of the rate hike cycle.
On the other hand the October 2023 to April 2024 advance was on the back of the Feds conclusion of the rate hike cycle, what we have referred to as “stealth liquidity” and Powell’s admission in December that cuts would be coming.
As we often write (and attribute to Stan Druckenmiller) liquidity moves markets.
We believe that the new all-time highs have been supported, if not driven, by recent further “stealth liquidity” measures from the Fed (tapering quantitative tightening) and the Treasury (using its reverse repo facility and offering bills rather than notes). (See here).
Last week’s CPI report was hardly a speed bump in the equity market’s ascent.
As we have continued to state the Fed wants to ease and the market is looking for any reading or perspective of the inflation data that could give the Fed a window to provide more accommodation.
In our view, liquidity supports the elevated valuation multiple of the market (21x next 12 months earnings) while the solid Q1 earnings and affirmation of Q2 and full-year 2024 expectations have provided fundamental support. (See chart 3 here, chart 3 here and here).
Our view continues to be that based on a combination of liquidity and earnings growth, the S&P 500 can continue to climb towards 5500 by year-end.
(This is not a recommendation to buy or sell any security and is not investment advice).
2. A Below Average Recovery
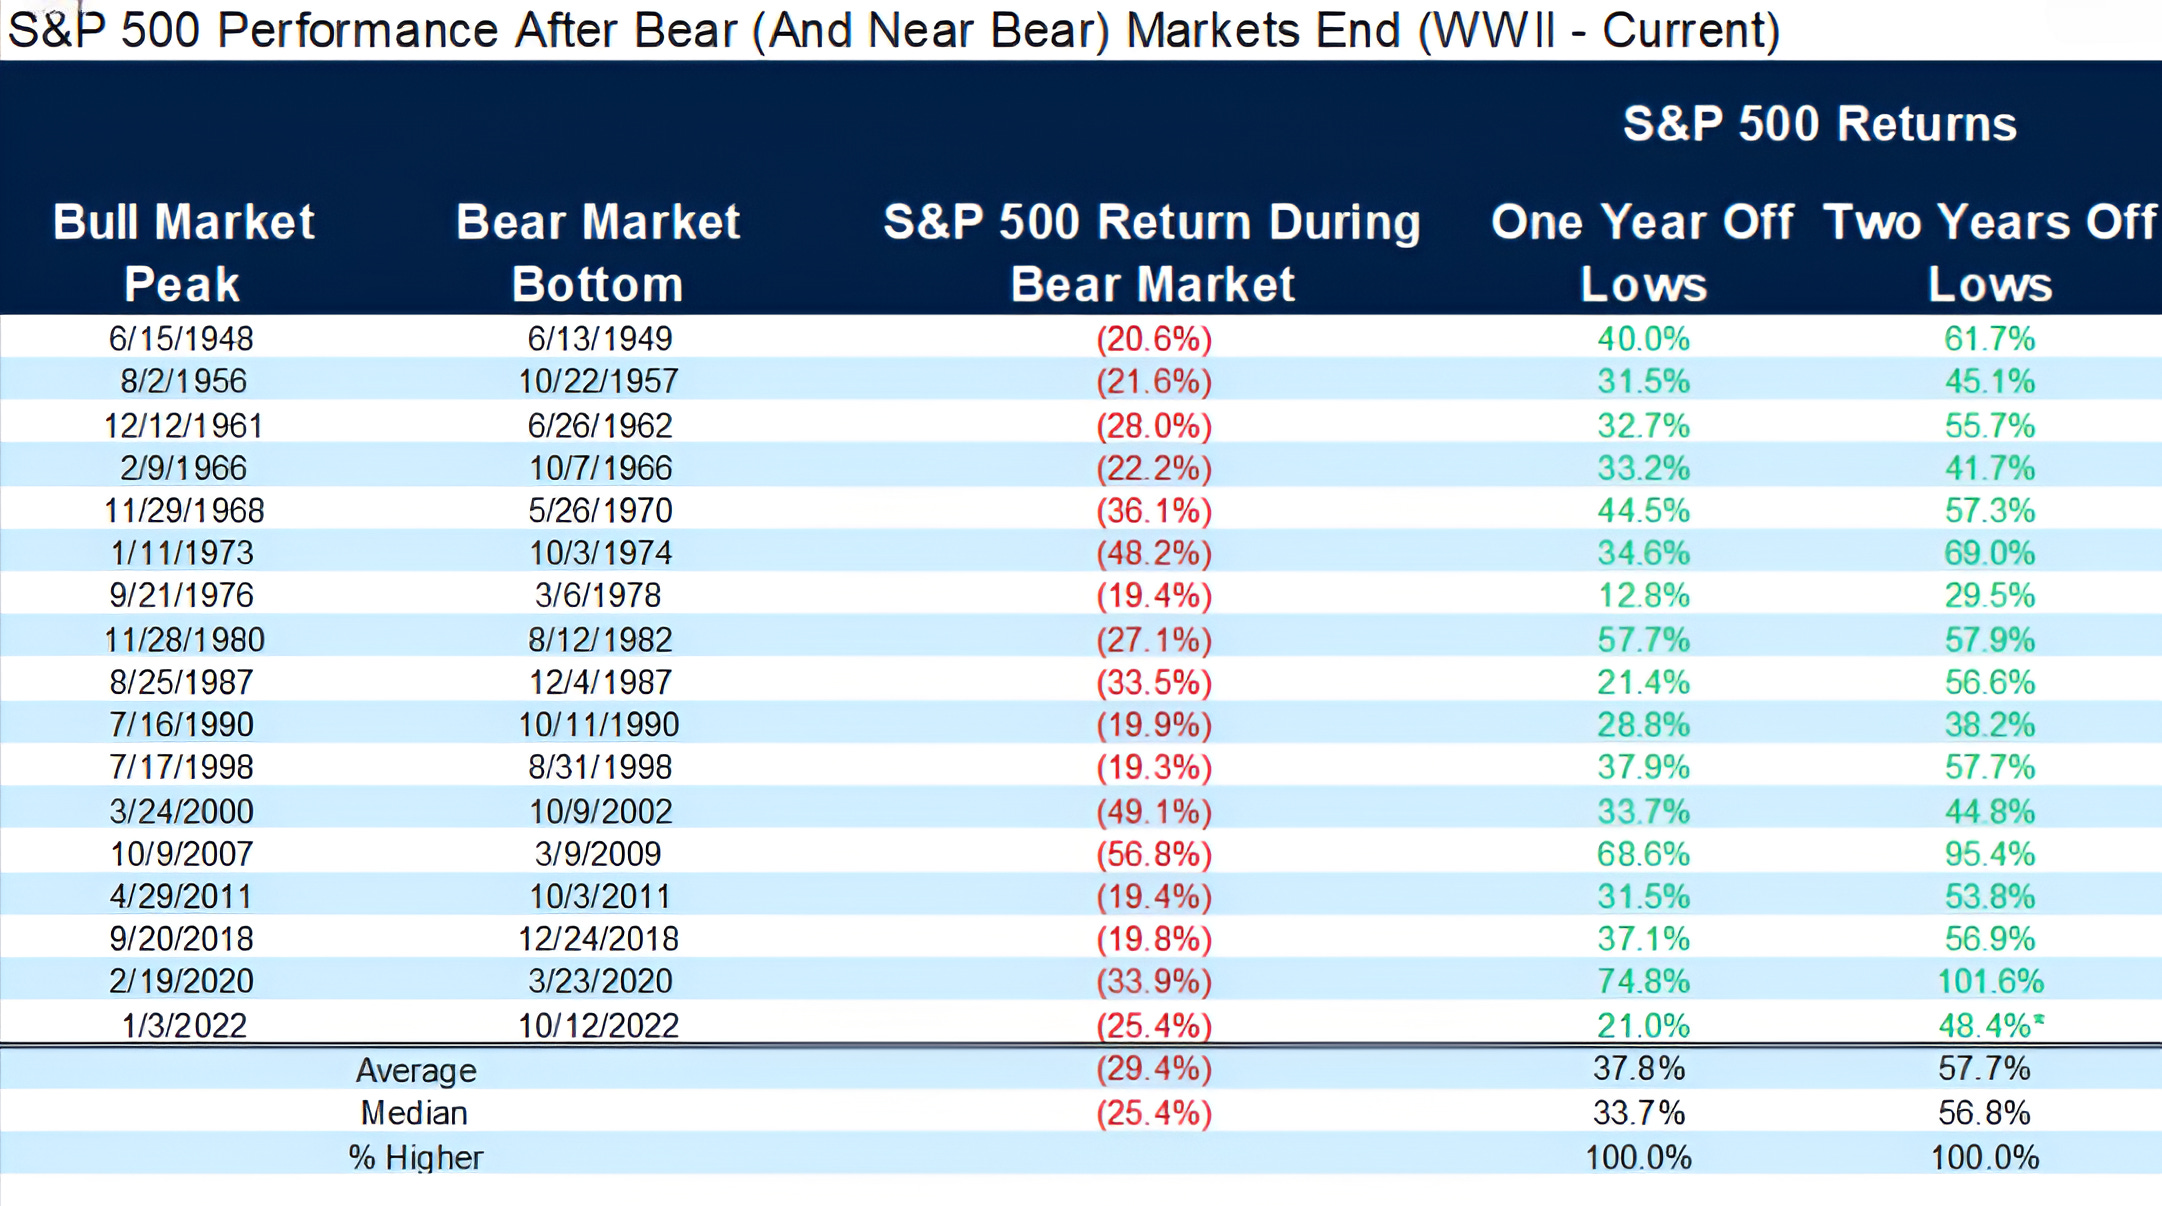
Source: Carson Investment Research; FactSet. Through year-to-date 2024.
As can be seen from Chart 1, the current bull market began / the 2022 bear market ended in mid-October.
One year after hitting its low (October 2023), the S&P 500 was up 21% and two years later it was up 48%.
Looking back at the recoveries after 20%+ S&P 500 drawdowns since 1945, the average 1-year return was 38% while the 2-year return was 58%.
Despite the fact that the recent ascent in equities has at times seemed steep and aggressive, it has been a below average recovery.
While this data doesn’t speak to future returns, one could make the argument that not all of the juice has been squeezed from the orange.
(This is not a recommendation to buy or sell any security. Please do your own research and due diligence. Past performance is not indicative of future results).
3. Can Growth Make a Relative New High?

Source: TradingView. Through year-to-date 2024.
We are always trying to identify what is outperforming.
While it’s nice to make 10%, it’s not fun to make 10% when everything else is making 20%.
This is why we look at “relative” charts.
When the chart above is moving higher, the Russell 1000 Growth Index is outperforming the S&P 500 and when it’s moving lower, it’s underperforming.
The behavior of relative charts is similar to that of charts of individuals assets and indexes.
The Russell 1000 Growth first hit its peak level relative to the S&P 500 in September 2020. It then revisited the level in November 2021.
Growth underperformed from November 2021 to January 2023.
For the next 13 months, the Russell 1000 Growth Index climbed relative to the S&P 500, until, once again, it hit its September 2020 peak.
If the Russell 1000 Growth Index were to convincingly move towards and above the September 2020 high, it could usher in another period of significant Growth outperformance.
Although we have highlighted cyclical value sectors (Energy, Financials, Materials and Industrials) as well as defensive value sectors (Staples and Utilities), we are open to the idea that Growth (Technology, Communications, Consumer Discretionary) could re-take the leadership baton to move equity markets higher.
(This is not a recommendation to buy or sell any security and is not investment advice. Please do your own due diligence).
4. Watching High Yield Fixed Income for Clues

Source: TradingView. Through year-to-date 2024.
We are watching High Yield fixed income closely for equity market clues.
As can be seen on the chart above, the High Yield Fixed Income ETF is back at its recent ceiling level.
The ETF spent the first three months of 2024 fighting with the ceiling and when equities corrected during the first half of April, the High Yield ETF fell along with them.
If High Yield Fixed Income is once again rejected from this area, we believe it is likely that there will be accompanying equity market volatility.
If, on the other hand, the High Yield ETF can move sustainably above its ceiling, we would potentially view this as an indication of further equity market upside.
(This is not a recommendation to buy or sell any security, please do your own research).
5. Argentina
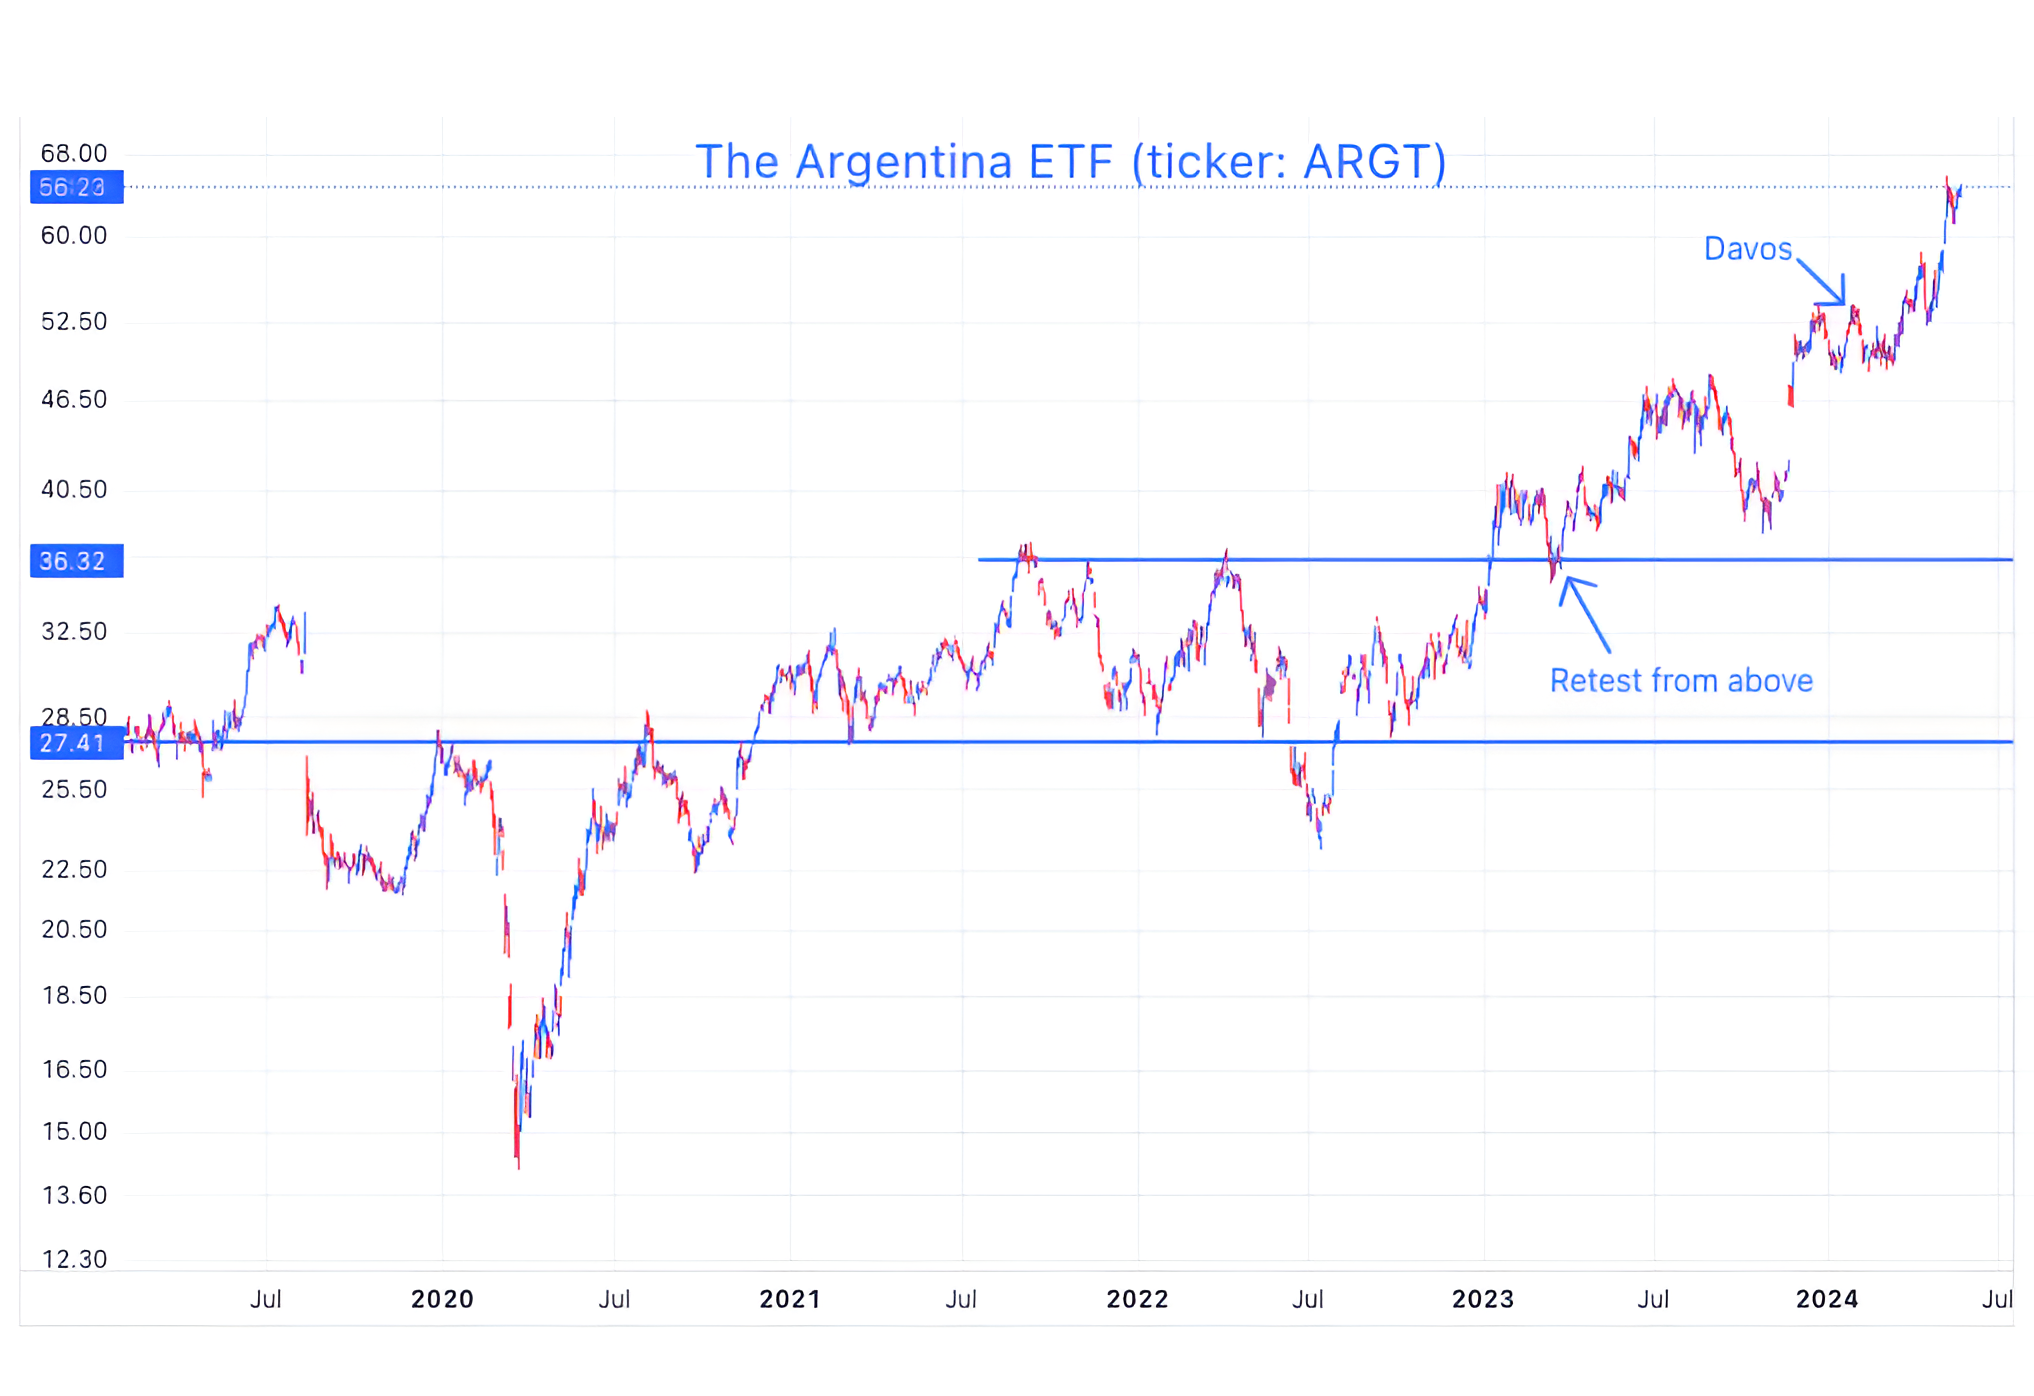
Source: TradingView. Through year-to-date 2024.
Frequent readers know that I am a fan of Stan Druckenmiller.
For those that aren’t familiar with his investment track record, Druckenmiller has averaged 30% annual returns over the past 30 years and has not experienced a down year over that period.
In a recent interview, Druckenmiller spoke about Argentina. This provided insight into both his views on the country and his investment style.
Druckenmiller is a macro (big idea / economics) investor at heart and he commented on Argentina’s new president:
“The only free market leader in the world right now bizarrely is in Argentina of all places - Javier Milei.
He cut Social Security 35% after he came to office.
They’ve gone from a primary deficit [tax revenues - spending, not including interest payments] of like 4% or 5% to a 3% surplus.
What I find interesting about this is that Druckenmiller is focused on direction not details.
He went on to say:
“I wasn’t at Davos, but I saw the speech in Davos and it was about 1:00 in the afternoon in my office.
I dialed up Perplexity [Druckenmiller’s favored AI engine in which he has invested] and I said, give me the five most liquid ADRs in Argentina.
It gave me enough of a description that I follow the old Soros rule, invest and then investigate.
I bought all of them.
We did some work on them. I increased my positions and so far, it’s been great.”
While not everyone can do this effectively, this is an amazing approach.
(This is not a investment advice and is not recommendation to buy or sell any security).