


Into the Great Wide Open
Although there is inflation data this week, in our view, the major trends have been established. Earnings and liquidity continue to lead to upside. Let's dig in...
While many are focused on the inflation reports this week (Producer Price Index (PPI) tomorrow, Consumer Price Index (CPI) on Wednesday), good news has been priced into equity markets since the last Fed meeting (10 days ago) as it became clear the Feds bias is to ease.
This could set the market up for a “buy the rumor, sell the news” scenario.
That said, “under the surface” there have been significant sector rotations (chart 1) and money flows (chart 2) that we believe have helped us calibrate both our market outlook and investment strategy.
Combined with the earnings (chart 3) and liquidity (stealth in the US and becoming overt in China), we maintain our bullish stance in US equities in the near-term.
We acknowledge the velocity of the move higher since the last Fed meeting and recognize that equities may pause. If that is the case, we would use the pause to realign portfolios with the 2024 market realities (chart 1).
Over the longer-term, we don’t want to ignore the possibility of a recession. Although this is not a base case, we recognize that this is the biggest risk for equity investors and we want to remain vigilant.
1. 2024 Equities are Not Like 2023 Equities

Source: TradingView. Through year-to-date 2024.
The chart above shows the Nasdaq 100 relative to the S&P 500.
When it’s moving higher, the technology oriented / growth heavy Nasdaq 100 is outperforming the more broadly diversified S&P 500. When it’s moving lower, the opposite is true.
We last showed this chart about a month ago here.
At the time, we highlighted a trend change that we had seen across markets that began to occur in late January / early February.
This was one of the 3 themes that we highlighted here. We followed this up on chart 5 here.
We concluded that the most significant contributor to the change across markets that has led to the shift from cyclical growth (technology, AI) to cyclical value shares (financials, energy, materials and industrials) was likely Chinese stimulus.
We identified that in late January, China began providing stimulus to its economy. We cited bank reserve requirements ratios (RRR) as well as other measures.
Over the past few days, China announced an offering of $138 billion of 30-year bonds which, according to Bloomberg, are a part of the stimulus efforts. (Along with lower interest rates - monetary stimulus, this is a large fiscal stimulus measure).
In our view, 2024 has and will continue to be a different market environment than that of 2023 and will continue to require a different equity investment strategy. (We also wrote about this here).
In general, we have broadened our sector allocation by increasing exposure to cyclical value sectors such as financials, energy, materials (including gold) and industrials to complement our technology / AI exposure.
Our technology and AI exposure has been “down the stack.”
In other words, we have tried to find the next wave of AI beneficiaries - we have called this “skating to where the puck is going,” rather than where it is (full report here and follow-up here).
We have also included non-US companies and ETFs in our portfolios including European companies (here), some LatAm and Chinese (see here and here).
Last Friday (here), we highlighted the performance of the Consumer Staples and Utilities sectors. These defensive sectors were the only two US sectors making 52-week highs last week.
Although these are often sectors that portfolio managers emphasize when they see a slowdown in the economy, for the time being, we have added the performance of the defensives to our “things to be aware of” list rather than our “things to react to” list.
While we do have some exposure to utilities, it is due to cyclical reasons (rather than defensive): a) we recognize the power requirements of AI and b) because we believe nuclear may be a green solution transition energy source. (chart 3 here).
(This is not a recommendation to buy or sell any security and is not investment advice).
2. A “Buying Thrust”
Source: Carson Research. Through year-to-date 2024.
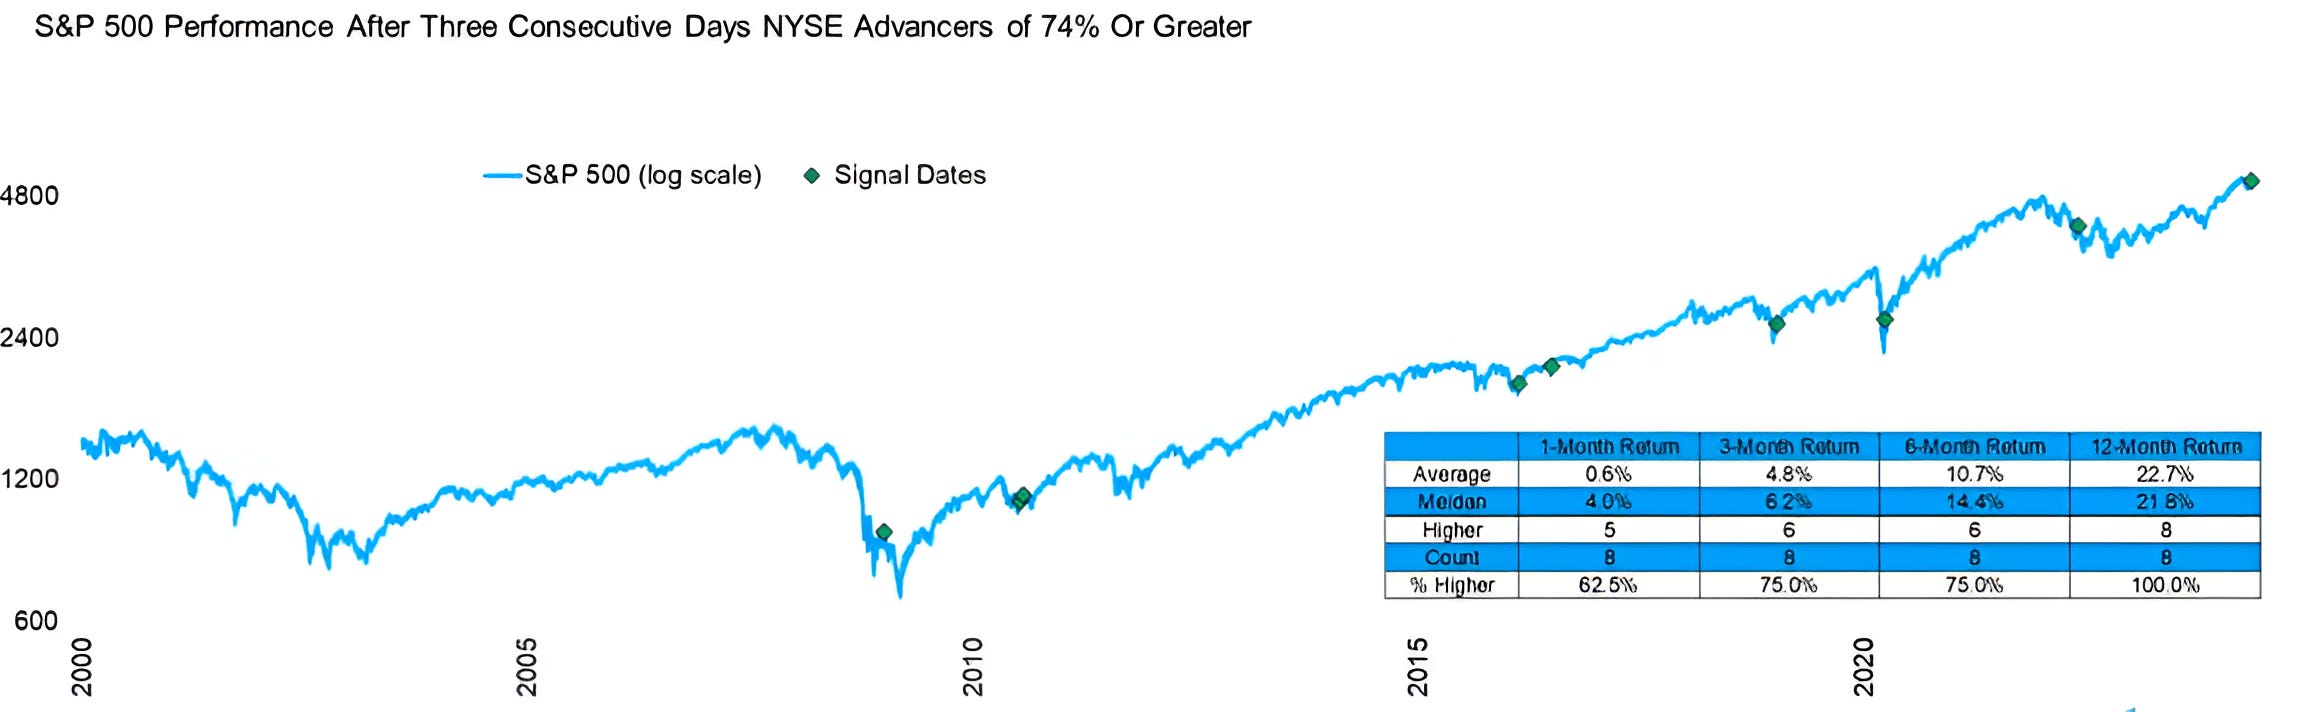
Last week - “underneath the surface” - there were three consecutive days (Wednesday, Thursday and Friday) when the percentage of advancing shares on the New York Stock Exchange (different than the S&P 500) was greater than 74%.
This is a relatively rare market characteristic which has occurred only 8 times in the past 25 years.
In most cases, these “buying thrusts” have taken place in the middle of or just after sell-offs.
In other words, it hasn’t been typical to see a “buying thrust” after a 46% rally.
We wrote about some other technical (chart pattern) indicators that we have been watching that were atypical at this point in the cycle in a piece in late January titled “Equities are Exhibiting Characteristics We Normally See at Lows” here).
This may have something to do with the combination of fiscal and monetary stimulus in the US and, now, the increasing fiscal and monetary stimulus in China.
Of the 8 past “buying thrusts” over the last 25 years, 1 year later, the S&P 500 has been up every time with an average return of 22.7%. (Past performance is not indicative of future results).
While we would not take an indicator like this in isolation nor would we base our view on it, the buying pressure, in our view, may provide support to the combination of earnings (better than we and the market expected) and liquidity (US and Chinese) that in our view are the underlying market drivers.
(This is not a recommendation to buy or sell any security and is not investment advice. Please do your own due diligence).
3. Another Look at Earnings Season…
Source: FactSet. Through year-to-date 2024.
Q1 earnings have been solid.
While I have questioned earnings, my most significant questions have been focused on the 17% growth expected in Q4 and the 14% growth projected in 2025 after the 10% expected full-year earnings growth in 2024. (We showed this here).
But I digress.
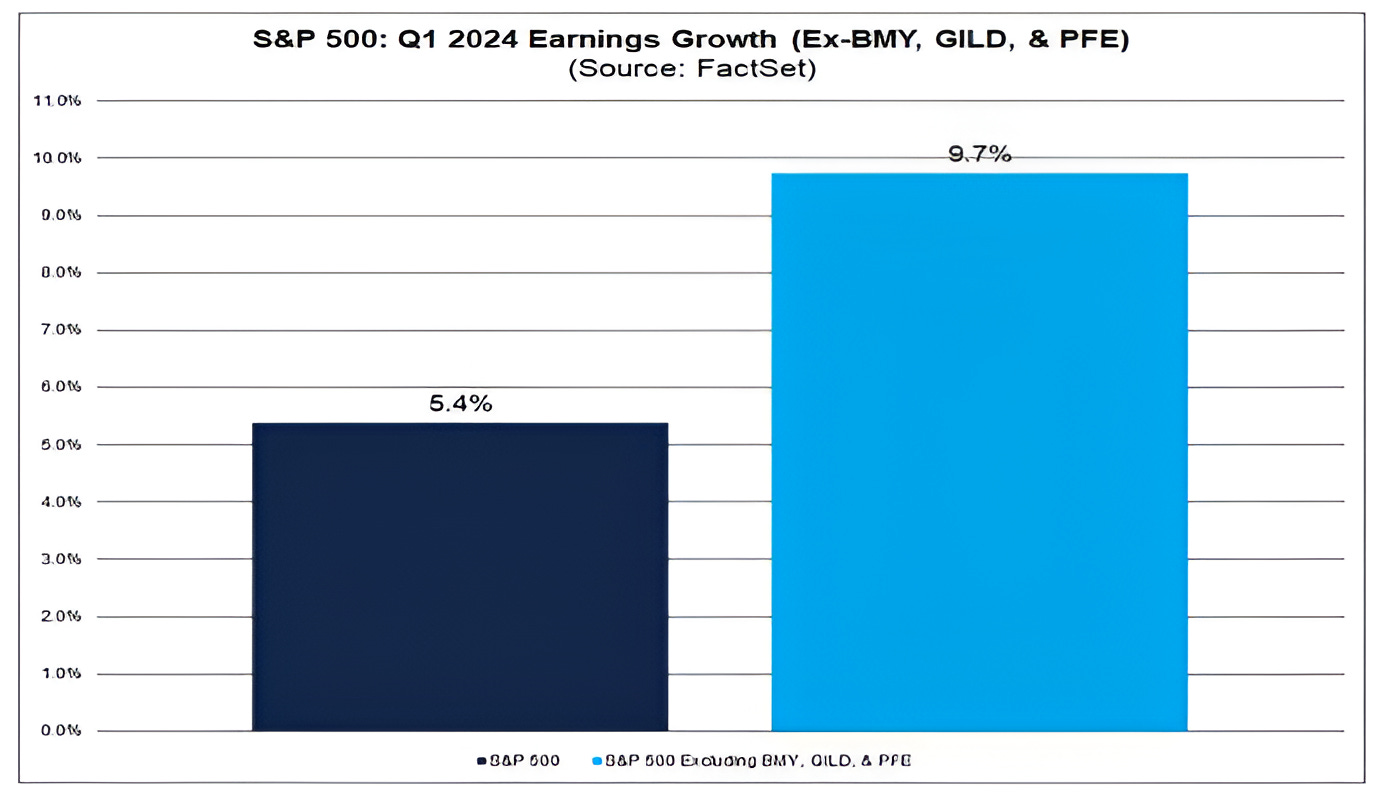
92% of the companies in the S&P 500 have reported actual results for Q1 2024 to date.
Year-over-year earnings growth, including projections for those companies that have not yet reported, looks to be coming in at a respectable 5.4%.
However, if we were to exclude the earnings of the three health care companies - Gilead Scientific (ticker: GILD); Pfizer (ticker: PFE); and Bristol Meyers (ticker: BMY) - that have been the largest detractors of earnings in Q1, overall index earnings growth would be 9.7% (somewhat in-line with full year expectations). (Chart above).
On the other hand, if we were to exclude the top five contributors to Q1 S&P 500 earnings growth - NVIDIA; Alphabet (Google); Amazon; Meta (Facebook); and Microsoft - the S&P 500 would be reporting a year-over-year earnings decline of -2.4%.
What this says to me is that the overall S&P 500 earnings outlook may still be overly reliant on a few shares (in both directions).
While Q1 earnings have been solid (we typically don’t like excluding anything to rationalize data), with much more demanding expectations going forward and limited scope for multiple expansion to drive the market higher, we continue to view the market as fragile.
Frequent readers know that the way we have responded to what we have characterized as a “fragile” environment has been to a) stay invested; b) focus on sector and stock selection (see section 1); and c) include puts and put spreads in our portfolios.
We often say that valuation is not a catalyst.
What is a catalyst is surprisingly negative earnings growth. We will watch for this later in the year, but it is not a current condition of the market environment.
(This is not a recommendation to buy or sell any security and is not investment advice. Please do your own due diligence).
4. Recession Watch
Source: Bespoke Investment Group. Through year-to-date 2024.
A week and a half ago (here), we wrote that a conversation with a Small Cap portfolio manager had put the possibility of a recession back on our radar.
Over the weekend, we began to see a number of indicators consistent with what we have called storm clouds on the horizon.
There does not seem to be an immediate issue, but with last weeks higher jobless claims and recent JOLTS data reflecting fewer jobs available, concerns of a slowdown are increasing.
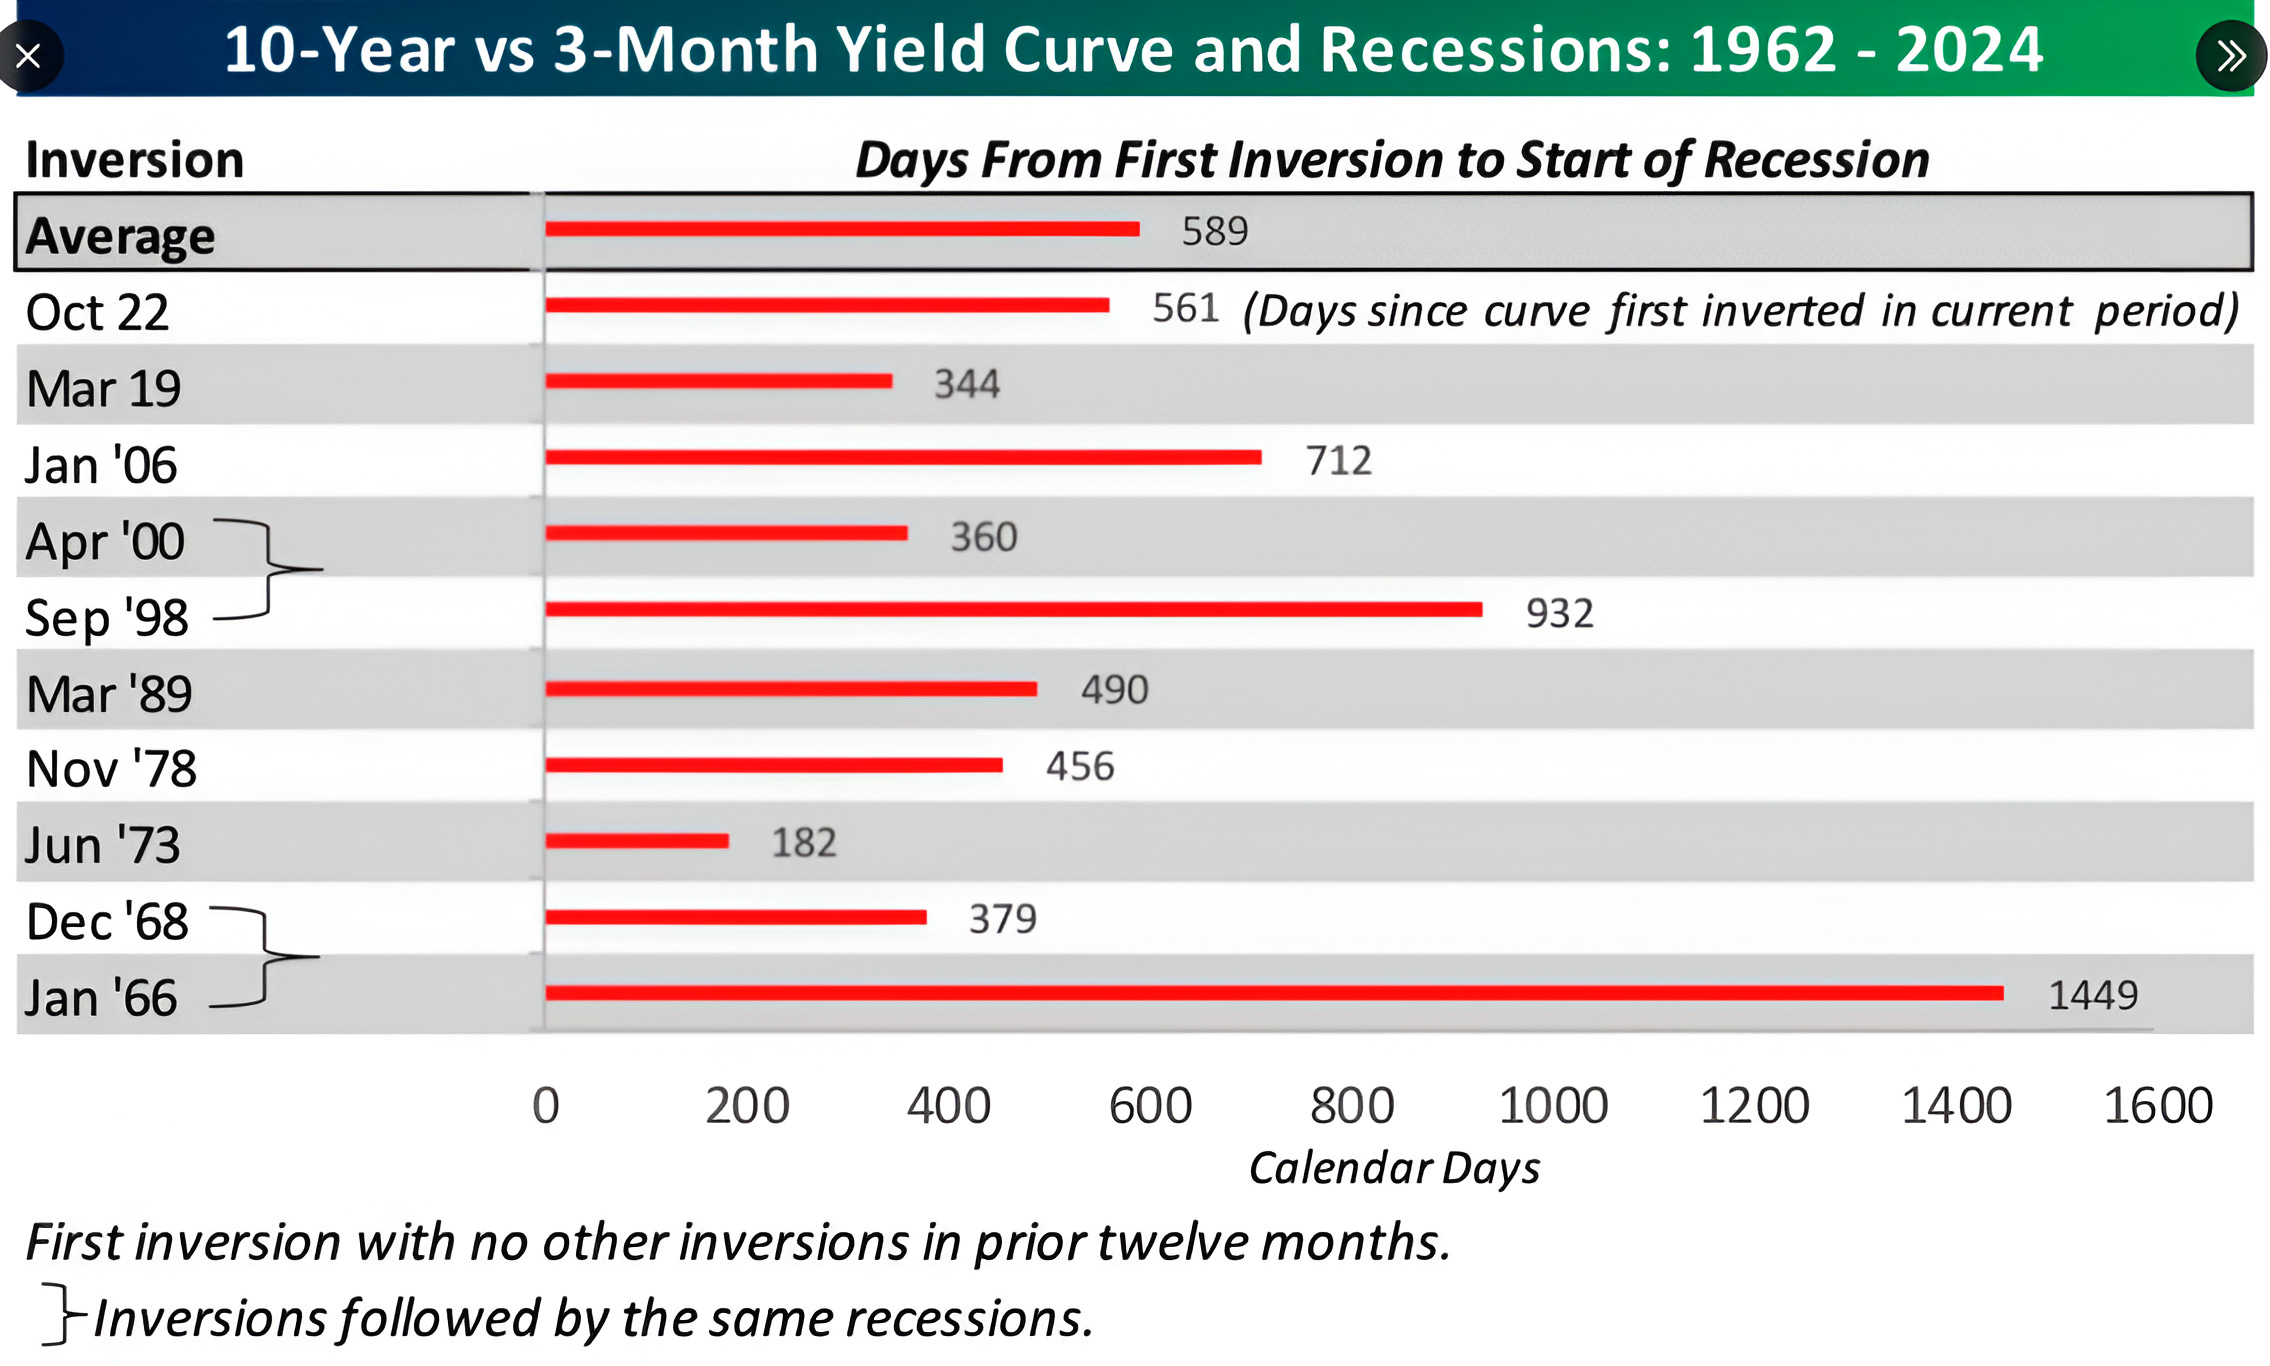
In addition to employment, a market signal that many use to project a recession is an inverted yield curve.
In the chart above, Bespoke Investment Group considers the 10-year / 3-month inversion to determine the possible timing of a recession. Bespoke concludes that from the time of initial inversion to the onset of a recession, the current cycle is slightly short of the average.
In line with Dan Clifton from Strategas (here), we believe that “policymakers [have likely] laid down a security blanket of liquidity into the 2024 election.”
As we wrote last week, investors need to “fear the cut” and as we wrote earlier in the year, markets typically do not bottom until after the un-inversion (also known as a steepening) of the curve takes place.
While none of this indicates that a recession will come and we do not see a near-term recession, the largest drawdowns in equity markets have occurred around recessions. As a result, we remain vigilant.
(This is not a recommendation to buy or sell any security, please do your own research).
5. European Financials…

Source: TradingView. Through year-to-date 2024.
We have been skeptical of the European Financials since the Financial Crisis.
Why?
Unlike the US banks which had a forced recapitalization (TARP) that cleaned the balance sheets and allowed US banks to start lending again, the European banks were forced to organically wait out their bad debt.
To make matters worse, the period of negative interest rates in Europe meant that the banks would not earn anything (in fact had to pay) on deposits.
15 years after the crisis and there may be a fundamental recovery occurring in European financials. Balance sheets have been repaired and interest rates are normalized.
In general European banks are also cheaper than their US cousins.
In an interview with Bloomberg today, French President Macron said that he would be open to a major French bank being bought by a European rival.
Finally, when looking at the chart above, the European Financials ETF (ticker: EUFN) has broken above its post-covid ceiling. It revisited the level from above and bounced as if it hit an electric wire. (this is what investors hope to see on the revisit).
The ETF is still 10% below its May 2014 high, but we wouldn’t be surprised if those highs are the next battle.
(This is not a investment advice and is not recommendation to buy or sell any security).