


Smooth Operator
Even Nvidia's earnings and stock split were not enough to support US equities that have been rallying for the last 3 weeks straight. Despite a pause, we don't think the party's over. Let's dig in...
1. Taking a Step Back to Look at the S&P 500 ETF

Source: TradingView. Through year-to-date 2024.
The chart above shows our technical (chart with lines drawn in) view of the S&P 500 ETF (ticker: SPY).
As a reminder, the S&P 500 ETF trades for essentially 1/10th of the price of the S&P 500 - so a level of 4500 on the index equates to 450 on the ETF.
We have highlighted our 5500 fundamental year-end view of the S&P 500 based on ~$275 in 2025 expected earnings (the current 2025 bottoms-up S&P 500 earnings estimate according to FactSet is $278) and a 20x forward multiple (the current multiple is 21x next 12 months expected earnings).
The cup and handle pattern on the chart above measures to approximately 550 (with upside to 560) as well.
Most importantly, looking at the chart and forgetting the achievability of 2025 expected earnings and the elevated valuation (particularly given 10-Year yields), 550 (4% higher) looks like a reasonable target level.
Despite the fact that we continue to see higher US equities in 2024, we believe 2025 will be a very difficult year.
This view is predicated on our belief (highlighted here), that the Fed and Treasury have provided stealth liquidity that will sustain through the election. We believe equities can likely run on seasonality and “animal spirits” through the end of the year, but the check will come due in 2025. We’ll see.
(This is not a recommendation to buy or sell any security and is not investment advice. Please do your own research and due diligence).
2. Nvidia is the Straw that Stirs the Markets Drink
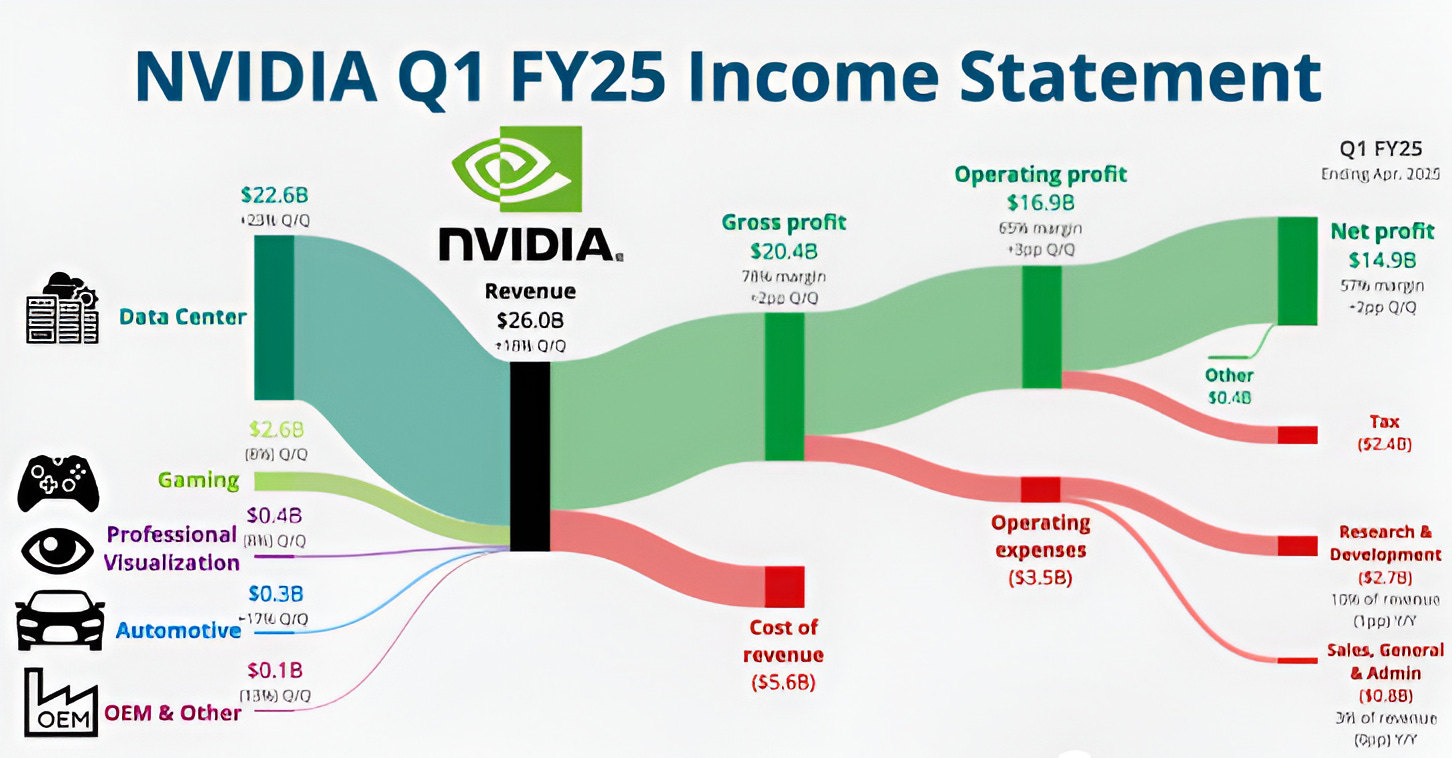
Source: Nvidia; App Economy Insights. Through year-to-date 2024.
The world (or at least US equities) can start spinning again now that Nvidia’s results out of the way.
For Q1 2024, Nvidia reported:
Revenue of $26 billion, up 260% year-over-year;
Data center revenue of $19.4 billion, up 430% year-over-year;
$14.8 billion in net income, up 600% year-over-year;
Earnings per share of $6.12, up 560% year-over-year.
And the company declared a 10 to 1 stock split
These numbers largely met all of the buy-side metrics and whisper numbers.
Most importantly, the results allow the conviction in the durability of the current cycle to increase. In other words, analysts can extend further the length of time that Nvidia will go without a quarter over quarter revenue decline.
We have already begun to read some reports that are focused on 2026. (We highlighted this possibility on Tuesday).
Considering 2026, we will likely see analysts pricing in $40 in annualized earnings power before any pause.
On Tuesday, we highlighted the possibility of a 35x multiple on $30 in earnings.
In our view, this report made it increasingly likely that some portfolio managers will now begin to consider $40 in 2026 earnings and apply a 30x multiple to justify a $1,200 (pre-split) target on Nvidia shares, if not higher.
(This is not a recommendation to buy or sell any security and is not investment advice. Please do your own due diligence).
3. First 100 Days
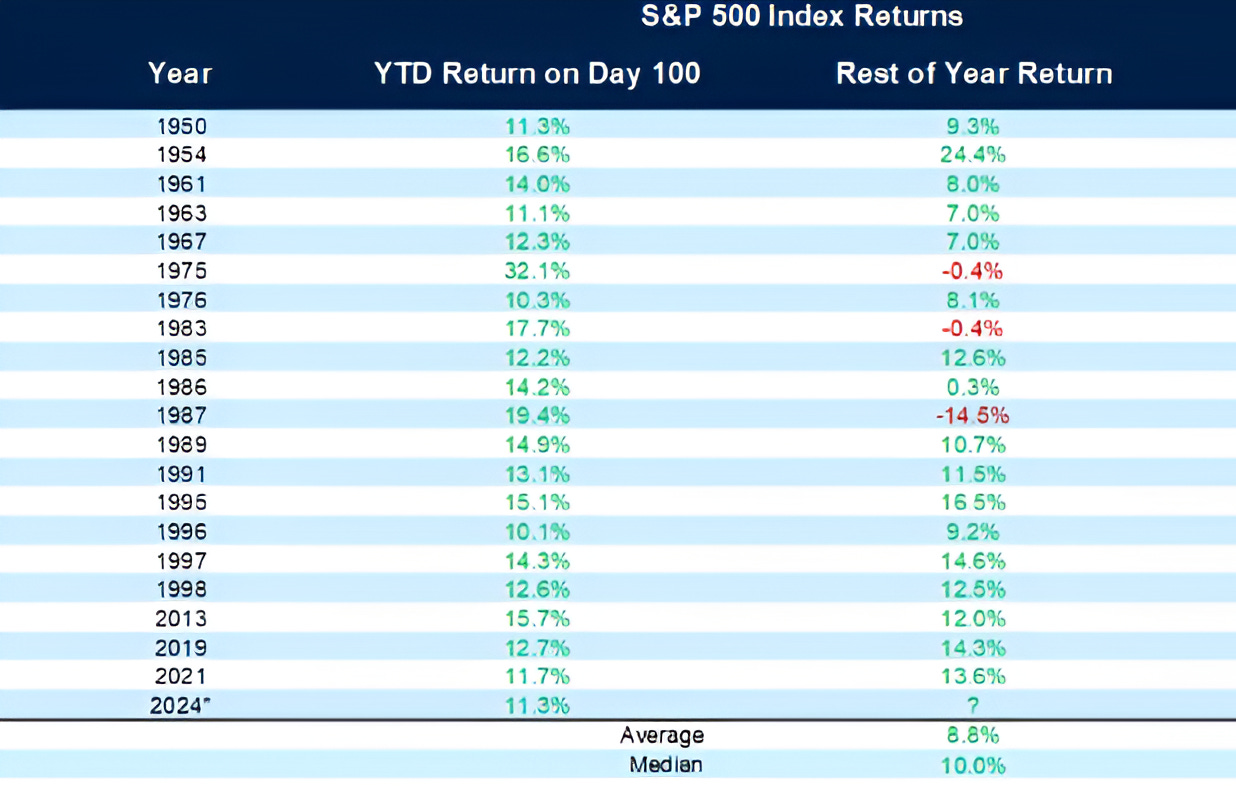
Source: Carson Research. Through year-to-date 2024.
Today is the 100th trading day of 2024.
2024 is the 21st time since 1950 that the S&P 500 has gained more than 10% in the first 100 trading days of the year.
In the previous 20 times that the S&P 500 has been up 10%+ in the first 100 trading days of the year, the average return for the rest of the year has been 8.8% with 3 instances of negative returns (15% of the time). (Past performance is not indicative of future results.)
On average, 100 trading days into the year since 1950, the S&P 500 has been up 3.5% and the rest of the year has returned 5.4% with negative returns 30% of the time.
If the S&P 500 were to appreciate 8.8% from current levels, it would end the year at 5785.
(This is not a recommendation to buy or sell any security and is not investment advice. Please do your own due diligence).
4. Checking in on the 10-Year US Treasury Yield
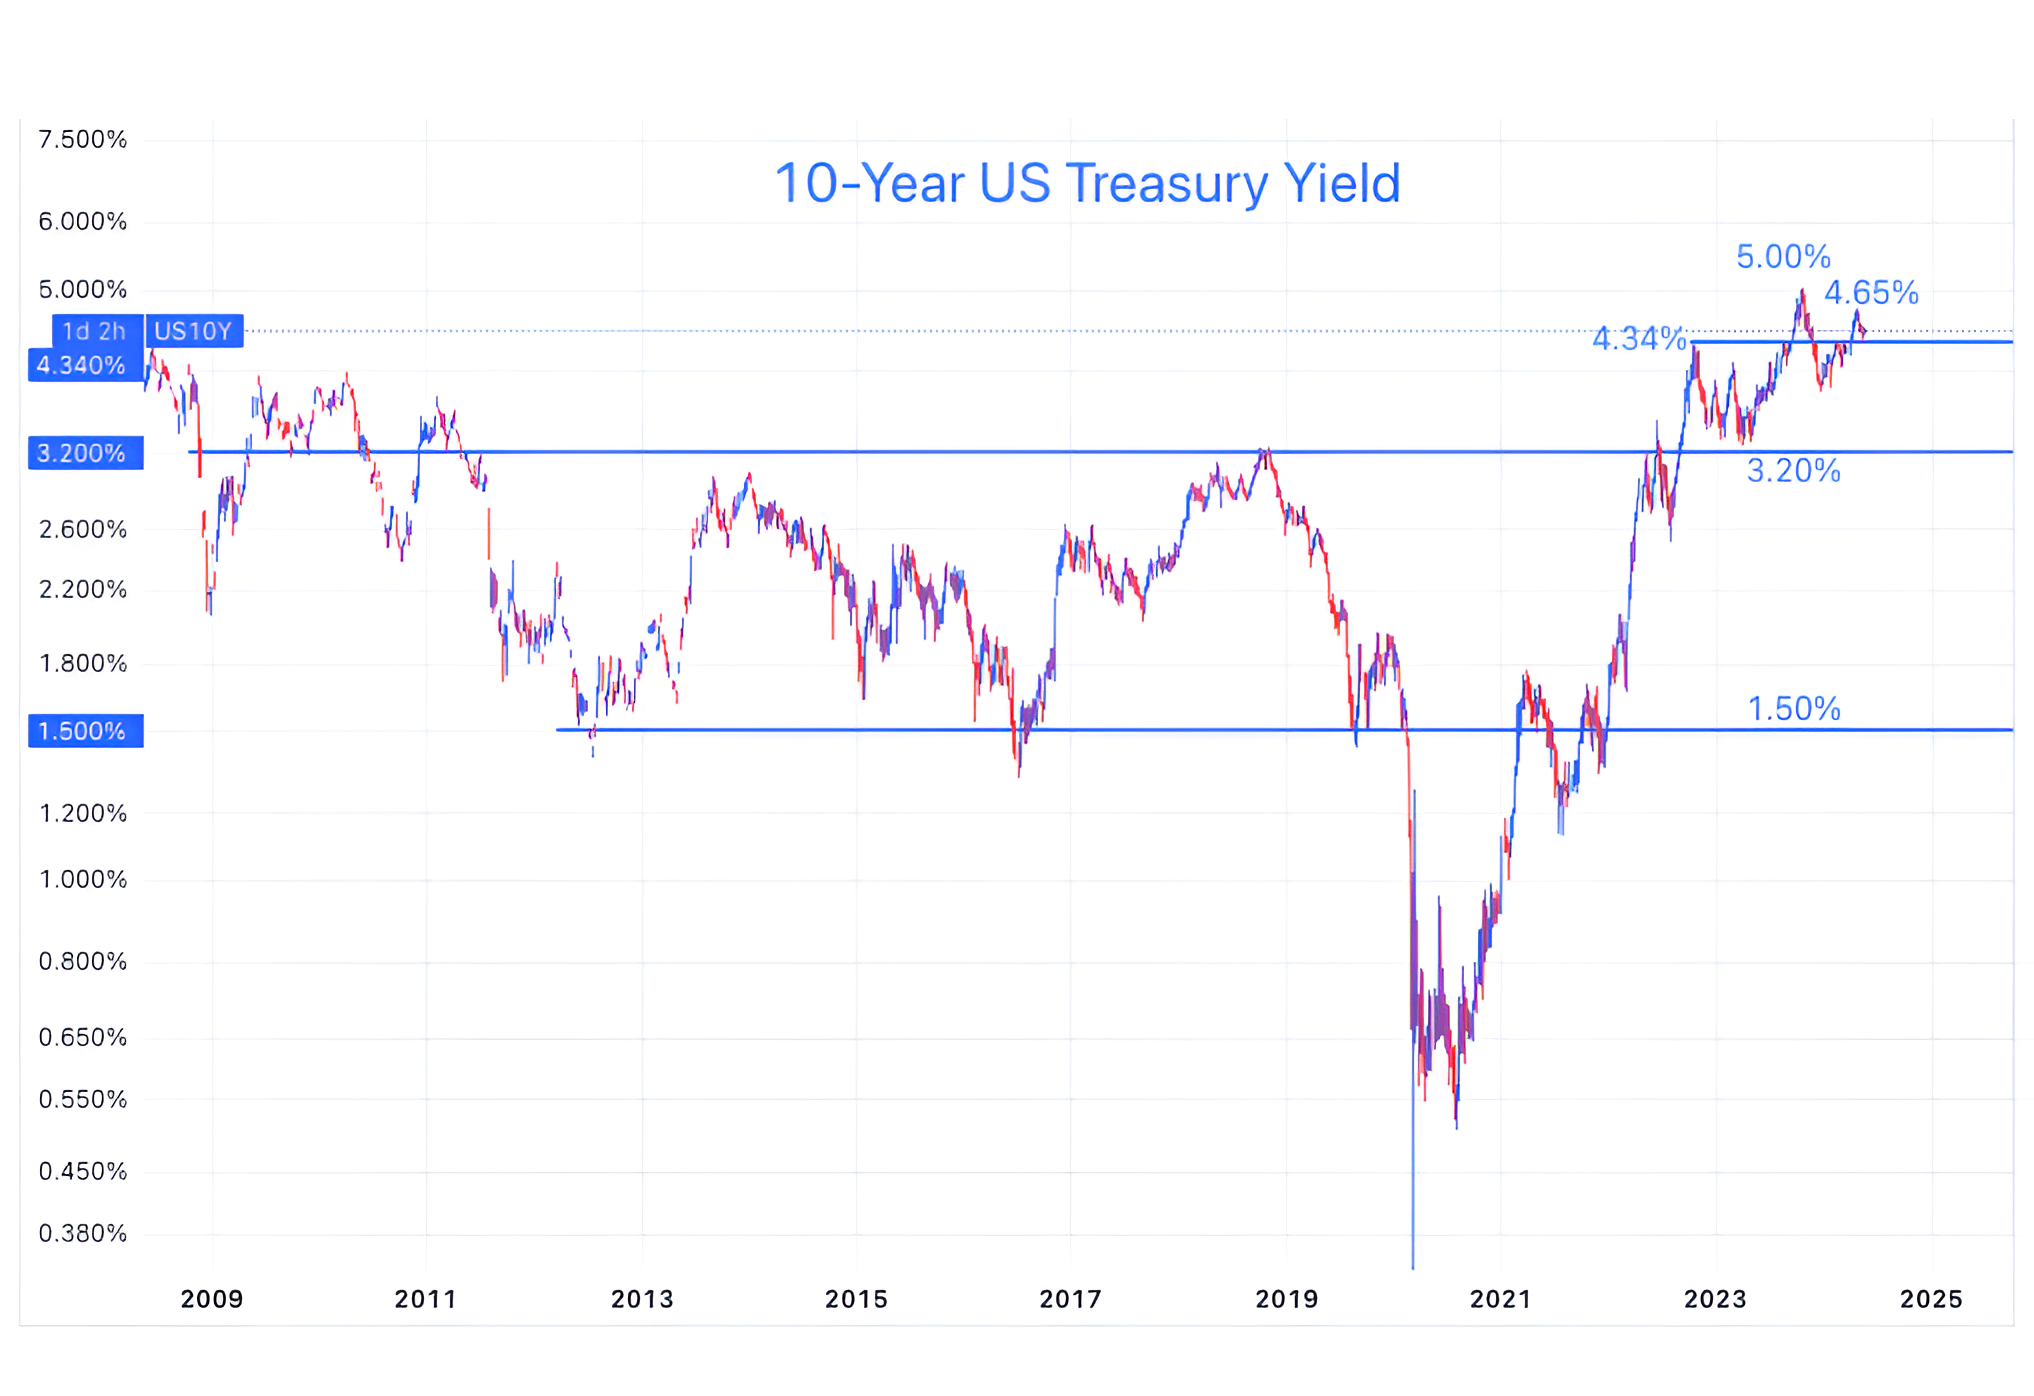
Source: TradingView. Through year-to-date 2024.
We have continually shown the 10-Year Treasury Yield and have consistently highlighted our view that longer-term yields will move higher. (here, here and here).
Our view is based on our belief that bond investors will require a higher yield for Treasuries given the fiscal balance sheet (too much debt).
We also believe that at some point, the stealth liquidity party coming to an end. (This is going to get technical).
As we have continually written, through a combination of the use of the Reverse Repo facility and the Treasury’s General Account, Treasury Secretary Yellen (the wizard) has more than off-set the Fed’s Quantitative Tightening (QT). (We highlighted this here).
This process can’t continue indefinitely unless the Fed restarts QE.
Eventually the Treasury will drain the Reverse Repo facility. At that point, every new penny of debt to fund the deficit (including paying interest costs) will either need to be financed with bank excess reserves, money market fund lending, or the sale of bond/equity holdings in broader financial markets.
In this way, the borrowing needs of the federal government will “crowd out” the private sector.
Our non-scientific timeline for this is December / January.
Looking at the chart above, it is a 15-year chart that shows a sideways pattern that has resolved to the north.
We often show charts with similar patterns that resolve in 2 to 3 years.
In other words, Treasury yields seem to be slower moving (in general) and we expect our view to evolve over time.
(This is not a recommendation to buy or sell any security, please do your own research).
5. Global Equities vs. US.

Source: Creative Planning; Charlie Bilello. Through year-to-date 2024.
On Tuesday, we showed the S&P 500 relative to the MSCI All Country World ex-US.
Today, we are showing the year-to-date total return (in US dollars) of a broad range of global ETFs .
I follow markets relatively closely and if you had told me that Turkey and Peru have been the best performers to this point this year, I would have been surprised.
Likewise, given the rally in commodities, seeing Brazil as the under-performer was something I didn’t expect.
The great part about this list is it has all of the tickers.
I try to write three times a week - generally, Monday, Tuesday and Thursday, schedule permitting.
As Monday is a US holiday, I will pick it up again on Tuesday.
Have a great weekend!
(This is not a investment advice and is not recommendation to buy or sell any security).