


Sultans of Swing
Under the surface a correction has been going on for 2 months. With the major indexes beginning to notice is this the beginning or the end of the volatility? Let's dig in...
This is the 70th Charting Alpha!
While sometimes I provide opinions (although, of course - the opinions are not investment advice), other times, I only provide observations.
I recognize that not every tea leave is meant to be read and that two people can read the same tea leave in opposite ways. The charts I show can be Rorschach tests of sorts as each person views a pattern through their personal lens.
In general, I hope to be informative, thought provoking and educational.
Writing three times a week challenges me to consider and digest a lot of information and the discipline of putting words in a published note has made me a better allocator and investor.
As always, I am open to feedback and constructive input.
Please feel free to hit the button above and share Charting Alpha with whomever you think might find it interesting.
Thank you!
1. Small Caps…So Bad They’re Good?

Source: TradingView. Through year-to-date 2024.
After writing yesterday’s piece (here) that showed the Equal Weight S&P 500, the Software ETF and Consumer Discretionary sector, something I considered was - has the correction already occurred?
In other words, similar to the Russell 2000 Small Caps (above), the Equal Weight S&P 500 peaked at the end of March. In essence, both have been correcting for the past two months.
Is it possible that the correction has existed under the surface and we didn’t notice because it was being masked by Nvidia et al?
With that scenario in mind, when I look at the Russell 2000, I see the possibility of a bullish reverse “Head and Shoulders” formation (the three arcs on the right side of the chart) (good definitions and further reading on “Head and Shoulders” patterns are here and here).
(We last showed the Russell 2000 here).
As always, price needs to convincingly exceed the neckline (at $208.50) to “confirm” the pattern.
If the pattern were to be confirmed, the measured target would be $224 (the top horizontal light blue line).
We continue to expect equity upside into year-end driven by stealth liquidity (that offsets Fed tightening) and robust earnings expectations (achievable? we’ll worry about that another day).
We do believe the “bill will come due” in 2025.
That said, both with respect to the chart above and our outlook, we keep an open mind.
(This is not a recommendation to buy or sell any security and is not investment advice. Please do your own research and due diligence).
2. Industrials are Underperforming. Is it Bullish?

Source: TradingView. Through year-to-date 2024.
Of all 11 US equity sectors, the direction of the Industrials sector is the most correlated with the direction of the overall S&P 500.
Yes, you read that correctly.
Industrials are more correlated with the index direction than Technology which is 29% of the index, more correlated than Financials and every other sector.
However, that correlation does not mean that they have to outperform the index while they are heading in the same direction.
Counterintuitively, looking at the chart above, Industrials relative performance bottomed in December 2021 shortly before the peak in the S&P 500.
The performance of Industrials relative to the S&P 500 peaked in October 2022 - a time that we have highlighted as the bottom of the 2022 sell-off.
In other words, watching the relative performance of Industrials during 2022 would have been a great contrary signal.
(This is because Tech / growth led the sell-off; whereas more value oriented sectors like industrials fell less and relatively outperformed).
For the last month, once again, Industrials have been underperforming as Tech has been driving the market higher.
On a relative basis, Industrials are at a level that has been a floor over the last 20 months.
If Industrials bounce from this level, it may mean that value is taking the leadership baton from growth and the market itself could exhibit volatility.
If Industrials continue to underperform, it could be bullish for the growth shares which have been powering the market higher.
Something to consider and to keep on our collective radars.
(This is not a recommendation to buy or sell any security and is not investment advice. Please do your own due diligence).
3. Two Year Yields are Saying Higher for Longer…
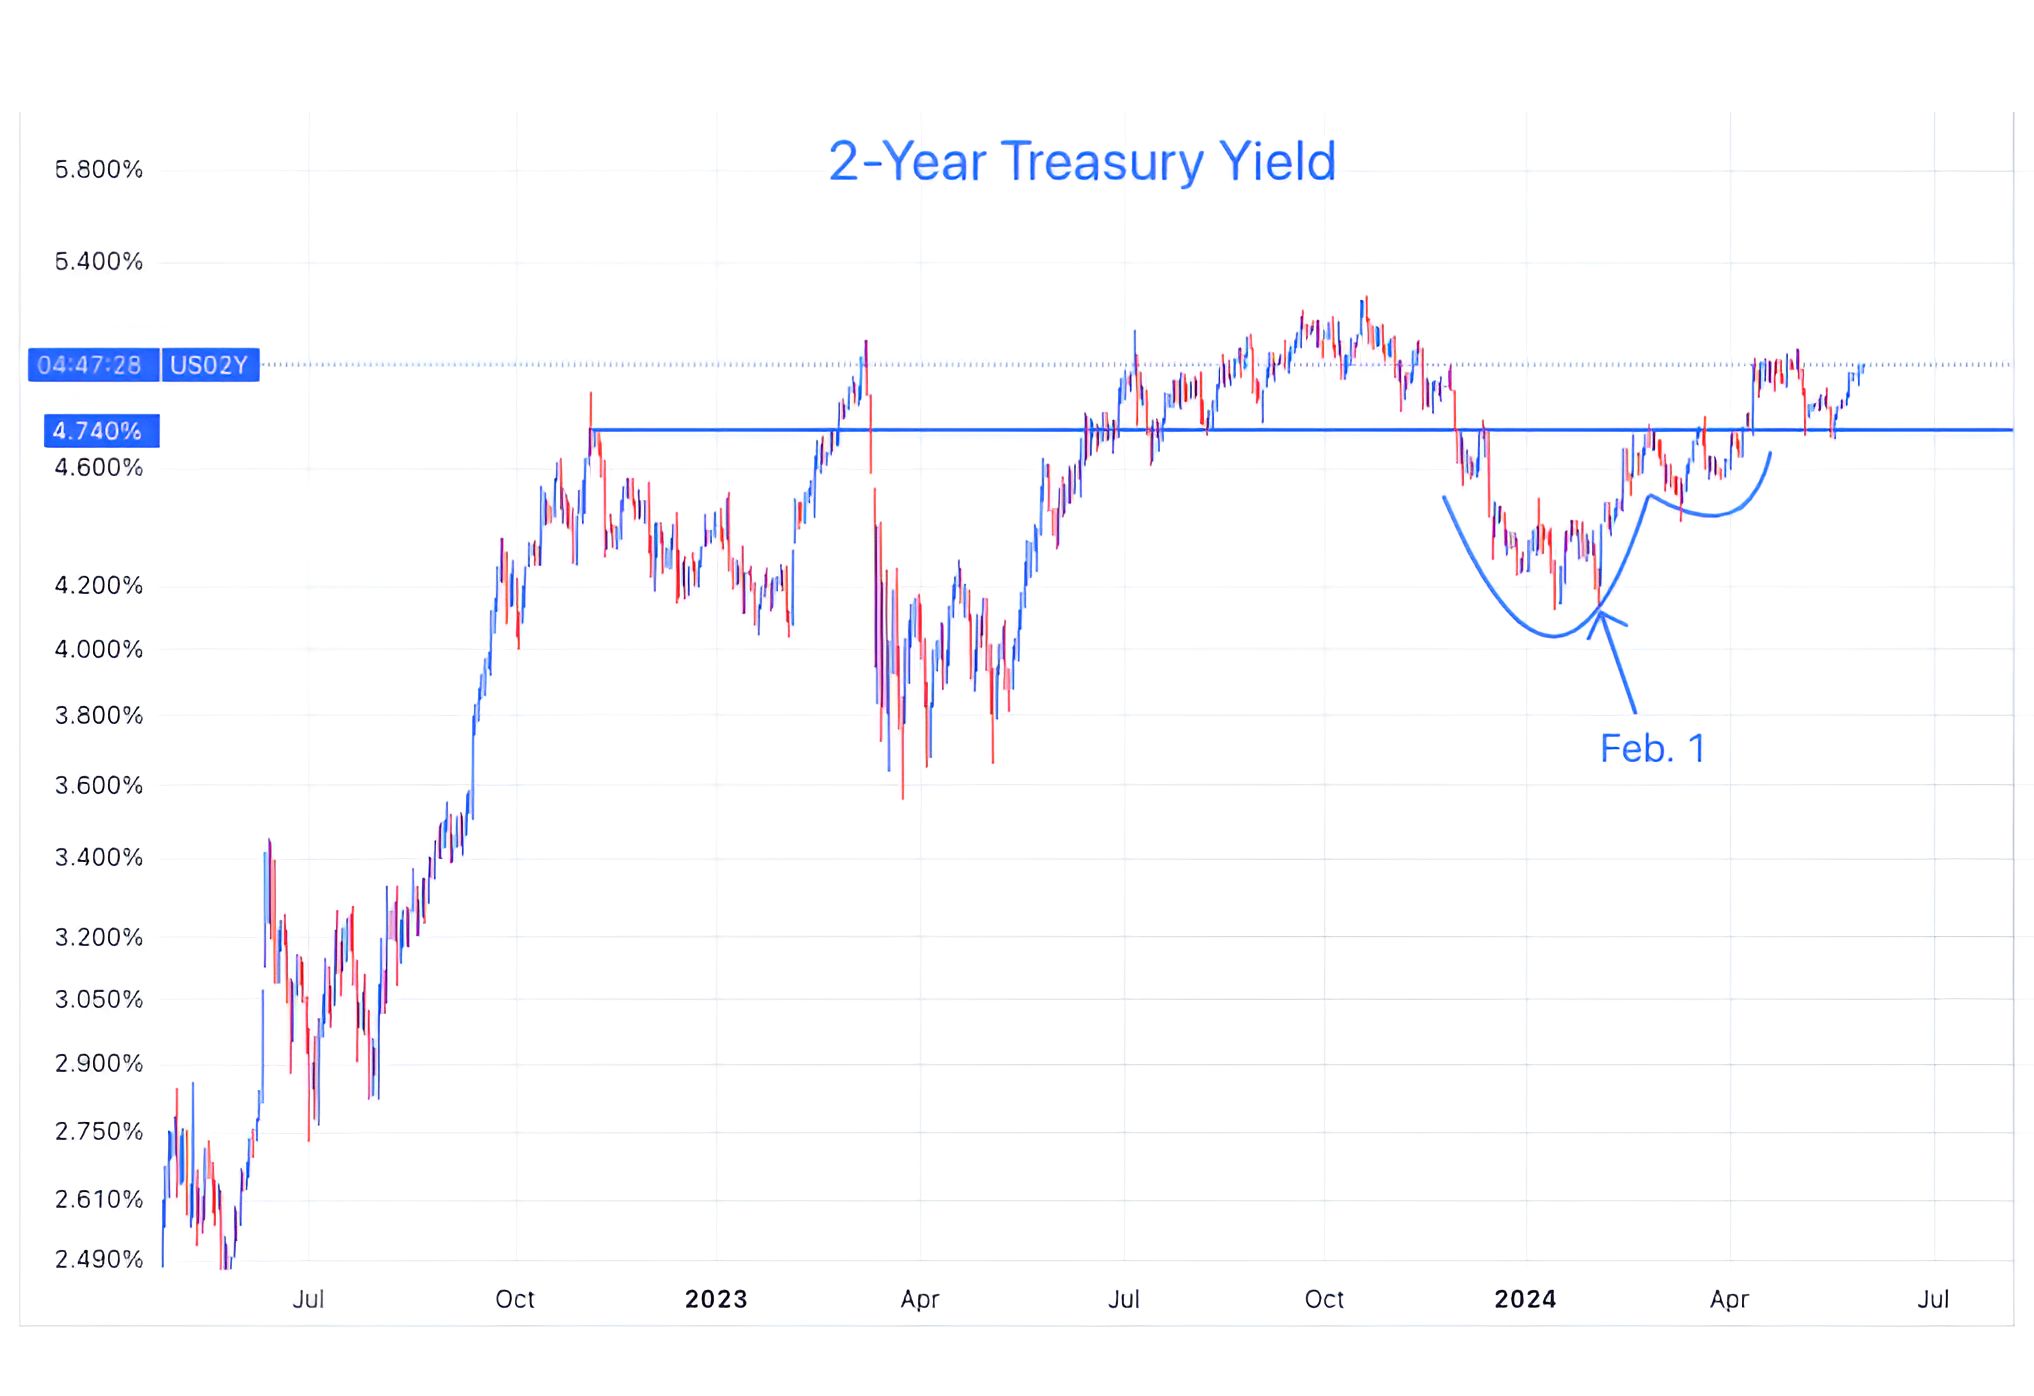
Source: TradingView. Through year-to-date 2024.
We last showed 2-year Treasury Yields here.
Given their short duration, 2-Year Treasury Yields are one of the more sensitive points on the Treasury curve to Fed Funds rates expectations.
On March 1, we asked “Will the Fed’s Next Move Be a Hike?” (here).
While the 2-Year Treasury Yield has not necessarily priced in a hike, since February 1 (a time where we have noted a change in market character that we have attributed to Chinese stimulus), investors have continued to price out 2024 rate cuts.
2-Year Yields are back near 5%.
Over the weekend, Goldman Sachs moved their expected first rate cut to September.
While I view higher Treasury Yields in general as a headwind to equity appreciation given current valuations, an astute observer on X (formerly Twitter) wrote, “Every time a rate cut gets priced out, we can look forward to another equity rally dependent on rate cuts getting priced back in.” (I paraphrased for clarification).
(This is not a recommendation to buy or sell any security and is not investment advice. Please do your own due diligence).
4. My Invitation Must Be Lost in the Mail…

Source: US Federal Reserve Board. Through year-to-date 2024.
Talk about a good time!
For those that don’t know, every (US) summer, the Fed holds an economics conference symposium in Jackson Hole. Speeches are made, policy is discussed and exciting topics like what is R* and why the Taylor rule isn’t working are discussed.
This years theme is “Reassessing the Effectiveness and Transmission of Monetary Policy.”
In other words, the Fed has raised the Fed Funds rate 5.25% - and they want to go to Jackson Hole to discuss why the economy hasn’t slowed more, why is inflation still elevated and why is the Bloomberg financial conditions index reflecting conditions that are near the easiest of the last 20 years?
I hope Fed Chair Powell invited Treasury Secretary Wizard Yellen to explain this to him. (I’m busy that weekend).
In any event, our view has been - and continues to be - that a number of measures undertaken by the Treasury have offset the Fed’s tightening.
We have called this stealth liquidity or stealth stimulus (see here which includes links to previous notes).
We see stealth liquidity supporting US equity markets through the end of the year.
(This is not a recommendation to buy or sell any security, please do your own research).
5. We Can’t Resist a Good Seasonality Chart

Source: Bank of America, Bloomberg. Through year-to-date 2024.
We’ve shown a number of Presidential Year (year 4 of the US Presidential cycle) charts.
Our favorite is chart 5 here.
The chart above is interesting in that it compares the average returns of each 3-month period of presidential election years to the corresponding average returns of all years from 1928.
Interestingly, the June through August period (the period we are entering next week) has historically been the strongest 3-month period in presidential election years and has the greatest historical outperformance over the average year.
Furthermore, during US presidential election years, the June through August period has had positive returns 75% of the time vs. 65% in all years. (PAST PERFORMANCE IS NOT INDICATIVE OF FUTURE RESULTS).
While we would not rely solely on seasonality for any of our views - we recently saw someone who likened seasonality to receiving favorable cards in blackjack or an attractive hand in poker.
Like a good hand, seasonality can potentially improve your odds and it may alter your betting, but it is far from a guarantee.
(This is not a investment advice and is not recommendation to buy or sell any security).