


Livin' on a Prayer
With the S&P 500 back near its all-time high, Fed rate cuts priced in, downward earnings revisions and premium valuations, what will it take for equities to move higher? Let's dig in...
Maybe Livin’ on a Prayer is a bit dramatic, but as we stated last week, it is a difficult macro, economic, and earnings environment with equities at a premium valuation.
Although we have learned not to question (or at least respect) the equities market ascent over the past 18 months, we question what the catalyst could be to generate the next 5% of upside.
Perhaps Friday’s employment report will re-ignite the soft landing narrative? Maybe earnings growth from the “other 493” will take the baton from the magnificent 7?
In our view, the market has been supported by the Treasury’s “stealth stimulus” for the last 18 months. According to Dan Clifton at Strategas (the best policy analyst by far), the Treasury’s hose will become a drain in the second half of the month (we showed this in chart 2 here).
Complicated times.
I will be traveling for the rest of this week and will write again next Tuesday.
1. Sink or Swim? the S&P 500 Has Been Treading Water / Holding Steady at the Same Level for 2 Weeks
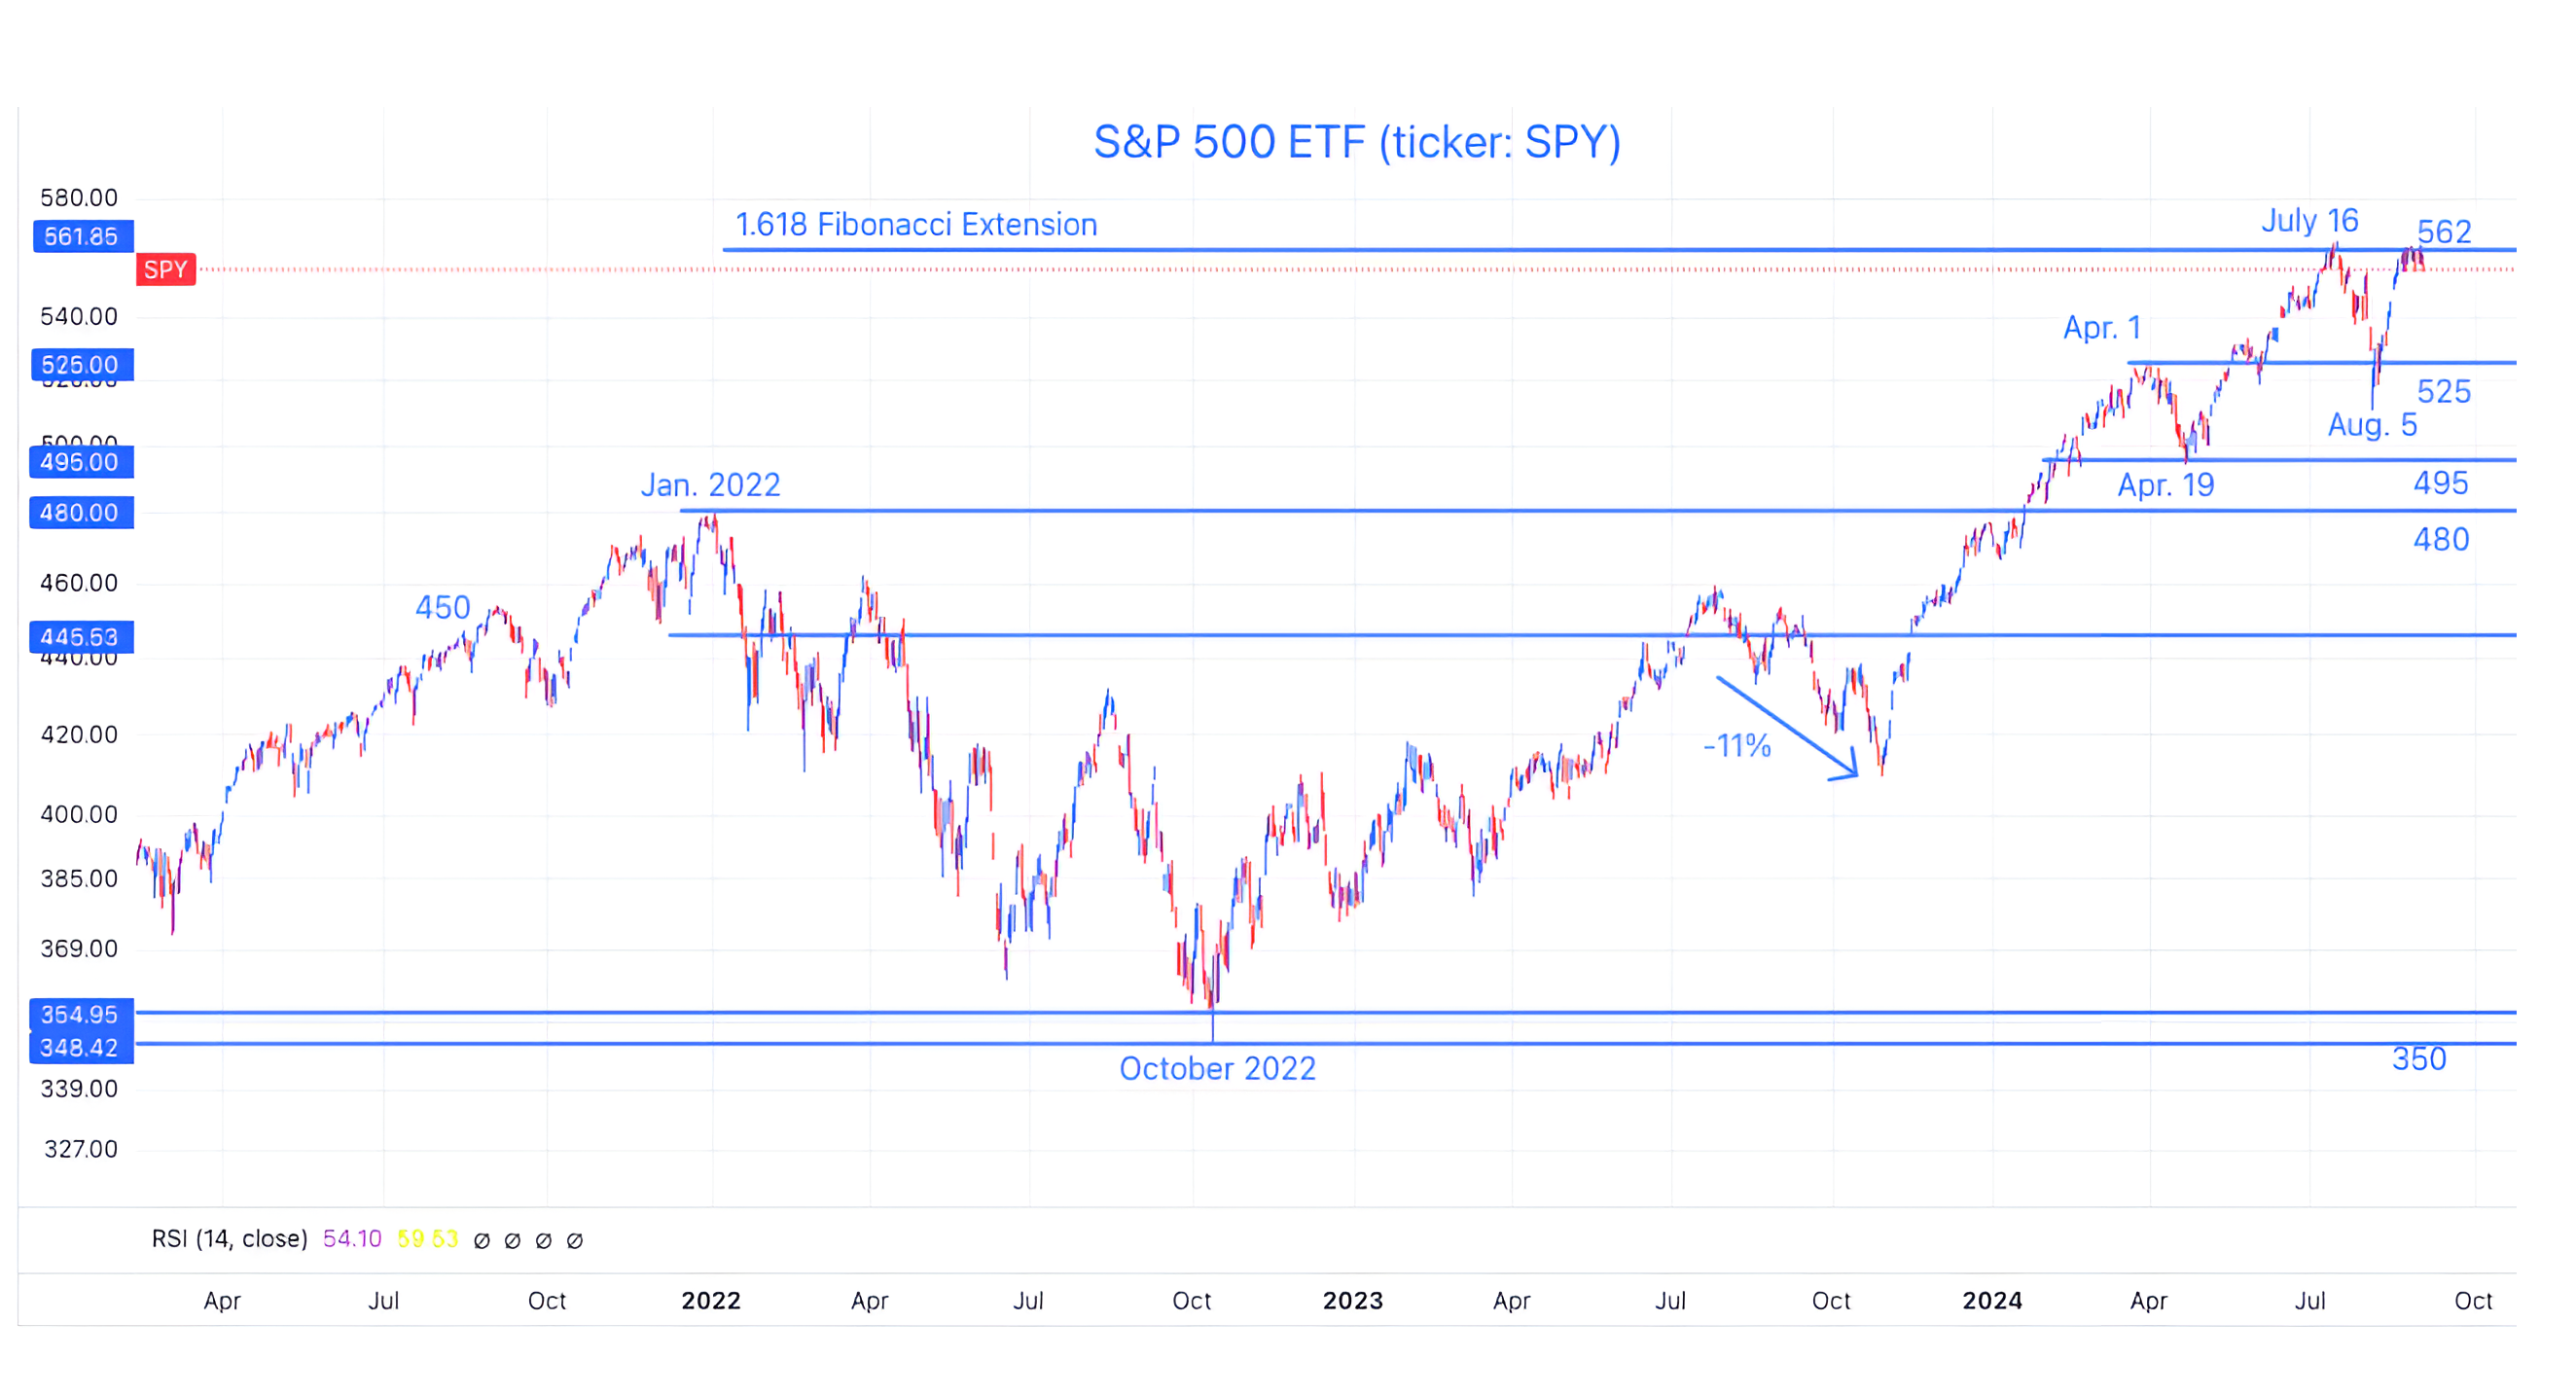
Source: Trading View. Through year-to-date 2024.
The chart above shows the S&P 500 ETF (ticker: SPY).
It may be a little difficult to see, but the S&P 500 ETF (and the S&P 500) has been trading at the same level - in the neighborhood of 562 - for two weeks.
As a reminder, 562 on the S&P 500 ETF is the 1.618 Fibonacci extension of the January to October 2022 sell-off.
We first highlighted this (using the S&P 500 rather than the ETF) in early June (here) and this level continues to be a magnet.
Despite the fact that the S&P 500 ETF was able to climb rapidly back to the 562 level after its late July / early August sell-off, we have continued to be concerned about decreasing earnings expectations in a premium valuation (top decile of the last 25 years) environment.
Furthermore, as we look at economic data, we question some of the inconsistencies we have seen - particularly with employment, the consumer (credit card delinquencies) and consumer shares (chart 2 here).
Finally, there is the US Presidential election. Along with Presidential year seasonality (see chart 5), some of the policies that have been proposed, on both sides, are potentially market moving. In our opinion, the market may begin to consider election uncertainty over the next month.
All of that said, the strength in equities over the past 18 months has defied expectations (the S&P 500 is currently above most 2024 year-end strategist estimates).
We will see if the ETF can climb sustainably above the 562 level and continue to prove people wrong.
(This is not a recommendation to buy or sell any security and is not investment advice. Please do your own research and due diligence).
2. I’m Beginning to Think Banks are Near an Important Level
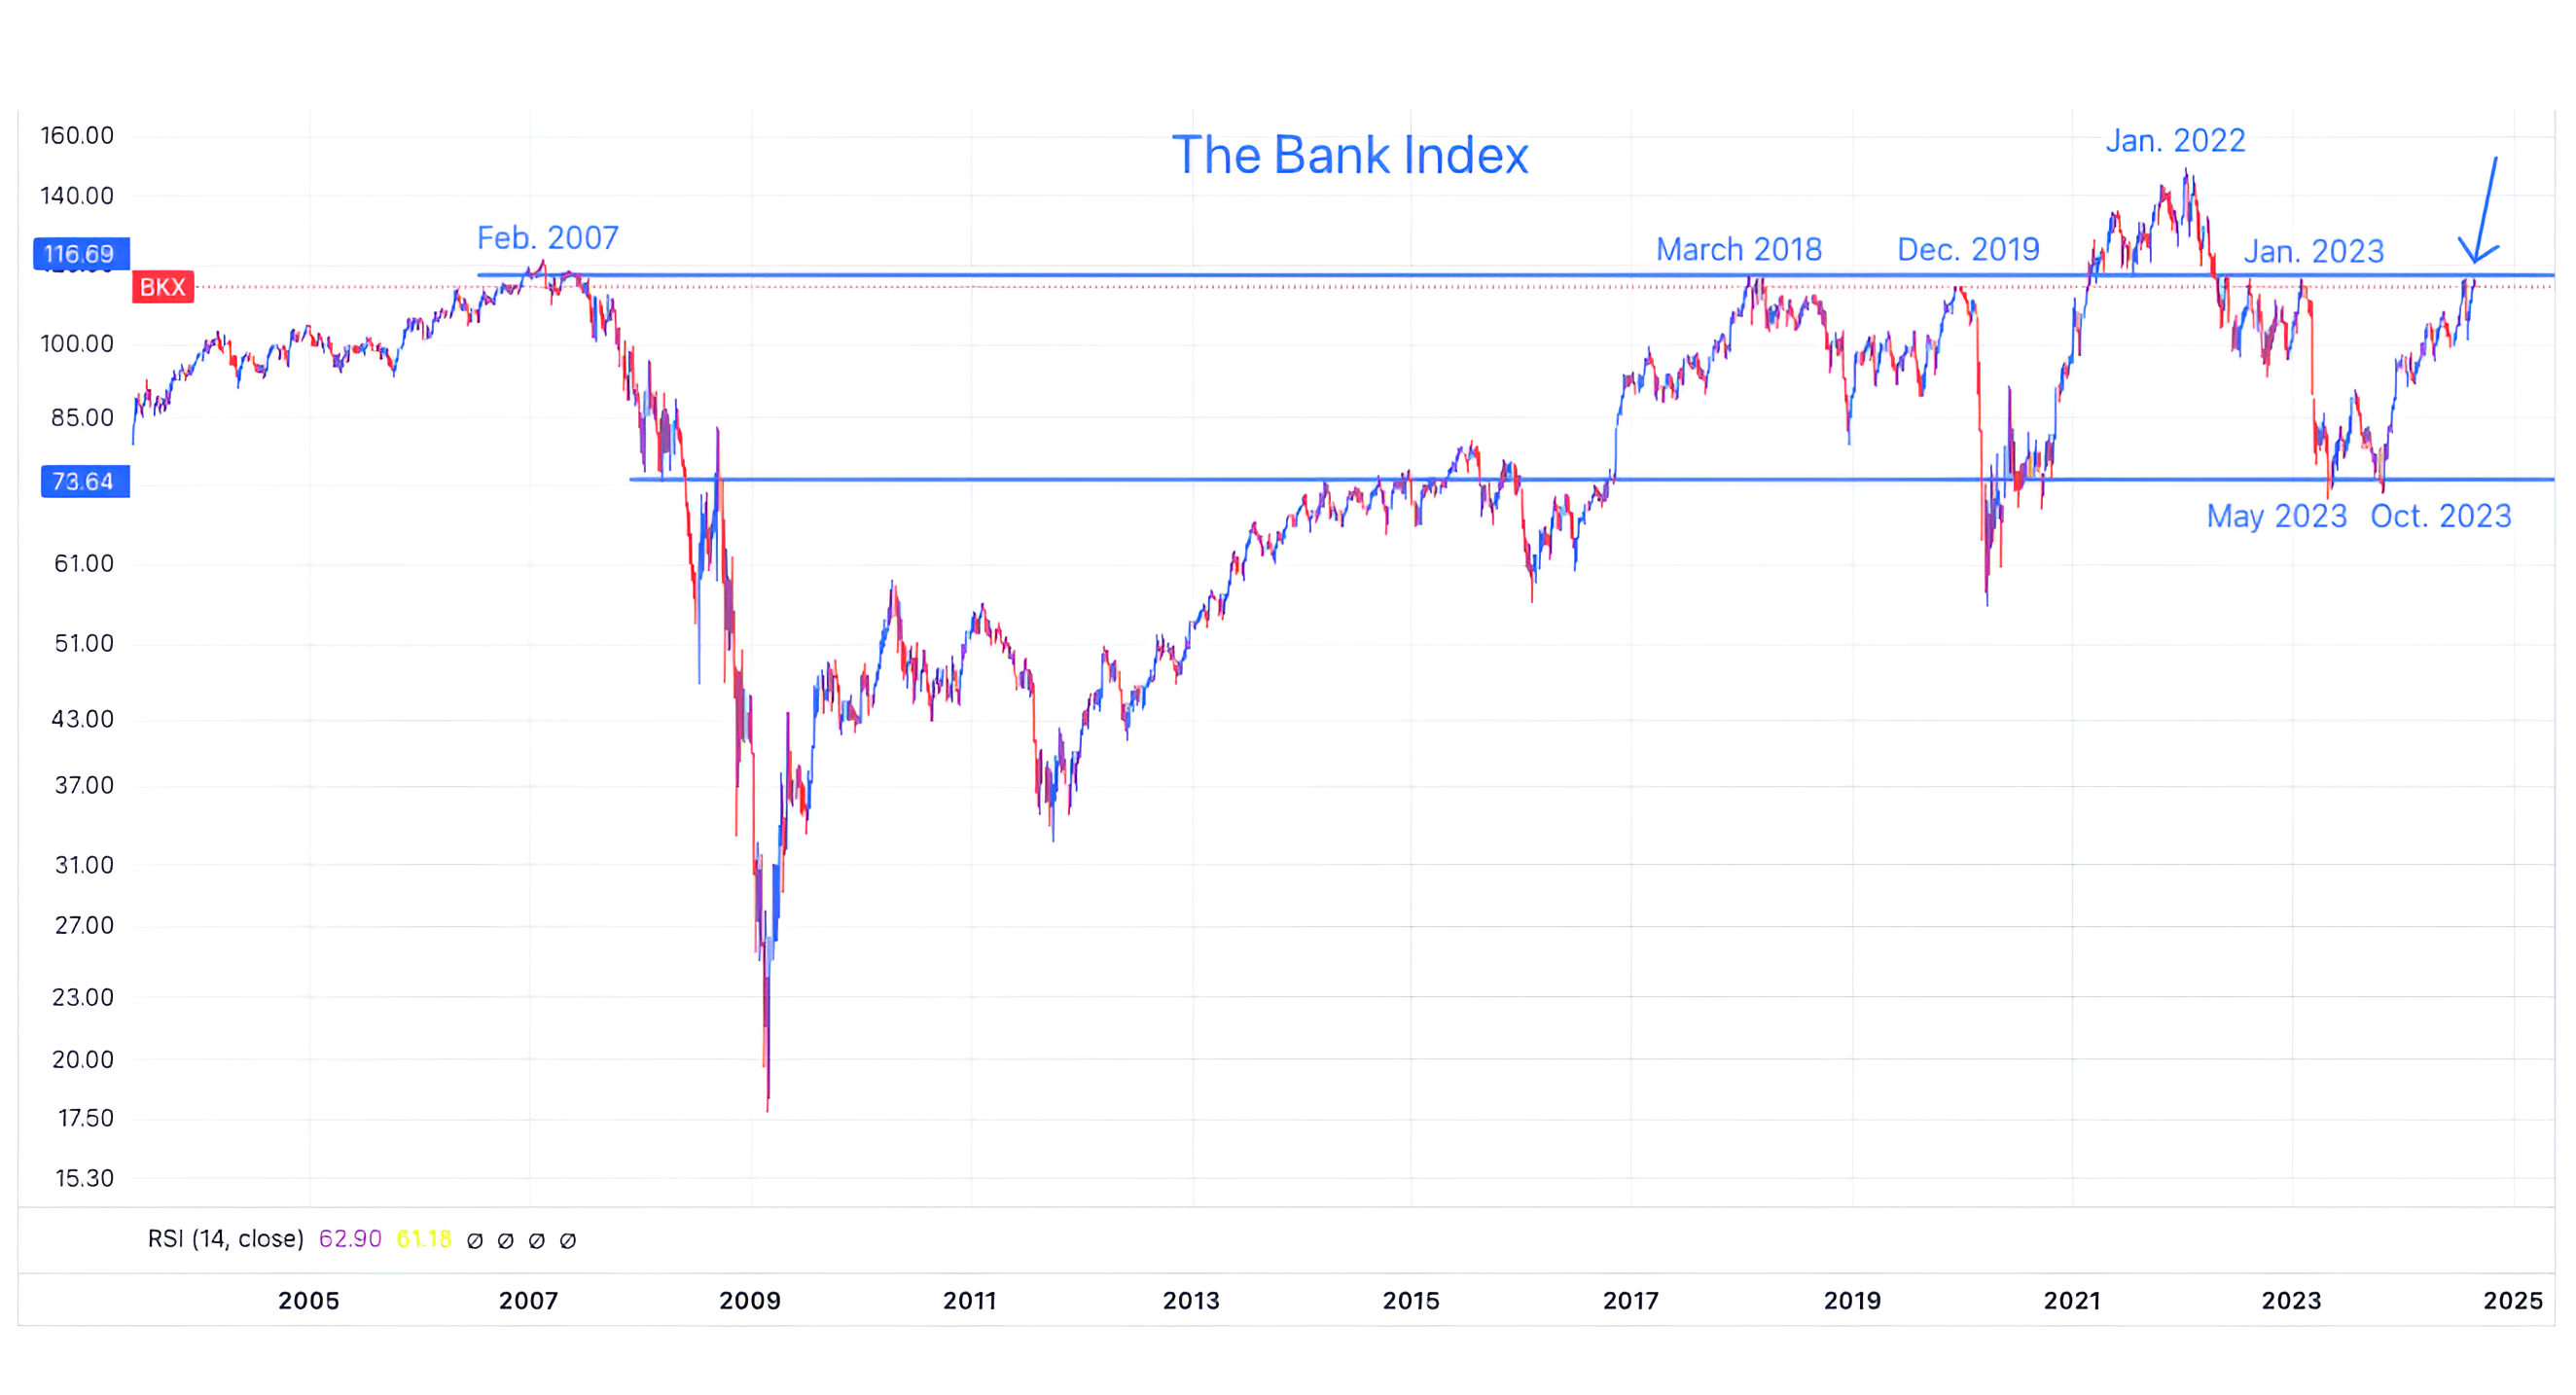
Source: Trading View. Through year-to-date 2024.
The chart above shows the Bank Index since 2005.
Unlike the Financial sector that includes insurance companies, credit card issues and asset managers - the Bank Index, as its name implies only includes Banks.
The Index is nearing a level (the top horizontal light blue line) that - with the exception of 2022 - has acted as a ceiling for the past 17 years.
In fact, when it has approached this level in the past it has foreshadowed broader challenges:
February 2007 - the beginning of the Financial Crisis.
March 2018 - sell-off through the year.
December 2019 - Covid.
January 2022 - 2022 sell-off.
January 2023 - regional banking crisis.
Compliance reminds us that past performance is not indicative of future results. Could this be the time that Banks can sustainably surpass this hurdle?
(Past performance is not indicative of further results. This is not a recommendation to buy or sell any security and is not investment advice. Please do your own due diligence).
3. Watching the Relative Performance of Utilities
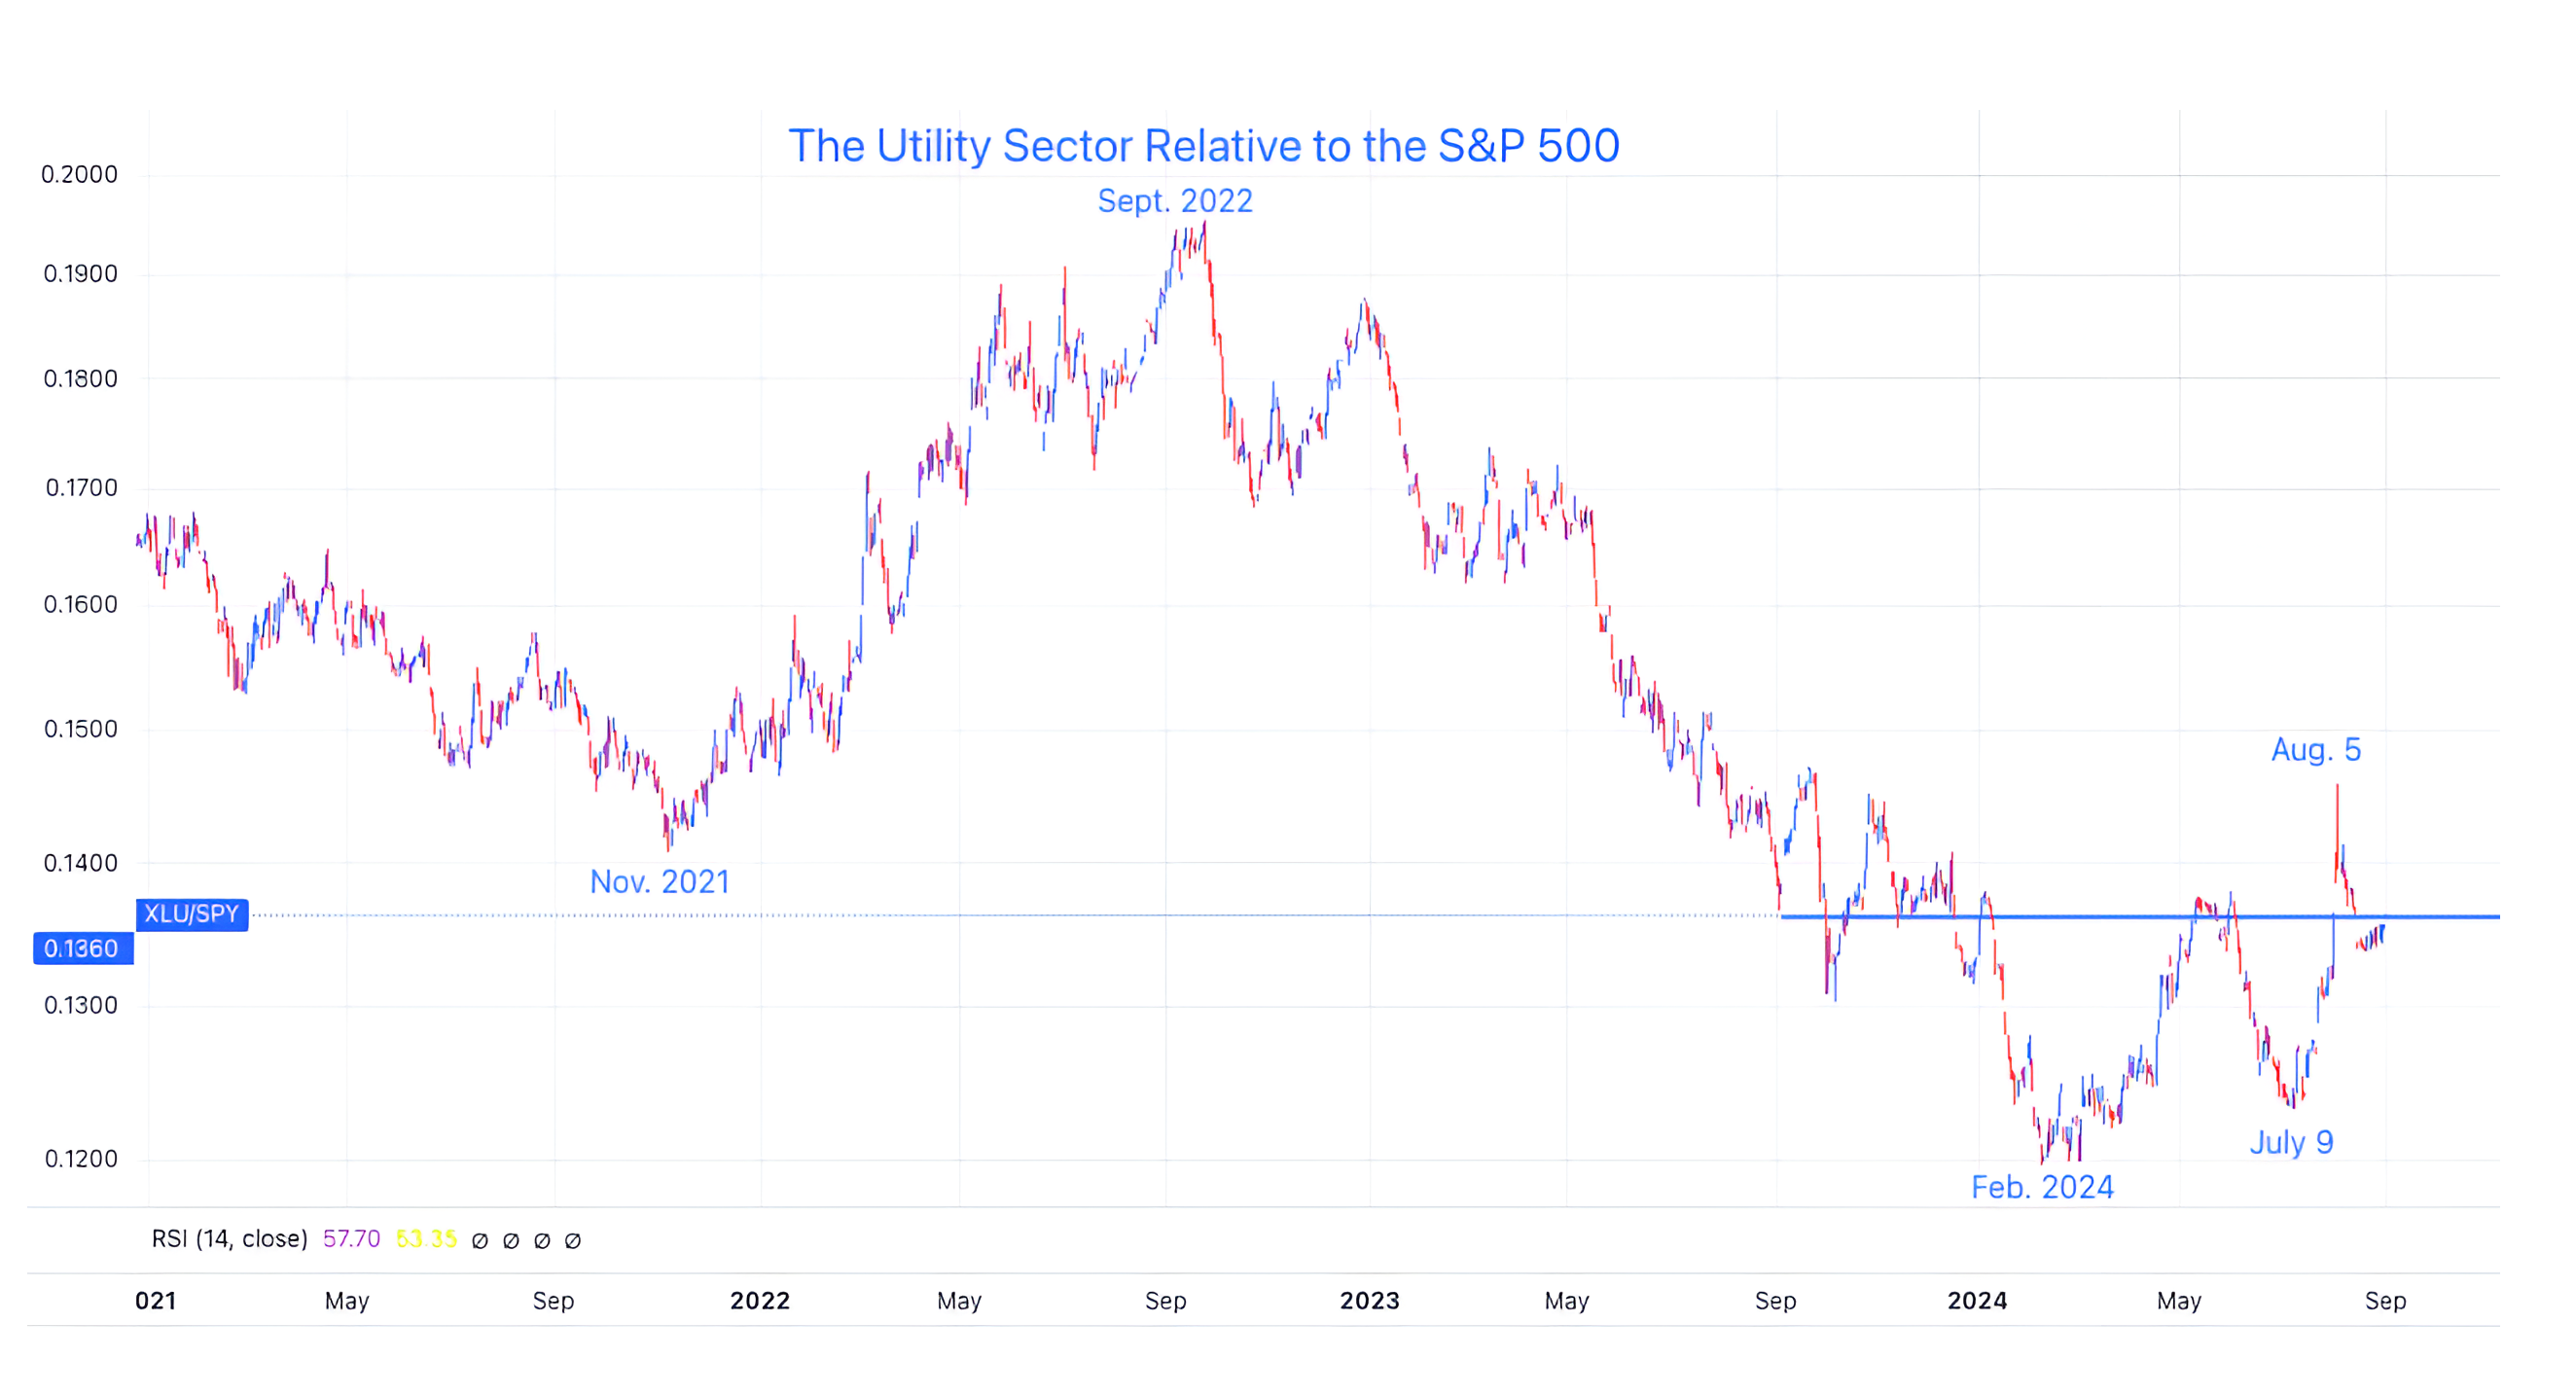
Source: Trading View. Through year-to-date 2024.
The chart above shows the Utilities sector ETF relative to the S&P 500.
The Utilities sector began to outperform in November 2021, about five weeks before the S&P 500 began its 2022 sell-off.
The relative performance of Utilities vs. the S&P 500 peaked in September 2022, one month before the S&P 500 bottomed in October 2022.
More recently, the Utilities sector began to outperform in February 2024 about five weeks before the April sell-off.
Similarly, in early July, about a week before overall equity market volatility took hold, the Utilities began to outperform (the relative outperformance ended on the day the S&P 500 bottomed).
In other words, Utilities outperformance and underperformance has often been counter to the absolute performance of the S&P 500.
While we recognize the impact of interest rates and the thesis that electric utilities are a necessary part of AI and are therefore “different this time,” we want to watch if the Utilities move above the horizontal blue line and once again begin to outperform.
Along with Consumer Staples vs. Consumer Discretionary (we showed this in chart 2 here) the outperformance of Utilities reflects a defensive rotation that we often see around economic slowdowns.
(Past performance is not indicative of future results. This is not a recommendation to buy or sell any security and is not investment advice. Please do your own due diligence).
4. Private Payrolls are in Recessionary Territory
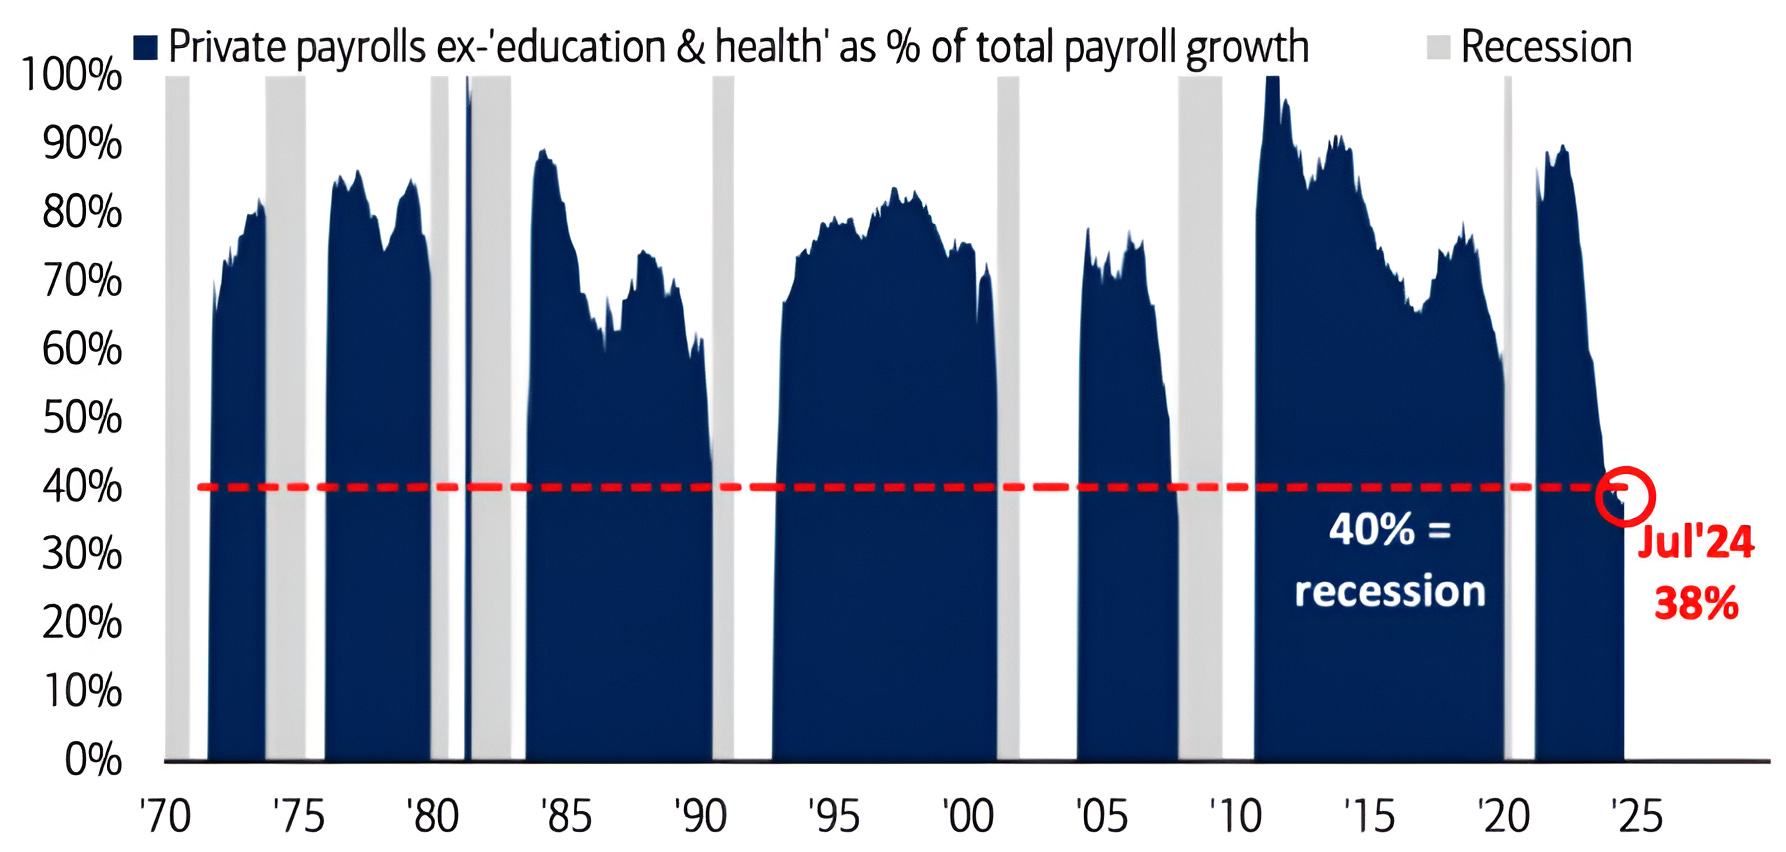
Source: Bank of America. Through year-to-date 2024.
The chart above shows US Private payrolls ex-education and health as a % of total payroll growth.
While I don’t love esoteric data, what this shows is the government contribution to employment.
With the US employment report coming out on Friday, it is important to note that the US Government is currently contributing a very large share to the overall employment growth.
According to Bank of America, the last six times private payrolls dropped below 40% of total employment, recessions have followed.
(Past performance is not indicative of future results. This is not a recommendation to buy or sell any security and is not investment advice. Please do your own due diligence).
5. Does the Equity Market Predict the Election or Does the Likely Election Outcome Guide the Market?
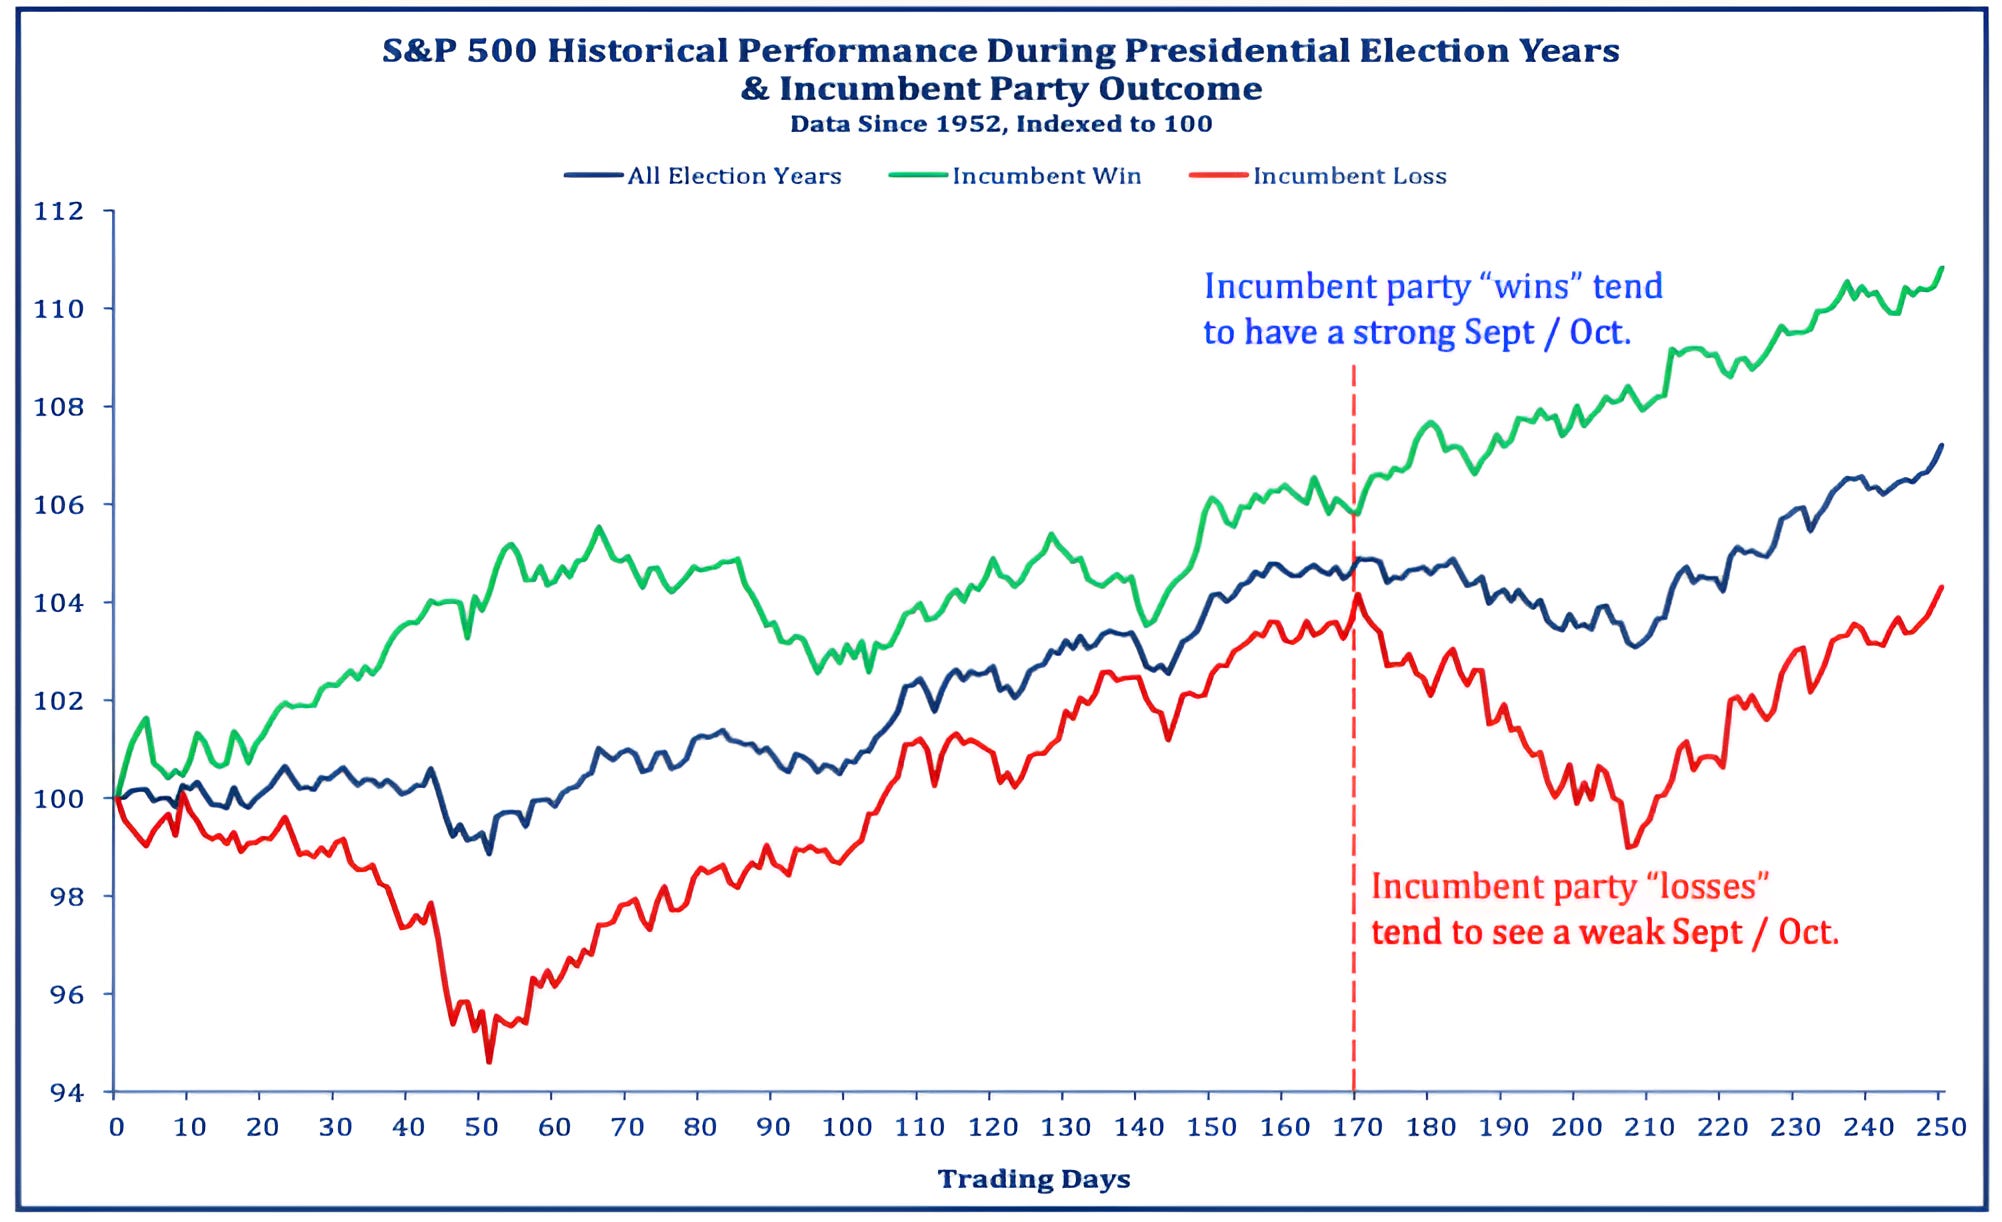
Source: Strategas. Through year-to-date 2024.
The chart above shows the average path of the S&P 500 during all US presidential election years (blue line); those election years when the incumbent party has won (green line); and those when the incumbent party has lost (red line).
In those years when the incumbent party has won, the S&P 500 has started the year strong and after bottoming in early July, US equities have rallied straight through the end of the year with no pause in September and October.
In those years when the incumbent has lost, the S&P 500 has been weak in the first two months of the year, rallied through late August, sold off in September and October and climbed in November and December.
Thus far, from an equity market perspective, 2024 has exhibited characteristics of an incumbent winning.
The S&P 500 began the year very strong and around day 60 (the end of March - around 20 trading days per month), it sold off.
It recovered and the July sell-off (which has occurred both when the incumbent has won and lost) was a little later this year than typical.
All of that said, with the mid-July Biden to Harris switch, we believe that the performance of the S&P 500 in September and October may provide more significant insight than typical into the election outcome.
However, this once again leaves us with our question, does the likely election outcome guide the market or does the market impact the election?
(Past performance is not indicative of future results. This is not a recommendation to buy or sell any security, please do your own research).