


Land of Confusion
Despite several macro and micro cross currents, the S&P 500 continues to flirt with new all-time highs. If the S&P 500 reaches new heights, will it be sustainable? Let's dig in...
This is a complicated - dare I say confusing (thus the title) market environment:
Every day, I’m asked if I think we’re coming into a recession. While several traditional recessionary signals have been flashing yellow or red for over a year, the hard data has not confirmed the slowdown.
The two indicators, I am continuing to watch are the “un-inversion of the yield curve” and unemployment.
Historically, after a yield curve inversion with short-term rates higher than long-term, recessions have not occurred until after short-term yields are once again lower than long-term yields. 2-Year US Treasury yields remain about 0.06% above 10-Year US Treasury yields.
In addition, as unemployment increases, this has been the most consistent slow-down indicator. While at times it has seemed that unemployment is rising - as we highlighted in chart 3 here - it has not yet provided the full signal.
Earnings expectations - as we’ve continued to highlight (most recently in chart 3 here) are too high and continue to be revised lower. At the same time valuations remain in the top decile of the past 25 years.
The political environment in the US is complicated with competing economic plans and a nearly 50/50 likelihood of either candidate winning.
We think the market may begin to consider this next week (the first week that Wall Street goes back to work after the US labor day which is the unofficial end of summer).
Liquidity - we have continued to highlight the Treasury’s “stealth liquidity” (most recently in chart 2 here). As “stealth liquidity” gives way to traditional liquidity (rate cuts expected in September) we want to consider whether this will be a smooth hand-off.
Nasdaq 100 underperformance. The Nasdaq 100 has been underperforming the S&P 500 for the last six weeks and is at a critical level relative to the S&P 500. We highlight this in chart 1 today.
The last time the Nasdaq 100 began to underperform the S&P 500 was in December 2021 - one month before the 2022 market sell-off began. Will this occur again?
Historical analogs and momentum remain bullish!! Despite all of the cross-currents and concerns cited above, the S&P 500 is at or near-all time highs and many of the historical analogs that we show (usually in our 5th chart of the day) suggest solid gains over the next 12 months.
Now on to today’s title and picture.
For those of a certain age, the song Land of Confusion by Genesis and the accompanying music video evokes memories of sock puppets and the cold war.
With the election coming and vitriol heightened on both sides, I thought I would share this sock puppet depiction of President Reagan and his wife from the video. Funny to think of the 1980s as the good old days.
As a bit of trivia: the daughter of Phil Collins - the drummer in Genesis - Lily Collins is the star of the Netflix series “Emily in Paris.” Season 4 drops on September 12.
Have a great weekend!

Source: Genesis
1. The Nasdaq 100 Relative to the S&P 500 - at a Critical Level

Source: Trading View. Through year-to-date 2024.
The chart above shows the Nasdaq 100 relative to the S&P 500.
While the relative charts that we show depict which asset is outperforming the other and often reflect where we want to emphasize our investments, we think the relationship between the Nasdaq 100 and S&P 500 might have broader implications.
The Nasdaq 100 underperformed the S&P 500 in February 2021 and in December 2021.
In each instance, the underperformance was accompanied by a sell-off in the S&P 500. In February 2021, the sell-off was 6% and beginning in January 2022 the sell-off was 27%.
Perhaps the 10% mid-July to August 5 sell-off in the S&P 500 was “it.”
However, as the relationship between the Nasdaq 100 and S&P 500 is at a level that has been both a ceiling (resistance) and a floor (support) in the past (lower blue horizontal line), we think it’s possible that further Nasdaq 100 underperformance from current levels (that would see the relationship fall below the line) may be accompanied by additional S&P 500 volatility.
One final characteristic of note on this chart - the Nasdaq 100 did not bottom relative to the S&P 500 until January 2023 despite the fact that the S&P 500 hit its low in October 2022 (the Nasdaq 100 revisited its October 2022 low in January 2023).
(This is not a recommendation to buy or sell any security and is not investment advice. Please do your own research and due diligence).
2. Checking in on the Consumer

Source: Trading View. Through year-to-date 2024.
The chart above shows the Consumer Discretionary ETF (ticker: XLY) relative to the Consumer Staples ETF (ticker: XLP).
This is one of our favorite “indicators.”
While this is not a perfect proxy for “are consumers spending on discretionary items or do they only have money for what’s necessary (staples)?” - it has been an important signal around major market turns.
Here is some management commentary from last nights Dollar General (a Consumer Staples share) earnings call:
“I want to provide some additional context around what we’re seeing and hearing from our customers.
Our core customer who contributes approximately 60% of our overall sales comes predominantly from households earning less than $35,000 annually.
The majority of them state that they feel worse off financially than they were six months ago as higher prices, softer employment levels and increased borrowing costs have negatively impacted low income consumers.
Inflation has continued to negatively impact these households with more than 60% claiming that they have had to sacrifice on purchasing basic necessities due to the higher cost of those items, in addition to paying more for expenses such as rent, utilities and healthcare.
More of our customers report that they are now resorting to using credit cards for basic household needs and approximately 30% have at least one credit card that has reached its limit. And in our latest survey, 25% of our customers surveyed noted they anticipated missing a bill payment in the next six months.
While middle and higher income households are seeking value as well, they don’t claim to feel the same level of pressure as low income households."
It is notable in our view that the relationship between Consumer Staples and Consumer Discretionary peaked in November 2021 slightly before the Nasdaq 100 relative to the S&P 500 (chart 1) and about 6 weeks before the S&P 500 topped in January 2022.
In the current period, we find it interesting that the S&P 500 has recovered back to its mid-July high (within 1%) while the relationship between Consumer Staples and Consumer Discretionary shares has not only not recovered but was unable to fill its early August gap.
In other words, the weakness in this relationship (and the Dollar General commentary) has our attention.
(Past performance is not indicative of further results. This is not a recommendation to buy or sell any security and is not investment advice. Please do your own due diligence).
3. All Nvidia all of the Time
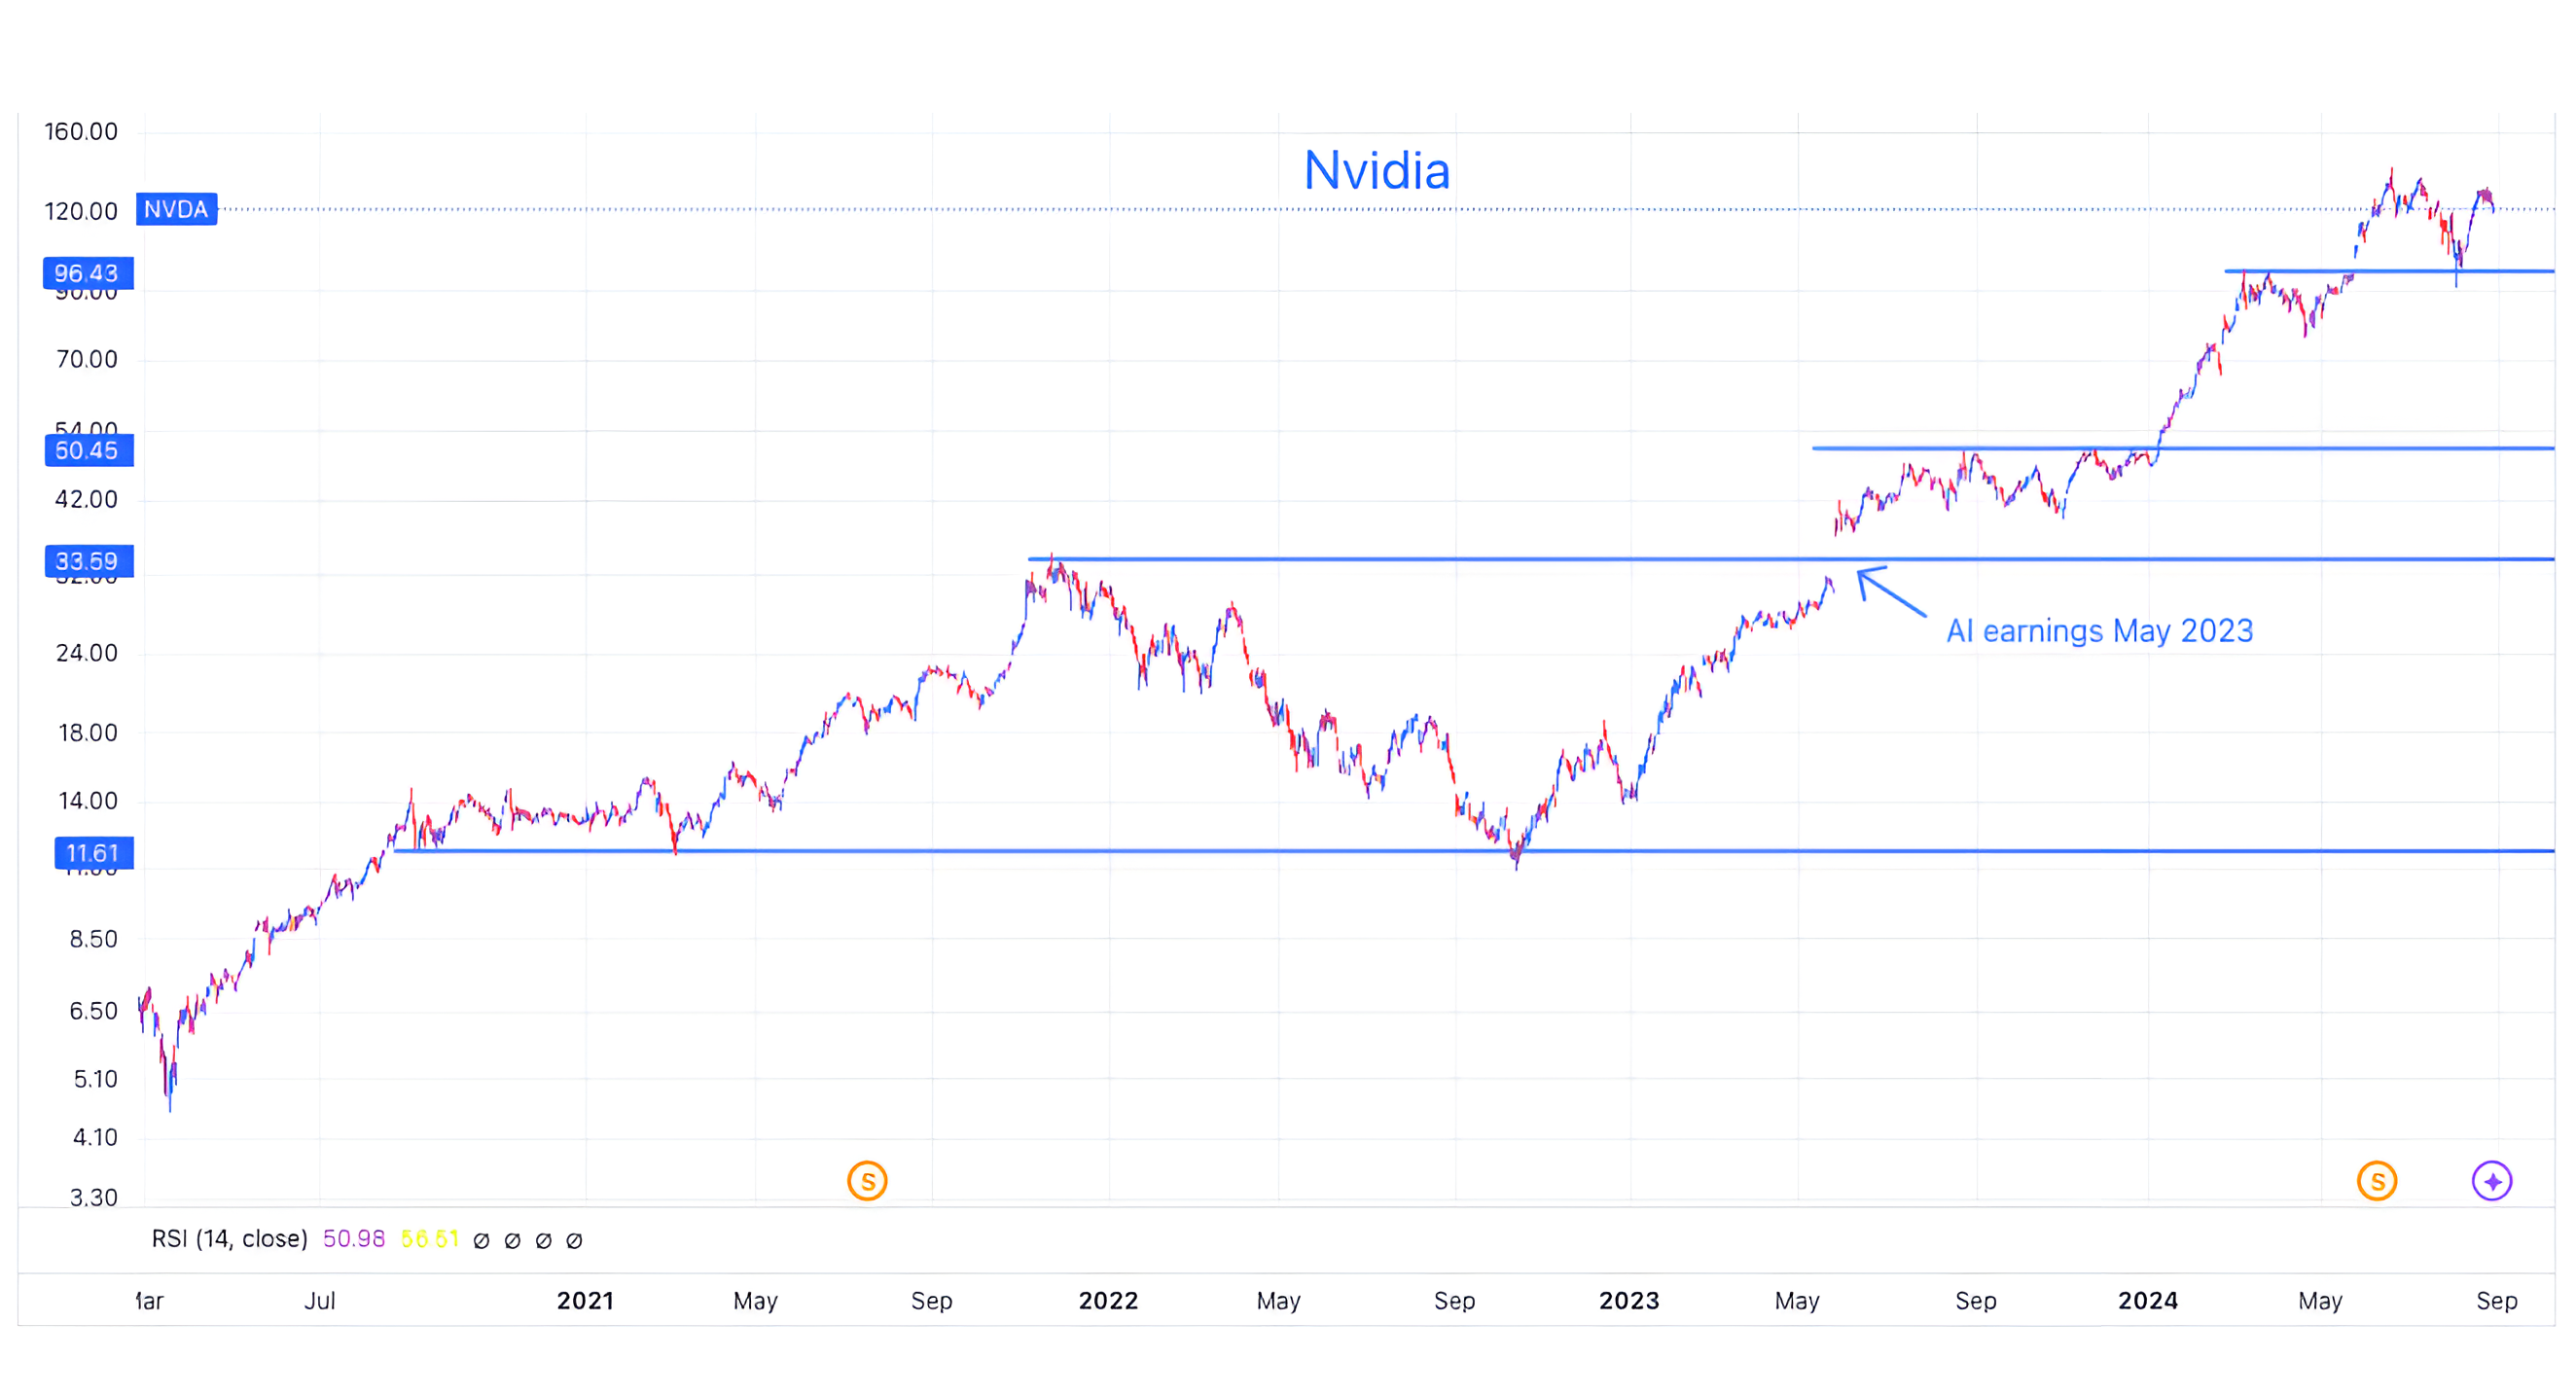
Source: Trading View. Through year-to-date 2024.
The chart above shows Nvidia share price since March 2020.
This is not a recommendation to buy or sell Nvidia shares, rather this is a summary of Wall Street opinions after Nvidia’s results were released last night:
Bank of America (Buy, PT: $165): "NVIDIA delivered a solid Q2 with sales of $30bn, but the Q3 outlook is modestly ahead of consensus and below more bullish expectations, largely due to a Blackwell ramp pushed out by a quarter. We continue to believe in NVIDIA's growth opportunity as generative AI deployments are just beginning, with next-gen AI models requiring significantly more compute power. We see compelling valuation and maintain our Buy rating."
Piper Sandler (Overweight, PT: $140): "We view NVIDIA’s pullback post-Q2 as a buying opportunity. Fundamentals are solid, and despite some margin compression, the company is well-positioned to capitalize on strong AI demand with Hopper and Blackwell. Gross margins are expected to stabilize, supporting continued growth."
Cantor Fitzgerald (Overweight, PT: $175): "Despite concerns around Blackwell delays, NVIDIA posted a solid report, exceeding guidance with a $2B beat and projecting $2.5B Q/Q growth into Q3. With 'several billion dollars' expected from Blackwell in Q4, concerns over delays are minimal. Gross margin guidance remains in the mid-70s, though slightly below Street expectations, but should improve with higher ASPs and growth. The AI story for NVIDIA remains strong, and we see this pullback as a buying opportunity."
JPMorgan (Overweight, PT: $155): "NVIDIA's July results beat consensus on revenue, gross margins, and EPS, though slightly below market expectations. The company guided to an 8% Q/Q revenue increase for October, supported by strong AI demand and continued spending on Hopper H100 and H200 GPUs. Despite a 2-month delay in Blackwell GPU shipments due to a mask change, we see no impact on the overall revenue profile for CY24/CY25, as the delay is offset by Hopper's strong performance. We expect gross margins to improve throughout next year, with NVIDIA maintaining a strong lead over competitors with its aggressive product launch cadence."
KeyBanc (Overweight, PT: $180): "NVIDIA's Q2 results exceeded consensus, but fell short of buyside expectations, partly due to the Blackwell delay. The company confirmed a delay but noted customer samples have shipped, with 'several' billion in Blackwell revenue anticipated in Q4. Hopper revenues are expected to grow in the second half, and while gross margins are guided slightly lower, NVIDIA's leadership in generative AI remains clear."
Goldman Sachs (Conviction Buy, PT: $135): "Despite lower-than-expected gross margin guidance, NVIDIA’s data center revenue opportunity across cloud, consumer internet, and enterprise customers remains strong. With a re-design of the Blackwell GPU, management expects several billion dollars in revenue in FY4Q, supported by growing Hopper revenue. We maintain our Buy rating, confident in NVIDIA's positioning in AI and accelerated computing."
Summit Insights (Buy): "The gross margin outlook for NVIDIA's October and January quarters is disappointing due to a mask step change on the upcoming 'Blackwell' GPU, creating near-term uncertainty in gross margin and topline performance. However, we anticipate the transition from 'Hopper' to the new 'Blackwell' will be resolved by early 2025, with NVDA selling off all low-margin existing mask steps in the next two quarters. We expect outperformance to re-accelerate in FY26."
Jefferies (Buy, PT: $150): "While NVIDIA's beat fell short of elevated expectations, Blackwell delay concerns are now behind us, and Hopper demand remains strong. The guidance beat of $32.5B was slightly below investor expectations, but the company is on track with several billion dollars of Blackwell revenue expected in Q4. The story is back on track, and the recent pullback is an opportunity for investors."
Citi (Buy, PT: $150): "NVIDIA's results showed strong performance with Jul-Q sales at the high end and confidence in the Blackwell ramp. Despite a lower gross margin outlook due to product mix, we expect a strong revenue and margin recovery in Q1 as Blackwell launches. AI adoption is still early, and we maintain our Buy rating on NVIDIA’s long-term potential."
Stifel (Buy, PT: $165): "NVIDIA's results and guidance were strong, particularly in data center compute platforms. The company addressed Blackwell delay concerns with a mask change to improve yields, and expects significant revenue contributions starting in F4Q. While near-term margins may be affected, we believe NVIDIA is well-positioned for future growth and maintain our Buy rating."
Mizuho (Outperform, PT: $140): "NVIDIA's Oct Q guidance was strong, driven by Hopper ramps and robust data center growth. Despite some pullback due to a slight miss on expectations, we see continued strength in AI server demand and expect NVIDIA to benefit from growing AI infrastructure needs. We maintain our Outperform rating and raise our PT."
Wells Fargo (Overweight, PT: $165): "Despite some concerns over Blackwell delay, NVIDIA's outlook remains strong with continued growth in data center and AI segments. We maintain our OW rating, confident in the company’s strategic positioning and product roadmap."
Bernstein SocGen Group (Outperform, PT: $155): "NVIDIA continues to deliver amidst high expectations with strong data center growth and several billion dollars of Blackwell revenue expected in Q4. Hopper demand remains strong, and we anticipate significant growth next year driven by diversified customers and expanding AI opportunities."
Oppenheimer (Outperform, PT: $150): "NVIDIA reported strong results with data center demand leading the upside. Blackwell delays are minimal, and the company is on track for a production ramp in F4Q. We see NVIDIA as best positioned in AI, benefiting from its hardware and software stack and reiterate our Outperform rating."
Edward Jones (Hold): "NVIDIA remains the leader in high-performance GPUs and commands a 90% market share in data centers for accelerator chips. Management has positioned the company well in the generative AI market, but with expectations so high, it will be challenging to continually exceed them. We believe the stock already reflects an optimistic growth outlook and is appropriately valued."
DA Davidson (Neutral, PT: $90): "NVIDIA reported strong revenue growth driven by Data Center, but we remain cautious due to potential headwinds from AI infrastructure build-out cycles and the Blackwell delay. While the company is well-positioned, our FY25 estimates remain below consensus, and we model a sequential decline in FY26, maintaining our Neutral rating."
(Past performance is not indicative of future results. This is not a recommendation to buy or sell any security and is not investment advice. Please do your own due diligence).
4. The Macro has Hardly Moved Since the S&P 500 Low
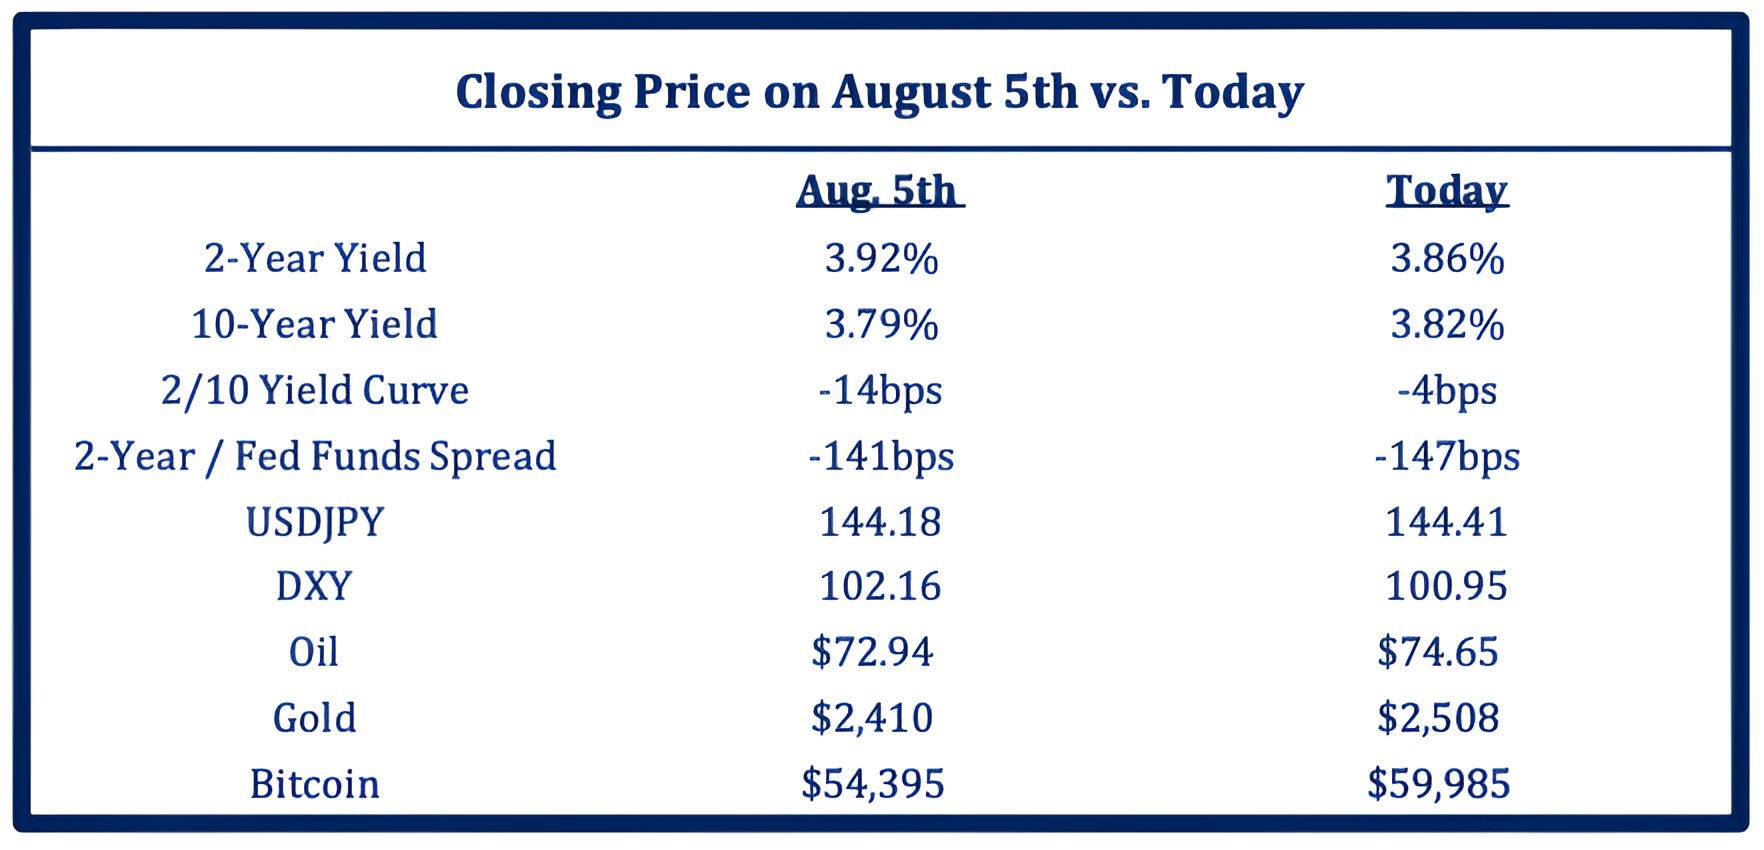
Source: Strategas. Through year-to-date 2024.
The chart above shows the closing prices of a number of macro indicators since the August 5th low in the S&P 500.
While the S&P 500 has recovered all of its losses and is trading near its mid-July all-time high, the macro-environment has hardly moved since the low.
With respect to some of the indicators in the chart above, Chris Verrone from Strategas (one of the best in the business in my opinion) asked:
“The spread between the 2-year yield and the effective Fed Funds rate is more extreme today (-147 bps) than it was then (-141 bps) – so is the market’s message that nothing has happened in the last 3 weeks to remove the urgency of recalibrating policy quickly?
To the extent crypto reflects the market’s expression of liquidity conditions, why has it not been able to return with any consistency?
Meanwhile, Gold has been strong as the $ has broadly weakened. And if this all began with the Yen carry breaking, isn’t it important that USDJPY hasn’t bounced – 144 then vs. 144 today?”
In addition to the macro indicators above, we would also note that since August 5, next 12 months S&P 500 earnings expectations have come down from $259.77 to $258.79. While this is only a slight reduction, in our view, it is not a positive.
(Past performance is not indicative of future results. This is not a recommendation to buy or sell any security and is not investment advice. Please do your own due diligence).
5. An Impressive Recovery!

Source: Trading View. Through year-to-date 2024.
The chart above shows the MSCI All Country World ex-US ETF (ticker: ACWX).
Unlike the S&P 500 which remains slightly below its mid-July high (less than 1%), the MSCI All Country World ex-US ETF has surpassed it mid-July peak and achieved a new 52-week high.
One other interesting characteristic to note on this chart, the August 5th low was exactly at the pre-covid high (top horizontal blue line).
Remember, this is an index that includes representation from 46 countries, multiple currencies and over 2000 shares.
Clearly, the pre-covid high has been a battleground area with several trips to the level from both above and below, but we find the bounce off the line on August 5th pretty amazing!
Also of note - the MSCI All Country World ex-US has outperformed the S&P 500 by 3% over the last 10 weeks (since mid-June).
However, this near-term outperformance has NOT triggered a change in trend of the long-term S&P 500 outperformance (since 2009). (We will show the relative chart once again in the upcoming weeks).
In other words, for global investors, we continue to favor US equities.
(Past performance is not indicative of future results. This is not a recommendation to buy or sell any security, please do your own research).