


Wake Me Up When September Ends...
As investors attempt to gage the strength of the economy and price in the upcoming Fed decision, each day in US equity markets is volatile. In our view, it reflects indecision. Let's dig in...
We continue to monitor question the strength of the US economy.
Is there an upcoming recession, is the US already in a recession or will the Fed achieve a soft landing?
Although the economy anecdotally seems like it is continuing to grow - flights are full and restaurant reservations hard to get, there are recessionary indicators that can not be ignored - the yield curve seems to be uninverting, oil has been falling and the Sahm rule has been triggered (see chart 4).
Some have argued that the Fed is not doing enough and is behind the curve, not cutting enough or too late while others believe that, similar to the 1970s, US inflation is in hibernation and set to come back.
The major US equity indexes - the S&P 500 and the Nasdaq 100 (we showed on Tuesday here) - are each in the middle of recent ceilings and floors - an area I call “no man’s land.” The Russell 2000 Small Cap Index (chart 1 below) is at an indecision level.
The second half of September, as we showed in chart 4 here, is the weakest half month in the US equity calendar. This year, the period coincides with what Dan Clifton from Strategas has characterized as a “liquidity drain” that he is expecting to take place from September 14-October 1st. (see chart 2 here).
Add in the unique crazy US Presidential election which seems hard to predict (at best) but will have major economic implications and we are left with a lot to digest and price in.
Wake me when September Ends!

1. US Small Caps Peaked Six Weeks Ago
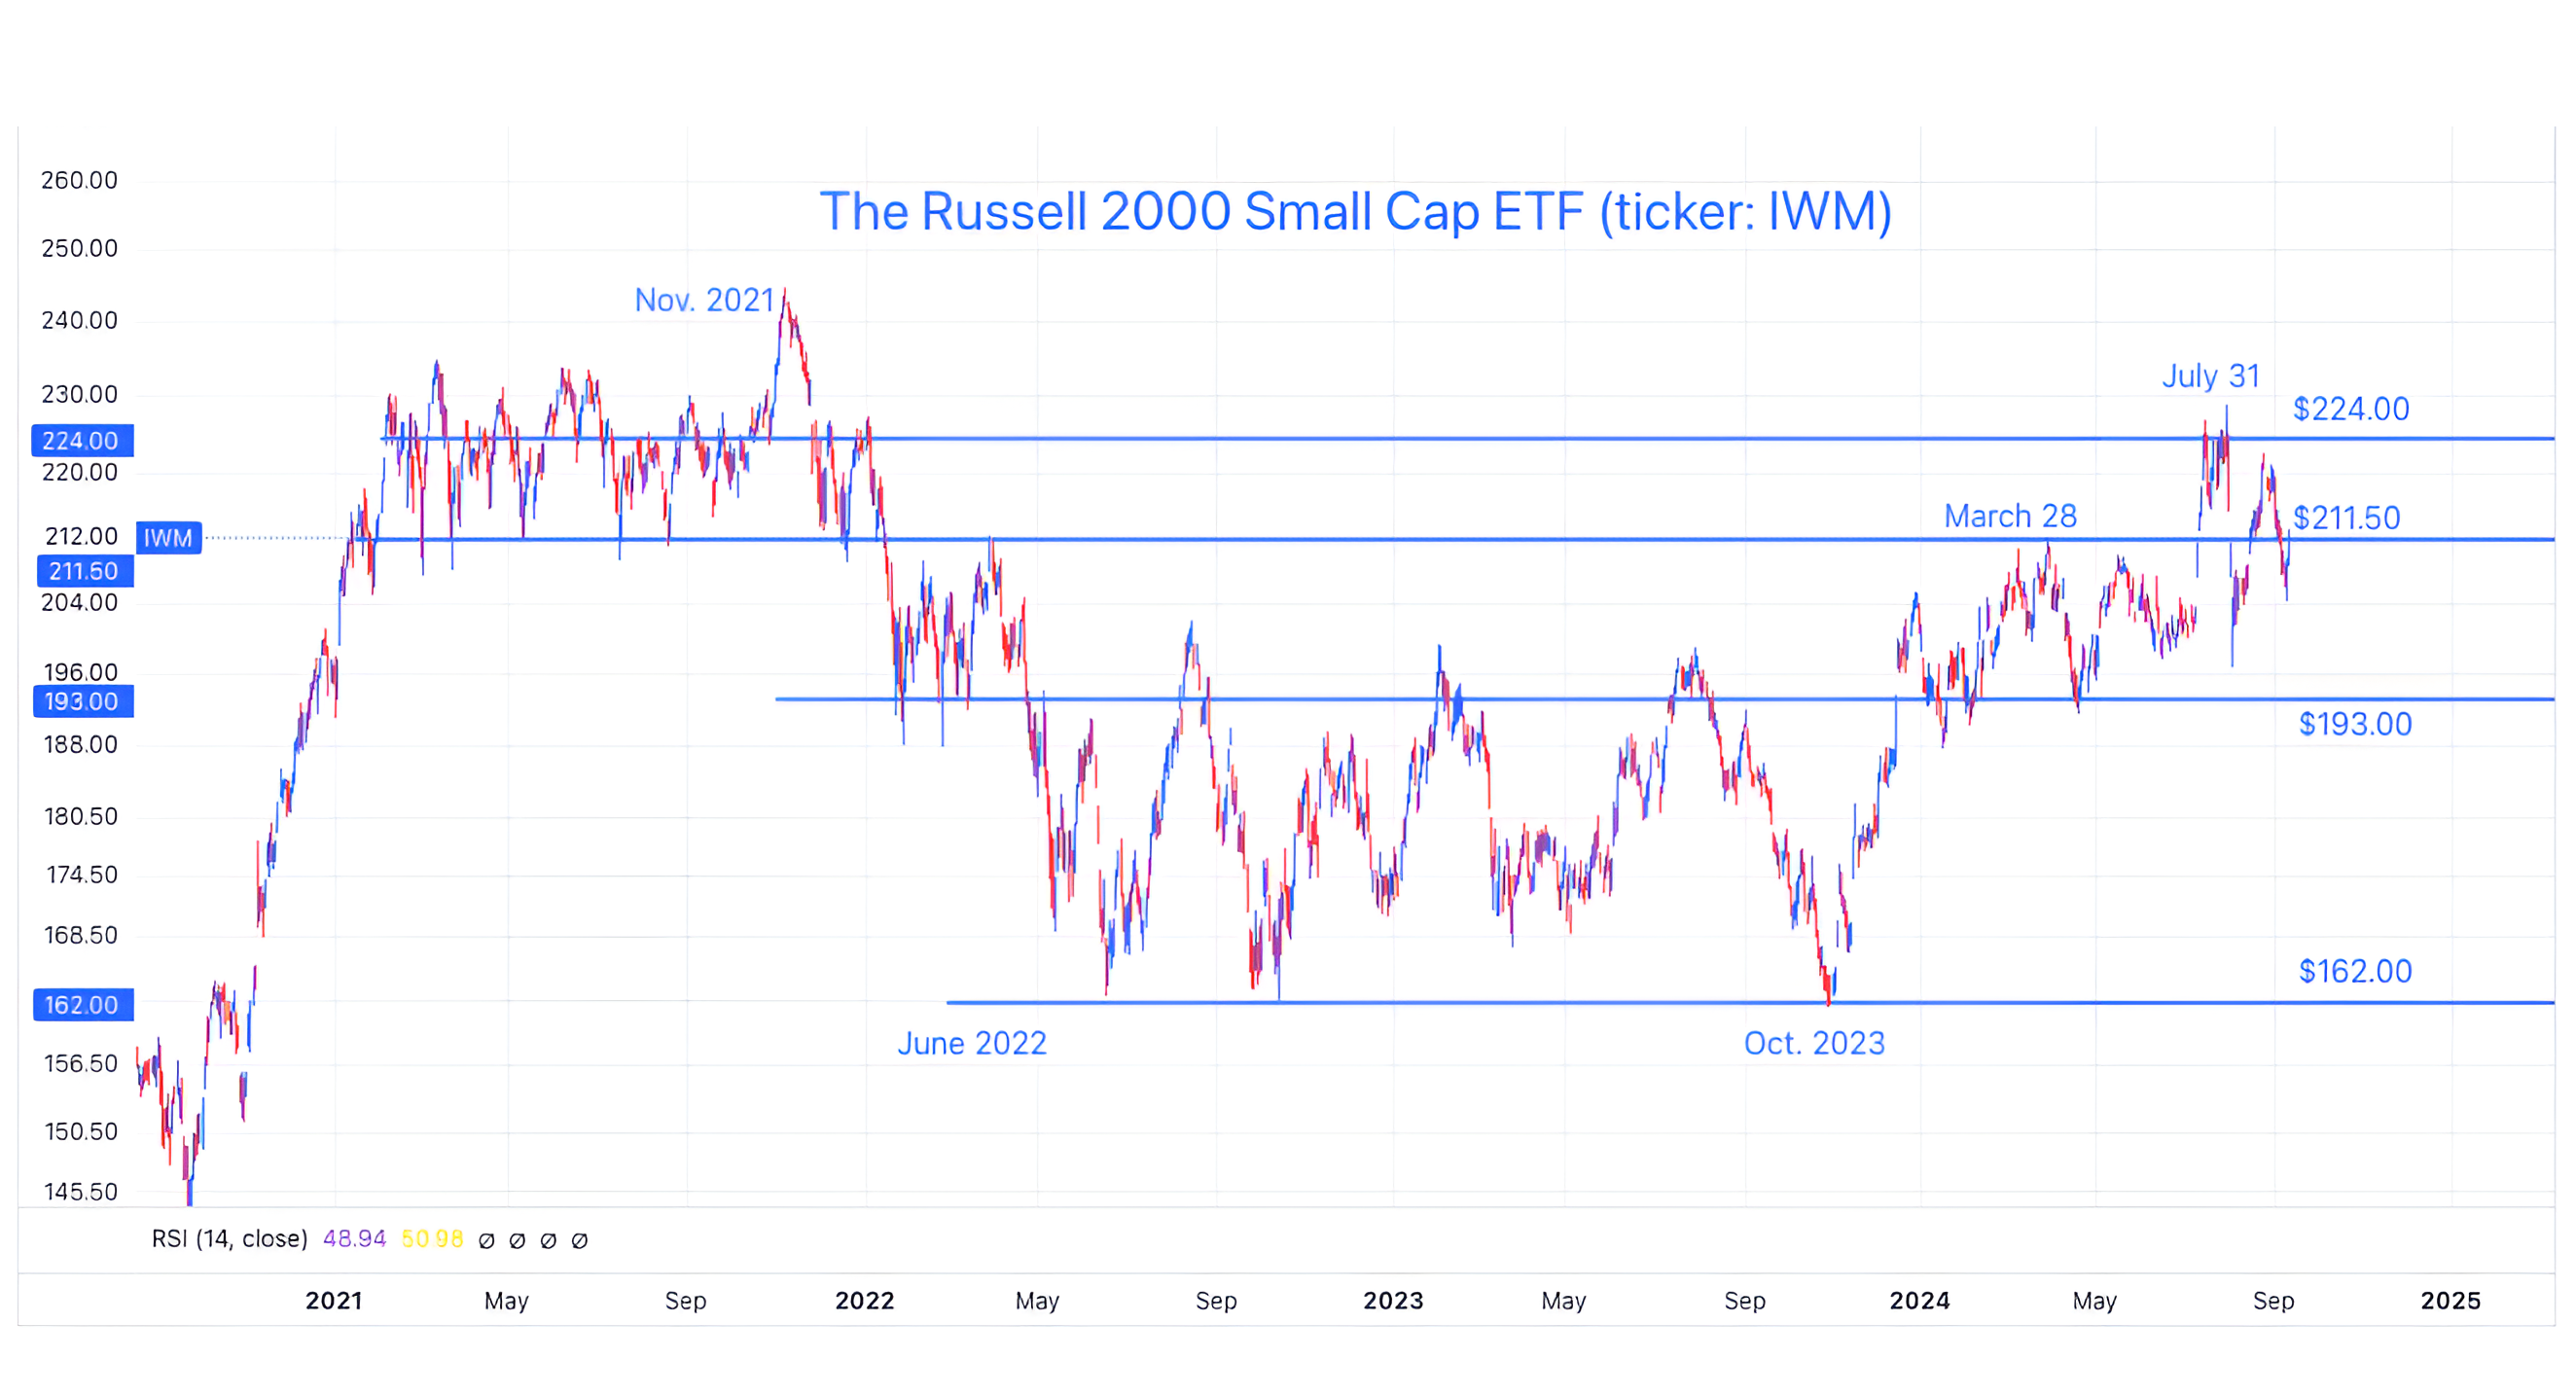
Source: Trading View. Through year-to-date 2024.
The chart above shows the Russell 2000 US Small Cap ETF (ticker: IWM).
In our view, Small Caps are more economically sensitive and more levered to the domestic (rather than the global) economy than their larger-cap cousins.
The last time we showed this chart (here) was nearly a month ago.
At the time, we wrote, “When Small Caps rallied in July, it was a sign of a soft-landing as well as a cyclical rotation within equity markets.”
Since that time, the Fed rate cut cycle has transitioned from a likelihood to a near certainty and the announcement is expected within the next week.
However, find it notable that the Small Caps have not been able to recapture their late July peak and have made a series of lower highs and higher lows.
Are the Small Caps questioning whether the rate cuts are occurring too late or that the consensus expectation of a 25 basis point cut (rather than 50) is not enough?
In other words, in our view, the action in the Small Caps may be another way that equity investors are questioning the strength in the economy (along with the Consumer Staples vs. Consumer Discretionary relationship that we showed in chart 2 here and the Utilities sector that we showed in chart 3 here).
In observing the chart of the Russell 2000 US Small Cap ETF, it may be that the $211.50 neighborhood may be the judgement line.
A move sustainably above, could be an indication of an economic “all-clear” signal, while a meaningful drop below could be cause for concern.
We will continue to watch.
(This is not a recommendation to buy or sell any security and is not investment advice. Please do your own research and due diligence).
2. AI Disruption in Software as a Service (SAAS)
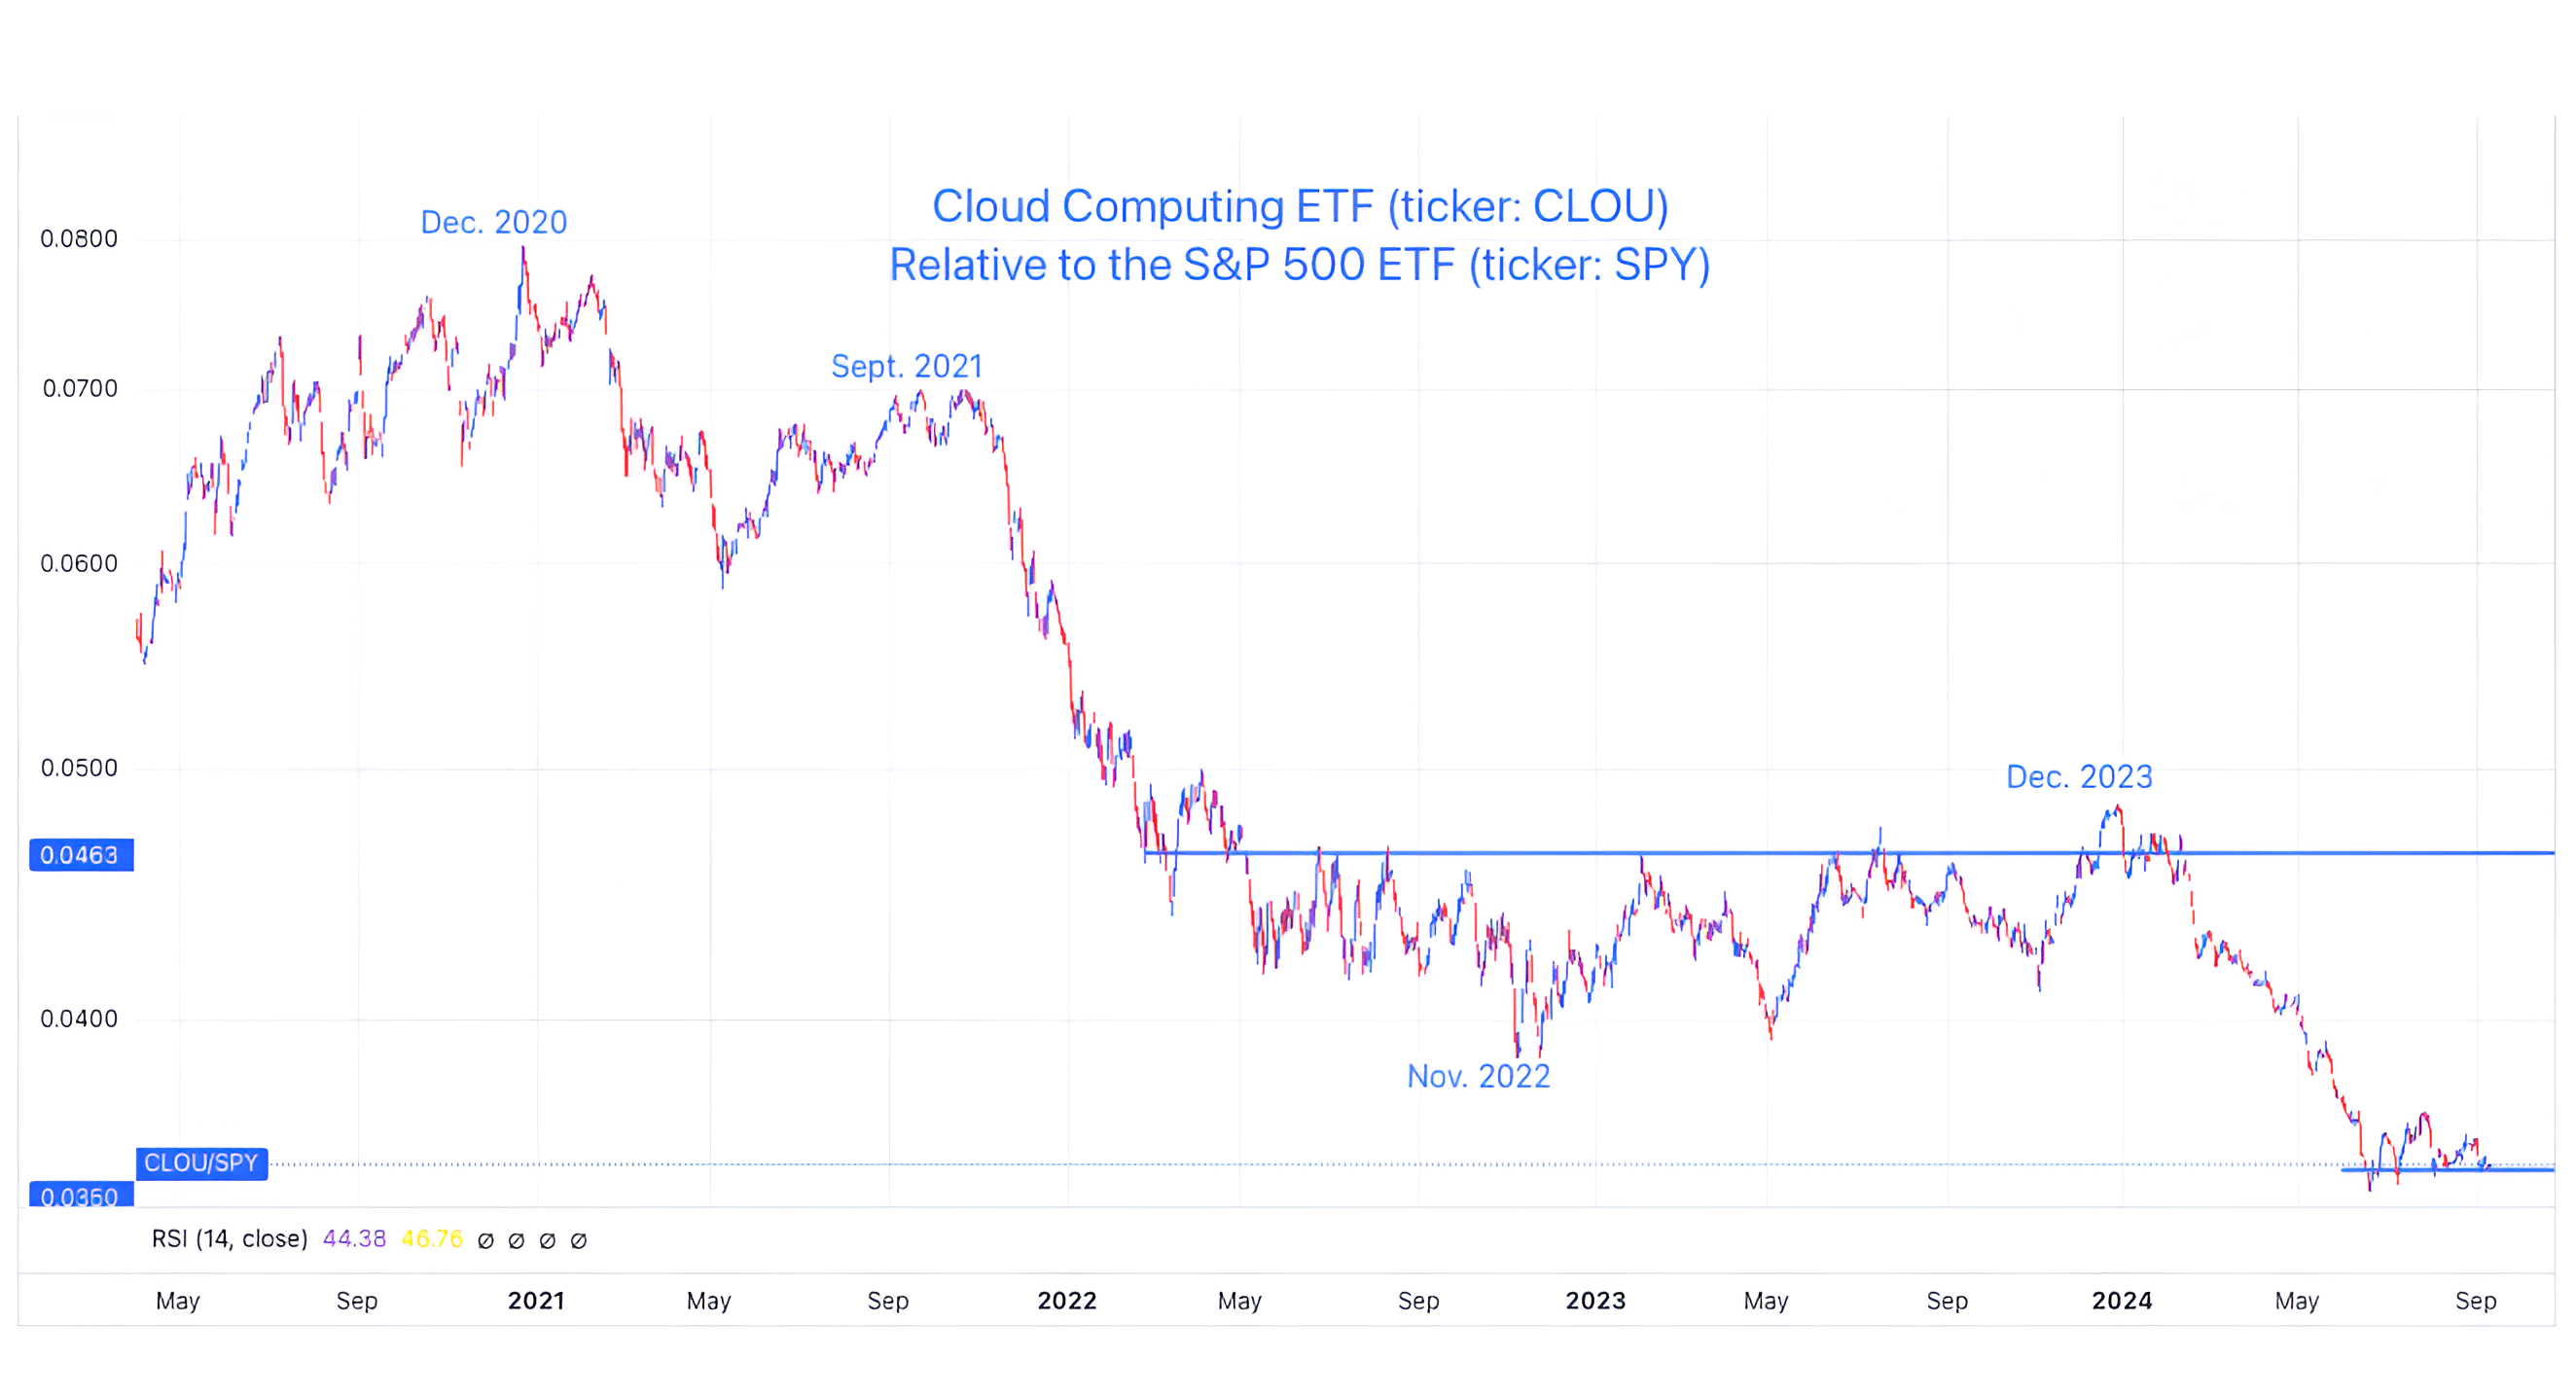
Source: Bloomberg. Through year-to-date 2024.
The chart above shows the Cloud Computing ETF (ticker: CLOU) relative to the S&P 500 ETF (ticker: SPY).
Although it is called the Cloud ETF, it includes a very high weighting to Software as a Service (SaaS) companies including Zoom Video, Dropbox and Workday.
Recently, the CEO of Klarna, a leading Swedish fintech company, said:
“There are large ongoing internal initiatives that are a combination of AI, standardization, and simplification.
As an example, we just shut down Salesforce. Within a few weeks, we will shut down Workday.
We are shutting down a lot of our SaaS providers, as we are able to consolidate."
In addition, in the introduction here, we cited Doug McMillen, the CEO of Walmart , who said:
“We're leveraging data and large language models from others and building our own… We've used multiple large language models to accurately create or improve over 850 million pieces of data in the catalog.
Without the use of generative AI, this work would have required nearly 100x the current headcount to complete in the same amount of time.”
Software as a Service was a trendy investment from from 2018 - 2020 as the services they provided were considered “must have” efficiency tools and cost savers for large organizations.
SaaS companies were funded by VCs and collected at any price or valuation (some at over 20x next 12 months sales) by growth-oriented hedge funds .
In September 2021, with the expectation that Fed tightening was coming, the multiples began to contract and SaaS shares began to underperform.
More recently (December 2023), despite an upcoming Fed easing cycle, it seems under-performance may have been driven by AI disruption and the resulting slowing growth.
While we don’t want to over-extrapolate, clearly AI is being implemented by several businesses.
On Tuesday, we were highlighting that there was no “killer app” in AI.
Maybe we were overly-focused on the consumer, as large institutions are experimenting with and using AI in very specific ways.
Perhaps the difference between what we were considering and what is actually happening is that we were looking for AI to be a revenue driver, whereas, right now, it may be an expense saver / disruptor.
Earlier this week, Larry Ellison, the founder of Oracle said:
“We have 162 data centers now. I expect we will have 1,000 or 2,000 or more data centers -- Oracle cloud data centers around the world, and a lot of them will be dedicated to individual banks or telecommunications companies or technology companies or what have you, or nation states, sovereign clouds, all of this other stuff."
The current investment in AI may continue to be in hardware (semiconductors selectively), data centers and the peripherals for each.
Re-reading the analysts reaction to Nvidia’s earnings in chart 3 here and what we wrote with respect to software vs. hardware in chart 2 here - this view is consistent.
(Past performance is not indicative of further results. This is not a recommendation to buy or sell any security and is not investment advice. Please do your own due diligence).
3. We Continue to Think Earnings Growth Expectations for 2025 Are Too High. Will it Matter?

Source: FactSet; Luminos Advisors. Through year-to-date 2024.
The chart above shows S&P 500 actual (dark blue) and expected (light blue) earnings growth.
It does not take a savvy statistician or lynx-eyed chart reader to recognize the acceleration in earnings growth that analysts are expecting beginning in Q4 2024 and continuing throughout 2025.
We have been citing our concerns with 2nd half of 2024 and full-year 2025 earnings growth and expectations consistently for some time (most recently chart 3 here and charts 2, 3 and 4 here).
We are now nearing the point where are concern is going to clash with reality.
While Q2 earnings were strong, Q3 earnings are already being trimmed.
It should be noted that some of the strength in Q2 was driven by one-time factors such as a significant gain in JP Morgan earnings from an investment in Visa.
We don’t see one-off factors as a consistent driver of earnings growth over the next five quarters.
With the S&P 500 trading at 21.5x next 12 months earnings, which is in the top decile of valuation for the past 25 years, any slowdown in earnings growth could lead to multiple compression.
As we always write with respect to valuation, it is not a catalyst - an expensive market will not automatically fall - but it is a measure of risk and fragility.
While we continue to participate in the market, we recognize the heightened risk based on aggressive earnings assumptions and premium valuation.
As always, rather than over-anticipate a sell-off, we will continue to use the charts as a guide.
(Past performance is not indicative of future results. This is not a recommendation to buy or sell any security and is not investment advice. Please do your own due diligence).
4. The Sahm Rule that Relates Employment to Recessions has Triggered

Source: Federal Reserve of St. Louis “FRED”. Through year-to-date 2024.
The chart above shows the three-month moving average of the US unemployment rate.
Over the past 70 years, in a relationship identified by the economist Claudia Sahm and now called the Sahm rule, when the three-month moving average of the US unemployment rate is at least half a percentage point (0.5%) higher than the 12-month low, than the US is or will be soon in a recession (grey shaded areas).
We last highlighted the Sahm rule at the beginning of August in chart 3 here. At the time, we noted that while many thought the Sahm rule had triggered, technically it had not.
With last Friday’s employment report, the three-month moving average of the US unemployment rate moved to 0.57 and the rule has now “officially” triggered.
Goldman Sachs recently published a study of the increases in the three-month moving average of the local unemployment rates across many different economies and concluded that in isolation, a triggering of the Sahm rule was not enough to predict a recession.
Other measures, according to Goldman Sachs, had to be flashing recession for the Sahm rule to be meaningful.
They concluded by showing that the other measures that typically coincide with the Sahm rule to indicate a recession are not currently evident within the US economy.
We will see.
(Past performance is not indicative of future results. This is not a recommendation to buy or sell any security and is not investment advice. Please do your own due diligence).
5. Yesterday’s Action Was a Positive “Signal,” But More Mixed than Some Others that We’ve Shown
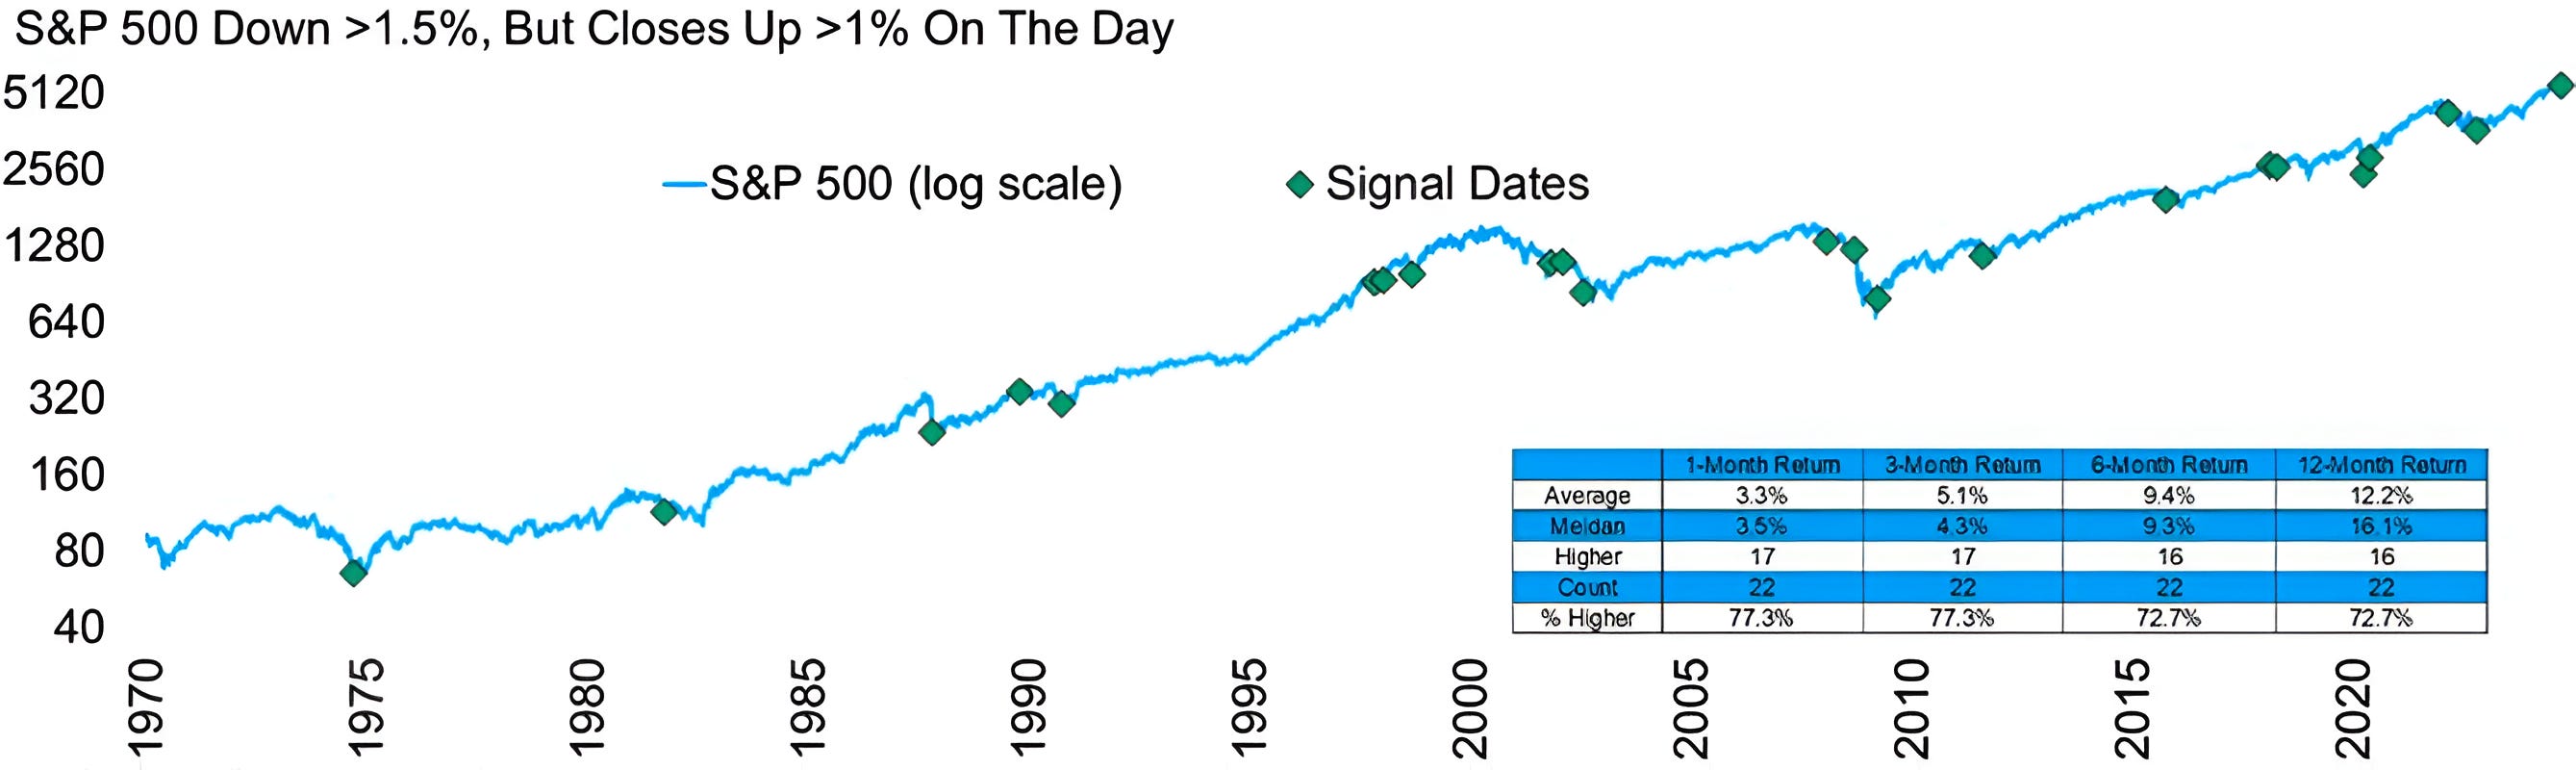
Source: Carson Investment Research / Ryan Detrick. Through year-to-date 2024.
Yesterday morning, the S&P 500 was down more than 1.5%, but it closed the day up over 1%.
This type of intra-day action has occurred 22 times in the past 54 years and the results, while strong on average, are a bit more mixed than I would expect.
The average 12-month return after this signal has been 12% which is higher than the average 12-month return for the S&P 500.
Historically, 16 of the 22 signals have preceded positive one-year S&P 500 performance.
Looking at the chart closely, this signal has often been a characteristic of “capitulation” at the end of a sell-off. We saw this in 1975, 1987, 1992, 2002, 2009, 2020 and 2022.
Given that the market has been trending higher (the S&P 500 is not near a low for the period), if we consider the “non-capitulation” times that this signal has been triggered, the one year positivity “hit rate” is 60%.
This is below the average one year positivity rate of the S&P 500 of around 65%.
While we have shown several similar charts that have been associated with equity market strength in the year ahead, in our view, this one has a much more mixed track record.
(Past performance is not indicative of future results. This is not a recommendation to buy or sell any security, please do your own research).