


Misty Mountain Hop
The Nasdaq 100 has hit our target while the Equal Weight S&P 500 is back to its recent peak. While these are likely places to pause, we want to consider what may be next. Let's dig in...
First, today’s title is not a typo - the song Misty Mountain Hop (not top) is from Led Zeppelin.
According to Led Zeppelin lead singer, Robert Plant, the song is “about the problems you can come across when you have a simple walk in the park on a nice sunny afternoon.”
Well, US equity markets have been enjoying a nice walk on a sunny afternoon for the last two weeks, we will see if they come across any problems…
The picture below is of the line of people waiting to officially summit Mt. Everest.
Hitting a peak is a theme of ours today, and like so many things, the crowds (and garbage at base camp) on Mt. Everest fascinate us!

Photo Credit: Project Possible / Facebook; Outside.com
1. Nearing Its Peak: the Nasdaq 100

Source: Trading View. Through year-to-date 2024.
The chart above is the Nasdaq 100 ETF (ticker: QQQ).
We have been showing this consistently (most recently here, but also, here, here, here and here) through the early August equity market sell-off and subsequent recovery.
When we last showed the chart, we titled it “A Potentially Bullish Scenario for the Nasdaq 100 ETF) and wrote:
“What we see potentially developing now is a bullish “head and shoulders” pattern (the 3 inverted arcs on the right side of the chart).
If this were to be triggered / confirmed, in our view, the measured target would be around $530.”
The Nasdaq 100 ETF looks to be reversing right in the $475 neighborhood that we cited when we identified the potential bullish “head and shoulders” pattern.
Given the chart of the S&P 500 that we showed on Tuesday (here) and the chart of the Equal Weight S&P 500 (chart 2 below) which have both reached recent peaks, we believe that that odds for a pause and more likely a retracement of a portion of the recent rally are high.
What would this mean?
It would mean that the right shoulder of a potentially bullish inverse “head and shoulders” pattern could be developing.
However, just because the right shoulder may be developing, that does not mean the pattern will completely form or be triggered.
Given our concern of fundamentals (see chart 3) and valuation (elevated / demanding) and what we wrote on Tuesday about a possible mid-September Treasury liquidity drain, it may be that any volatility that brings the Nasdaq 100 ETF to the trough of the right shoulder doesn’t end there.
That said, we’ve had concerns about fundamentals and valuations all year and neither has been a meaningful market driver. With respect to the Treasury liquidity drain, it may be sufficient that the Fed is likely to take the easing baton back even though rate cuts are often not considered to have an economic impact for 6-12 months.
We continue to keep an open mind, maintain some defense (put spreads in our portfolios) and consider a range of potential scenarios.
(This is not a recommendation to buy or sell any security and is not investment advice. Please do your own research and due diligence).
2. Back to Its Peak: The Equal Weight S&P 500
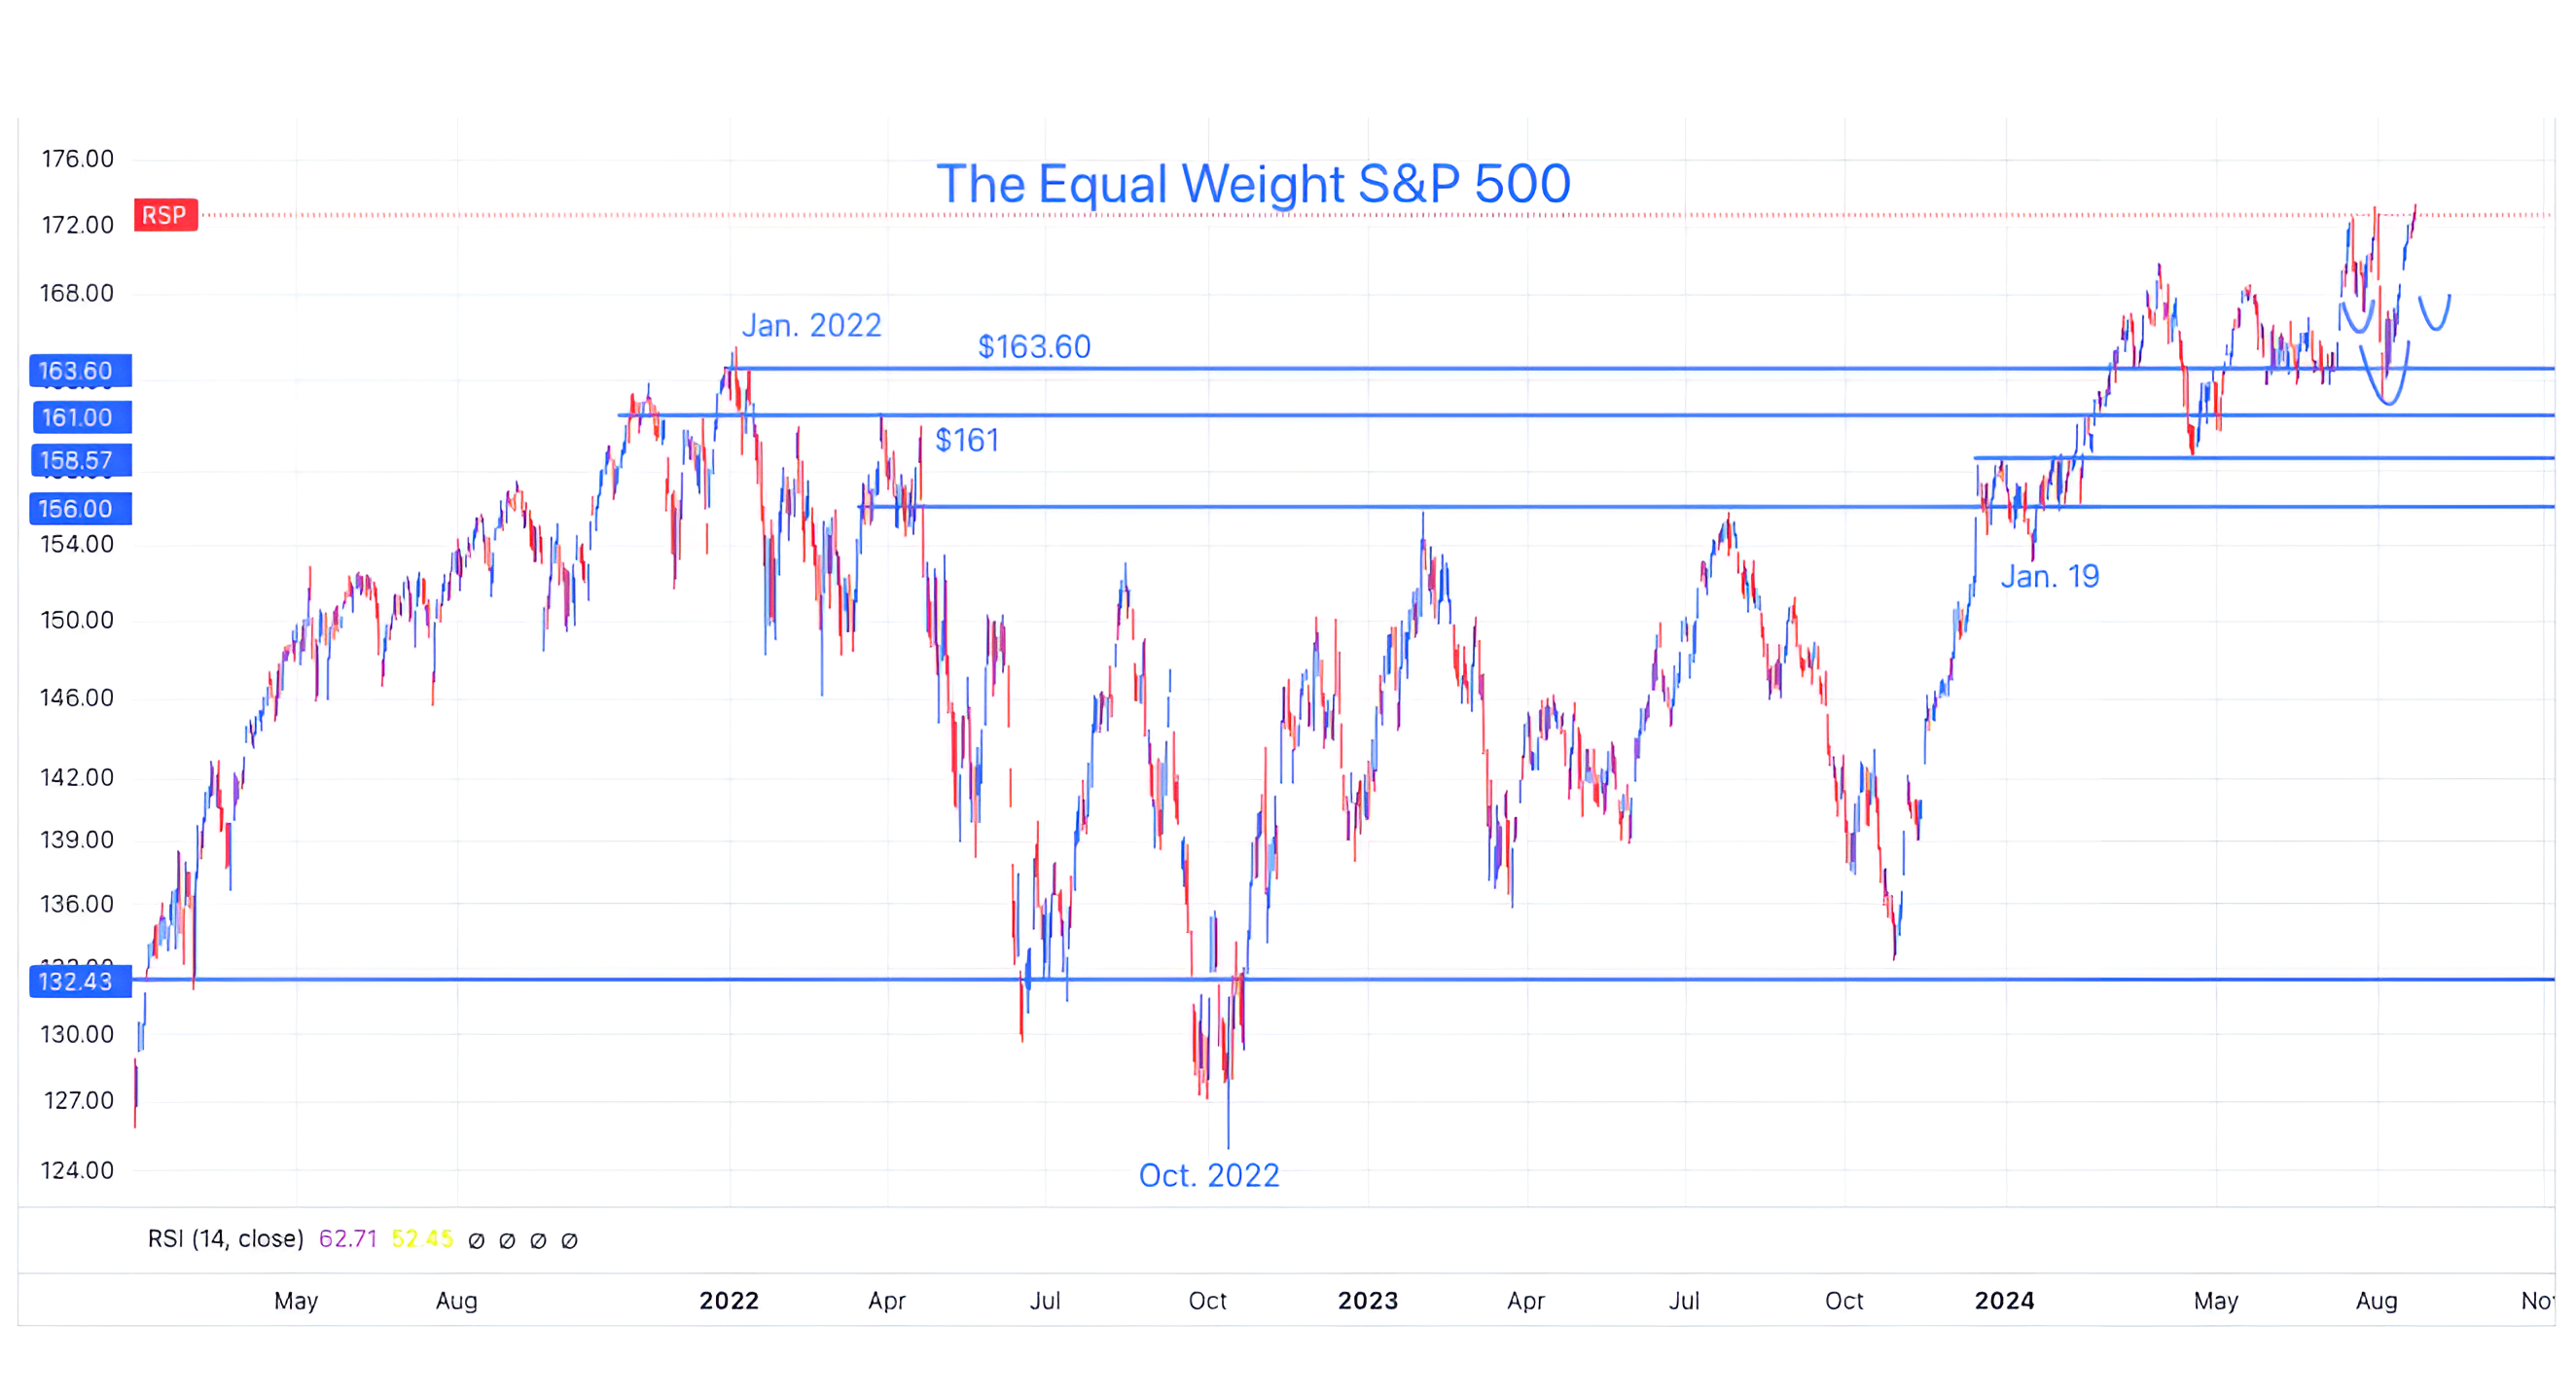
Source: Strategas. Through year-to-date 2024.
The chart above shows the Equal Weight S&P 500 ETF (ticker: RSP). We last showed this two weeks ago in chart 2 here.
At the time, the chart was inconclusive (the title of the report was “Bad Boys, Whatcha Gonna Do?”) and we admitted we had no edge (at that time) with our observations.
Since then, similar to the (market cap weighted / typical) S&P 500, the Equal Weight S&P 500 ETF has climbed back to its late July peak.
We showed the chart of the S&P 500 on Tuesday (here) and wrote:
“With the rally of the past two weeks, it may be that the Fed’s dovish statement [from Jackson Hole tomorrow], liquidity and the likely September cut have already been priced in.
Given the pace of the market’s ascent and the fact that it is once again at an important level where it has previously sold off, in our view, it is likely that at the very least, equities will pause (stop going up).
We expect a 3% sell-off over the next few weeks with the caveat that short-term calls in this market have been challenging.”
Looking at the chart of the Equal Weight S&P 500, it is easy to envision a pause scenario with a 3-4% sell-off.
If this were to occur, similar to the Nasdaq 100 ETF in chart 1, it may begin to look like the right shoulder of a bullish inverse “head and shoulders” pattern is developing. (We have drawn in the 3 arcs on the right side of the chart).
While it’s early to consider the bullish formation, it is something we’re watching (on both charts).
In the meantime, it is important to remember that the likely first part of the process is a move lower.
(Past performance is not indicative of further results. This is not a recommendation to buy or sell any security and is not investment advice. Please do your own due diligence).
3. Q3 Earnings Estimates…

Source: FactSet. Through year-to-date 2024.
The chart above shows the S&P 500 price (light blue line) and the Q3 2024 S&P 500 earnings estimate as they both have evolved from August 2023 to today.
Throughout the year, we have complained been concerned that S&P 500 earnings estimates are too high.
Our concern has been focused on the earnings for the second half of 2024 and for full year 2025.
In December 2023, when we would argue that analysts had limited visibility into Q3 2024 S&P 500 earnings, the expectation was that the S&P 500 would earn $64 during the quarter.
At the time, this represented 8.6% earnings growth.
Now, half way through the quarter (presumably with more visibility into operating performance) analysts are expecting $61.54 in earnings or 4.5% growth.
While companies may exceed current earnings expectations, given the valuation of 21.6x next 12 months earnings, which places the index in the top decile of forward valuation levels for the past 25 years (only exceeded during the dot-com bubble and the post-covid period), we continue to characterize the environment as fragile.
Furthermore, when look at Q4 earnings growth expectations of 15.7% (down from a peak of 17.5% two months ago) and the 15% earnings growth projection for 2025, we continue to question how these will be achieved and how the market will react, given the premium valuation, if there is disappointment.
(Past performance is not indicative of future results. This is not a recommendation to buy or sell any security and is not investment advice. Please do your own due diligence).
4. Non-Farm Payrolls Revision…

Source: Redfin based on MLS Data. Through year-to-date 2024.
The chart above shows sales of existing US homes, seasonally adjusted and annualized monthly.
It is easy to see the sales coming down in 2022 and 2023 as the Fed tightened monetary policy and mortgage rates moved higher.
This may also be a reflection of the softer jobs environment that we wrote about on Tuesday.
Regardless of the reason, sales of existing homes are an important economic driver.
As people sell their house, they pay taxes and brokers. They then often buy a new house (either newly built or existing) and fix it up and buy furniture. The person that buys the existing home also often fixes it up and buys furniture.
While Goldman Sachs has recently reduced the odds of a US recession from 25% to 20%, this type of soft data (along with the employment revision) may begin to be a concern for some.
On the other hand, as we wrote on Tuesday, homebuilders are continuing to do very well as they are able to offer clients below market financing levels and keep houses attractively priced (relative to existing homes).
(Past performance is not indicative of future results. This is not a recommendation to buy or sell any security and is not investment advice. Please do your own due diligence).
5. Entering a Soft Part of Election Years
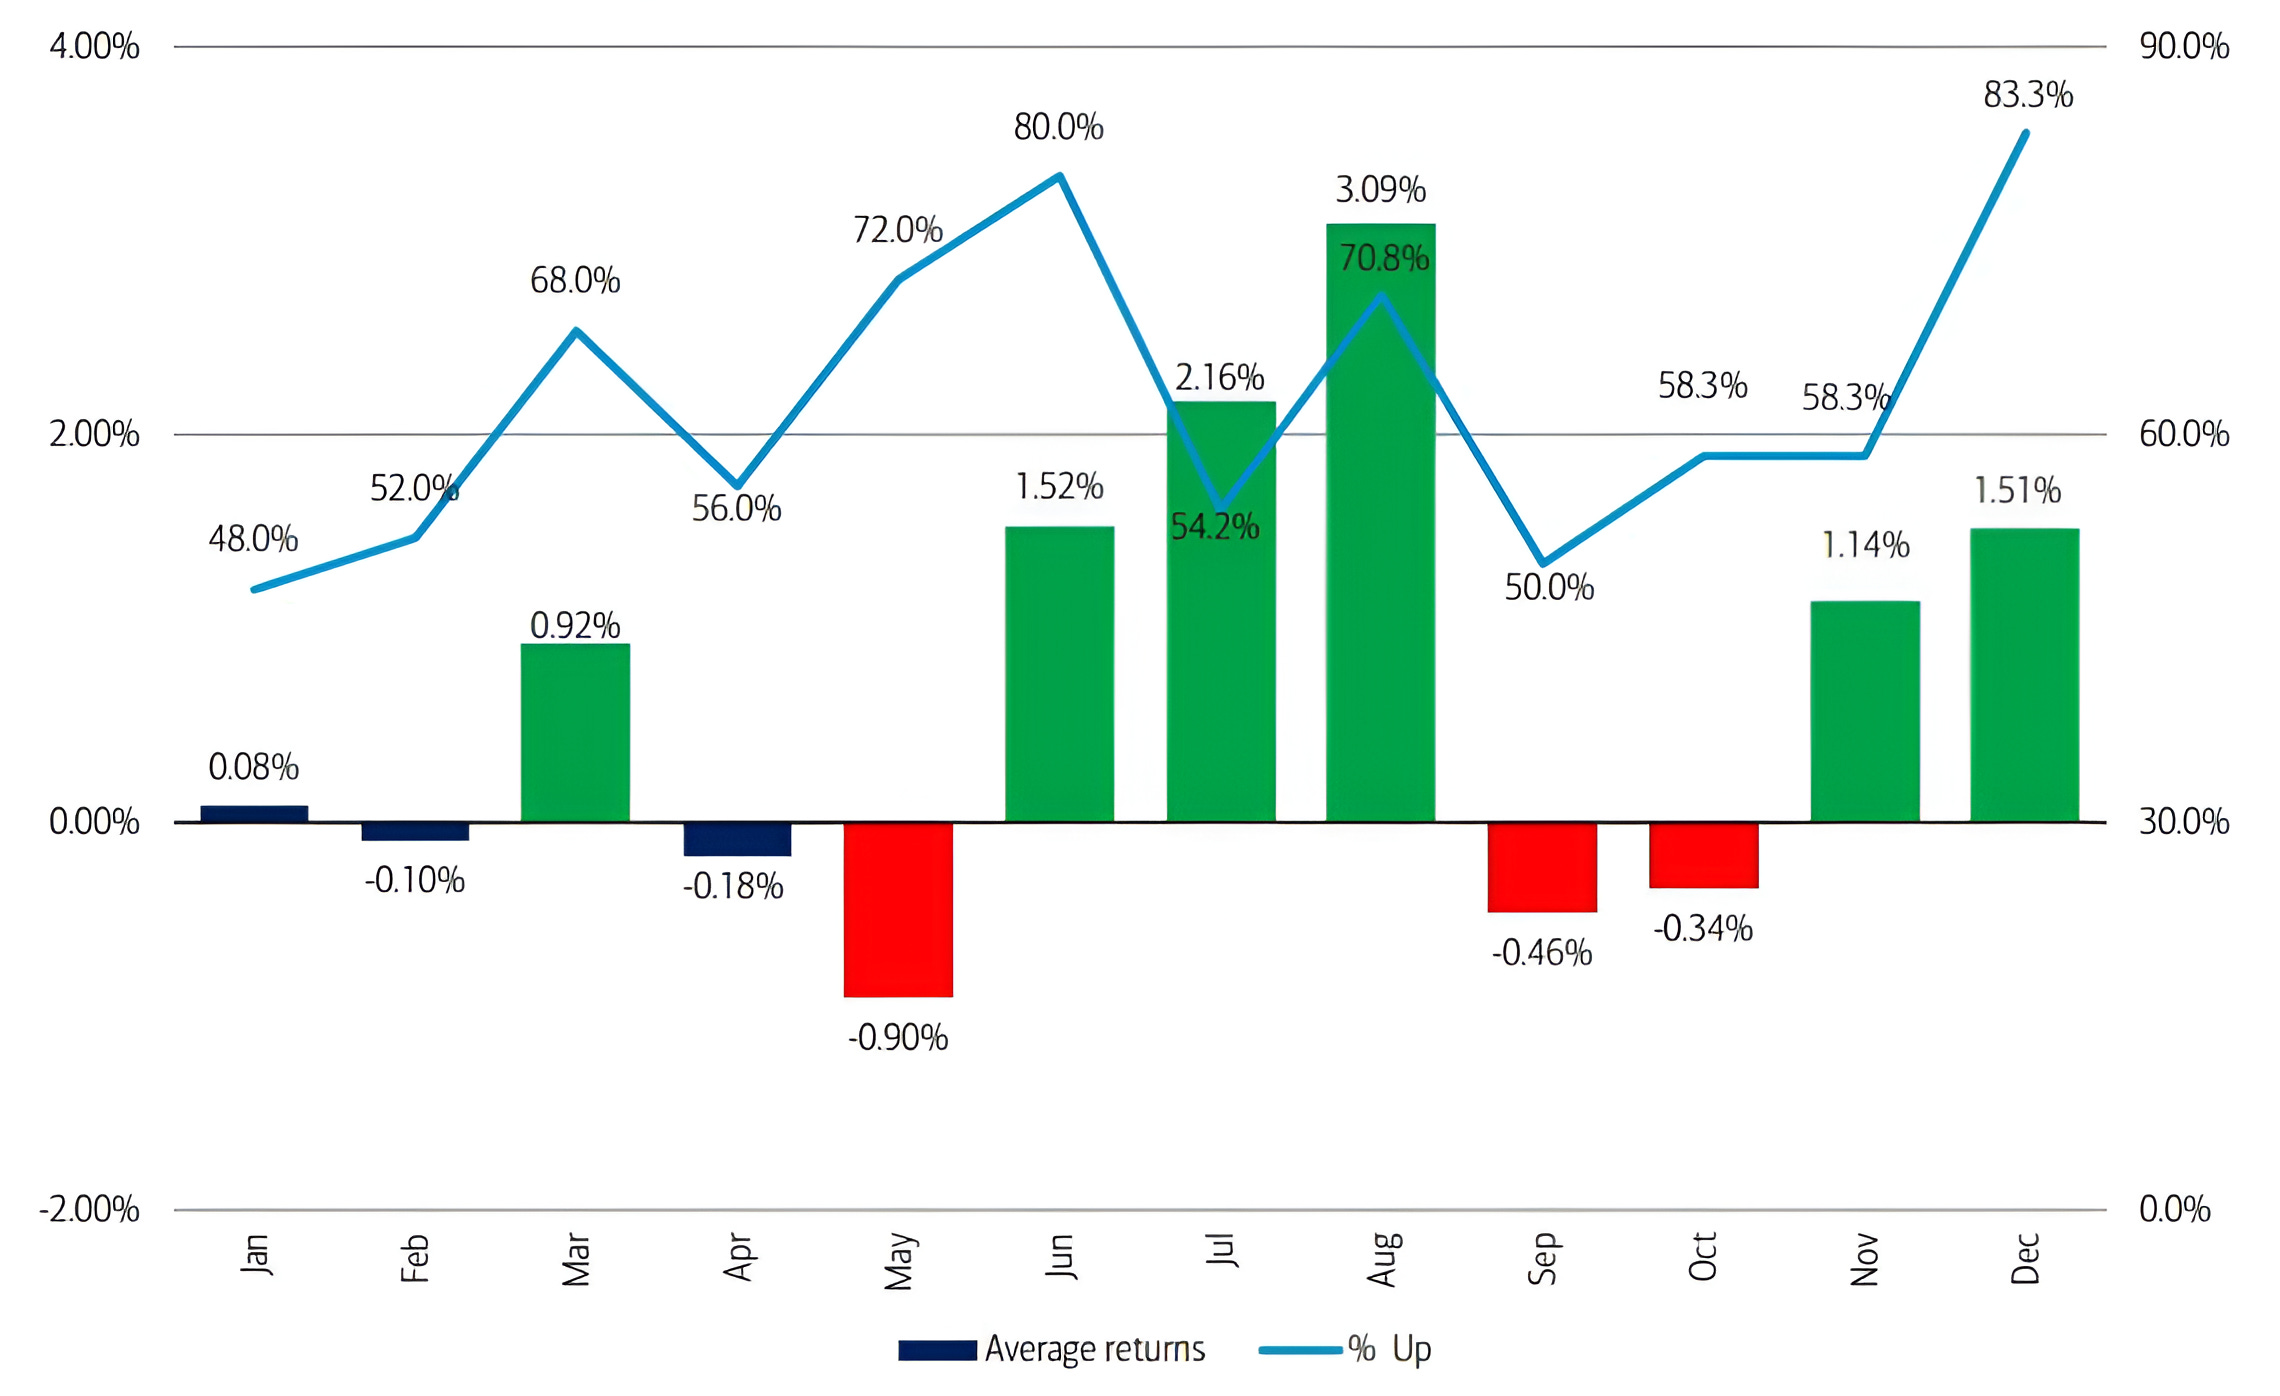
Source: Bank of America. Through year-to-date 2024.
The chart above shows the average return (the bars) and incidence of positive returns (the line) for each month of US Presidential election years since 1928.
While June, July and August have been the strongest months of US Presidential elections years, September and October are two of the weaker months.
Given the combination of the technical set-up that we’ve shown; the fundamental / valuation combination; the second half of September liquidity drain; the economic backdrop; and the political uncertainty; we might give this chart a little more consideration than typical.
That said, one of our favorite trades is to use the September / October election year volatility to position ourselves for a post-election rally.
(Past performance is not indicative of future results. This is not a recommendation to buy or sell any security, please do your own research).