

Break on Through to the Other Side
The S&P 500 has climbed back to its mid-July high with Nvidia earnings coming tomorrow. Will the leader in AI (chips) once again move equities to a new high? Let's dig in...
In honor of tomorrow’s Nvidia earnings, I created the picture below of “breaking on through to the other side” using AI.
That said AI is being used for much more significant endeavors than my creations.
Recently, Doug McMillen, the CEO of Walmart said:
“We're leveraging data and large language models from others and building our own… We've used multiple large language models to accurately create or improve over 850 million pieces of data in the catalog.
Without the use of generative AI, this work would have required nearly 100x the current headcount to complete in the same amount of time.”
If you have ever seen my drawings, you would know that even with 100 people like me, we could not have come up with the illustration below
Please see chart 2 for more on AI.

1. Can the S&P 500 ETF “Break on Through?”
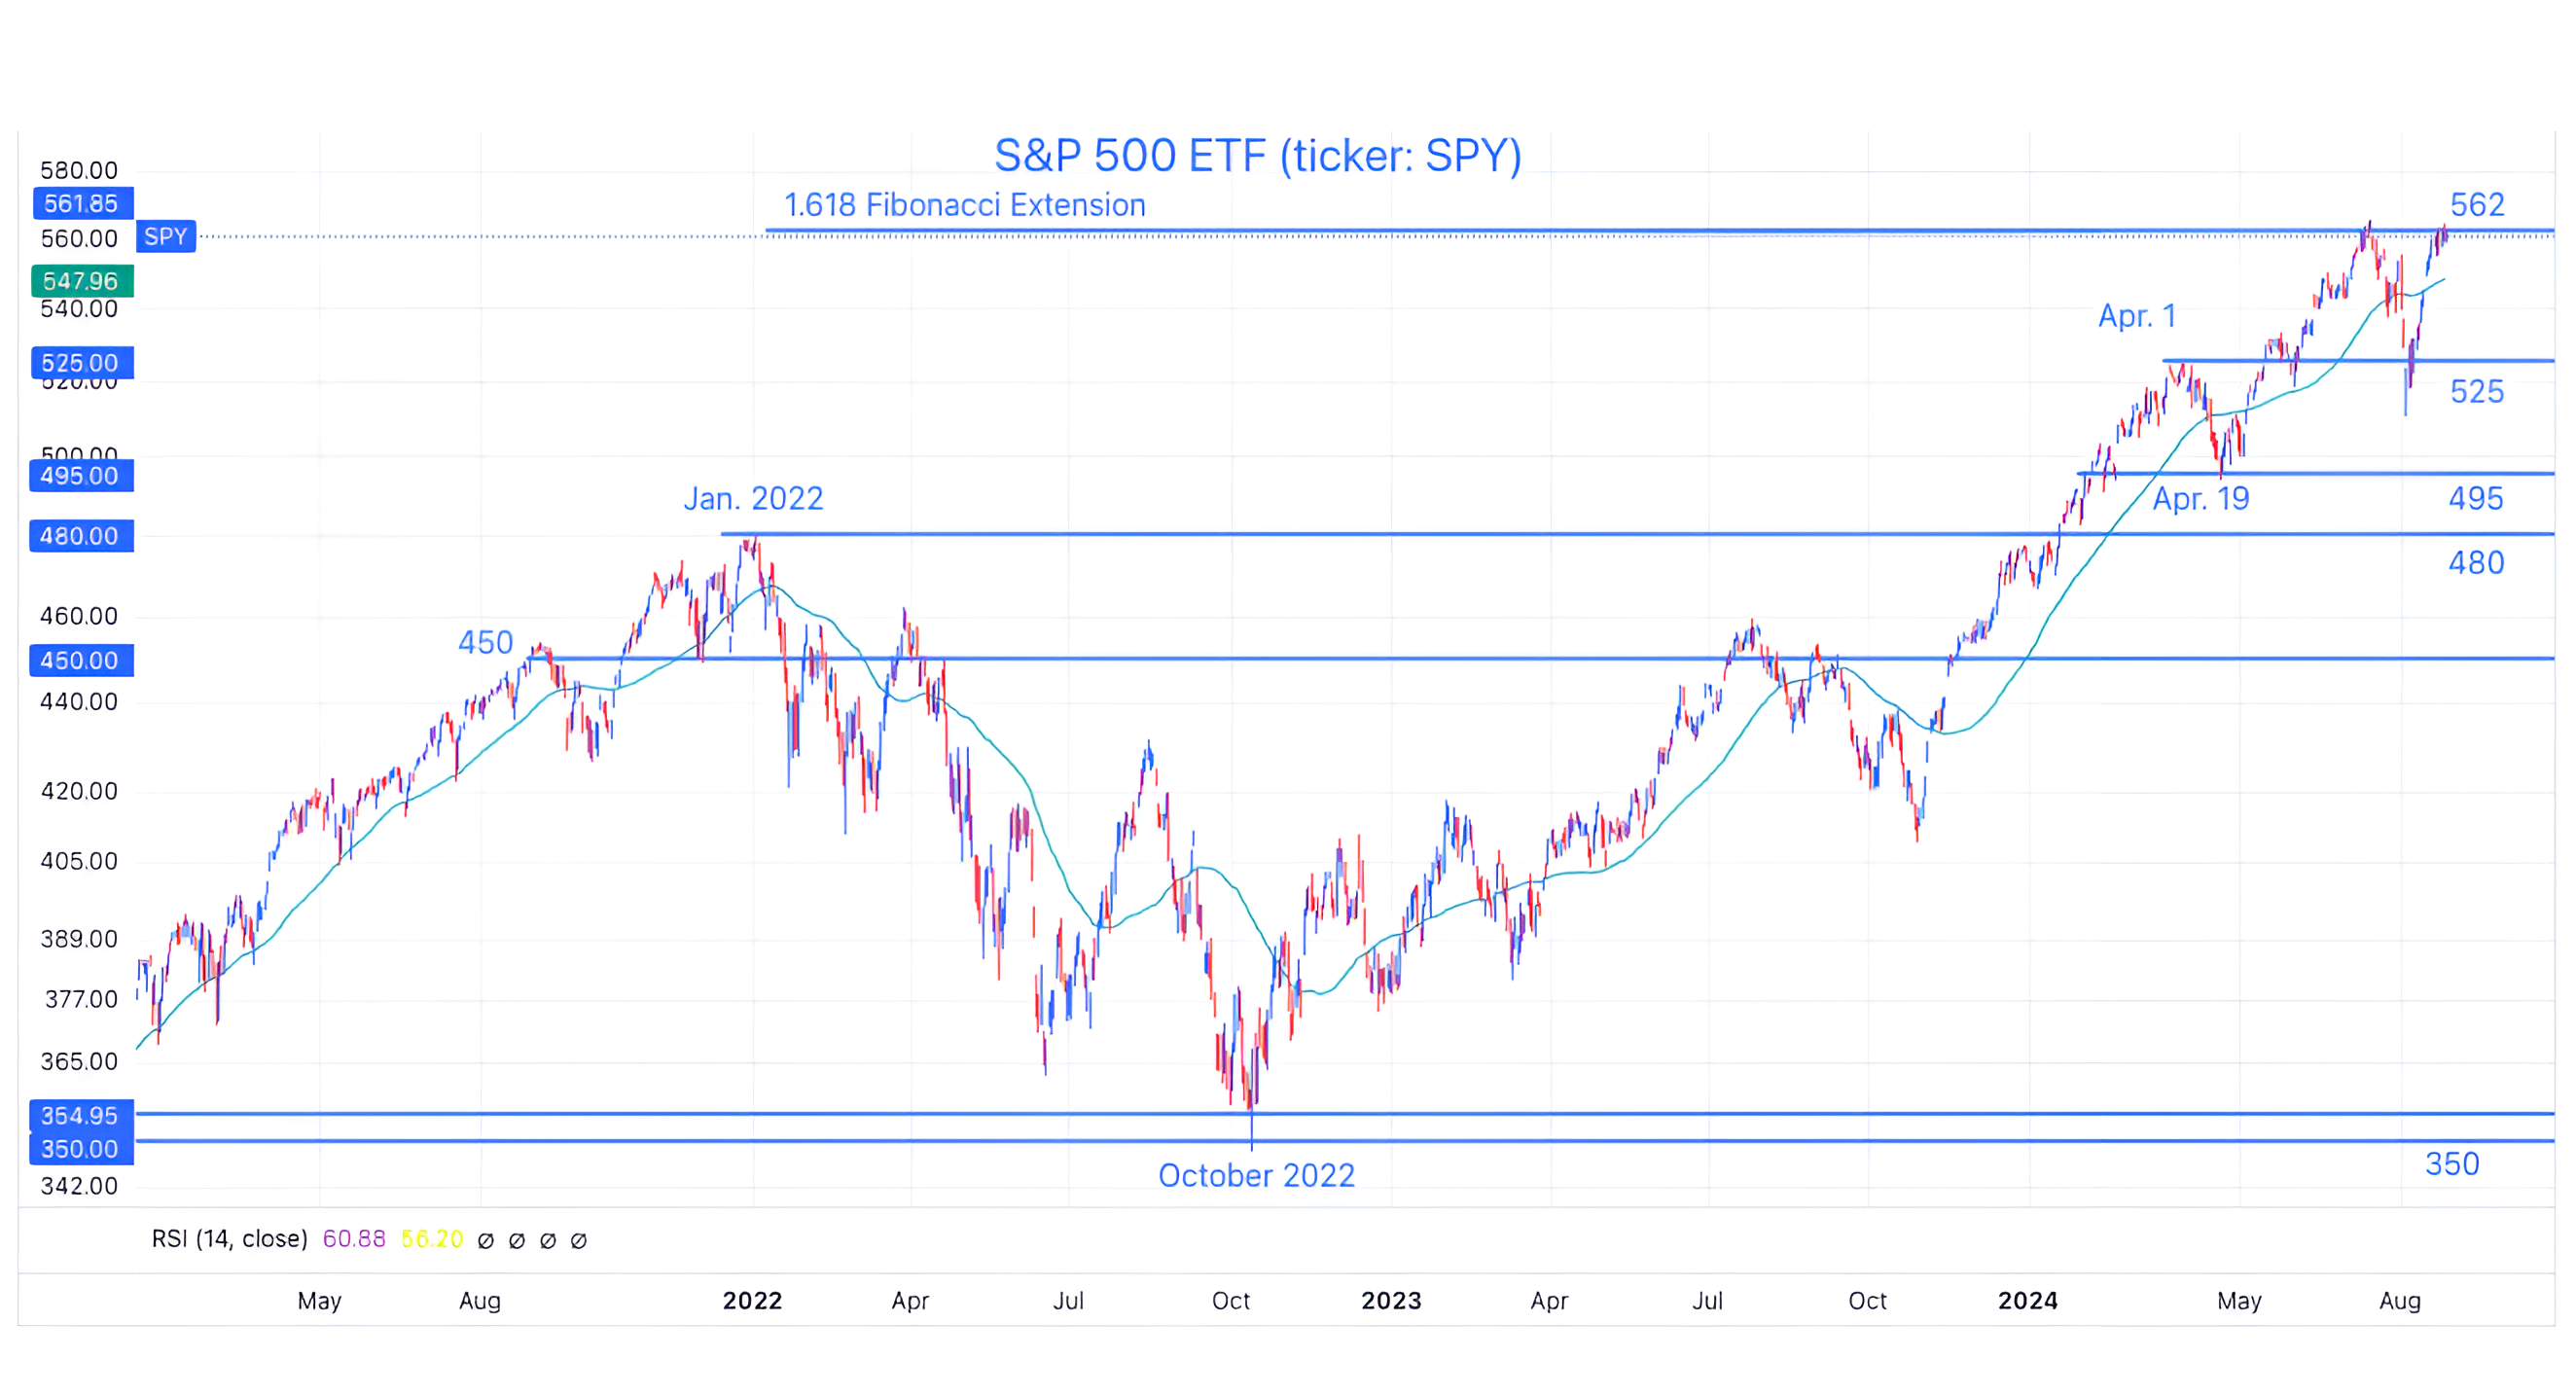
Source: Trading View. Through year-to-date 2024.
Over the past month, we have consistently been showing the above chart of the S&P 500 ETF (ticker: SPY) (here, here, here and here).
Admittedly, the move from the August 5th low has been much stronger and without a pause than we had expected.
As we showed last week (chart 2 here), we believe that the move higher in equities is at least partly attributable to the Treasury once again applying “stealth liquidity” to the economy and the market.
However, we can’t ignore that the expectation of Fed rate cuts combined with benign economic data has also had market participants pricing in a soft landing.
Our concern with equities at current levels has consistently been that earnings and expectations, in our view, are likely unrealistically high, while top decile valuations seem demanding.
With the S&P 500 ETF back to its mid-July high, we question how much further it can go without a pause.
In our view, Nvidia’s earnings (and more importantly the reaction to them) will have an impact on the near-term market direction.
While Nvidia could provide a short-term “sugar high,” as we highlighted when we wrote about the “stealth liquidity” last week, it should be noted that there is expected to be a “liquidity drain” at the end of September and, as we show in chart 4, that has been a historically challenging period.
(This is not a recommendation to buy or sell any security and is not investment advice. Please do your own research and due diligence).
2. Large Language Models (LLMs) and AI
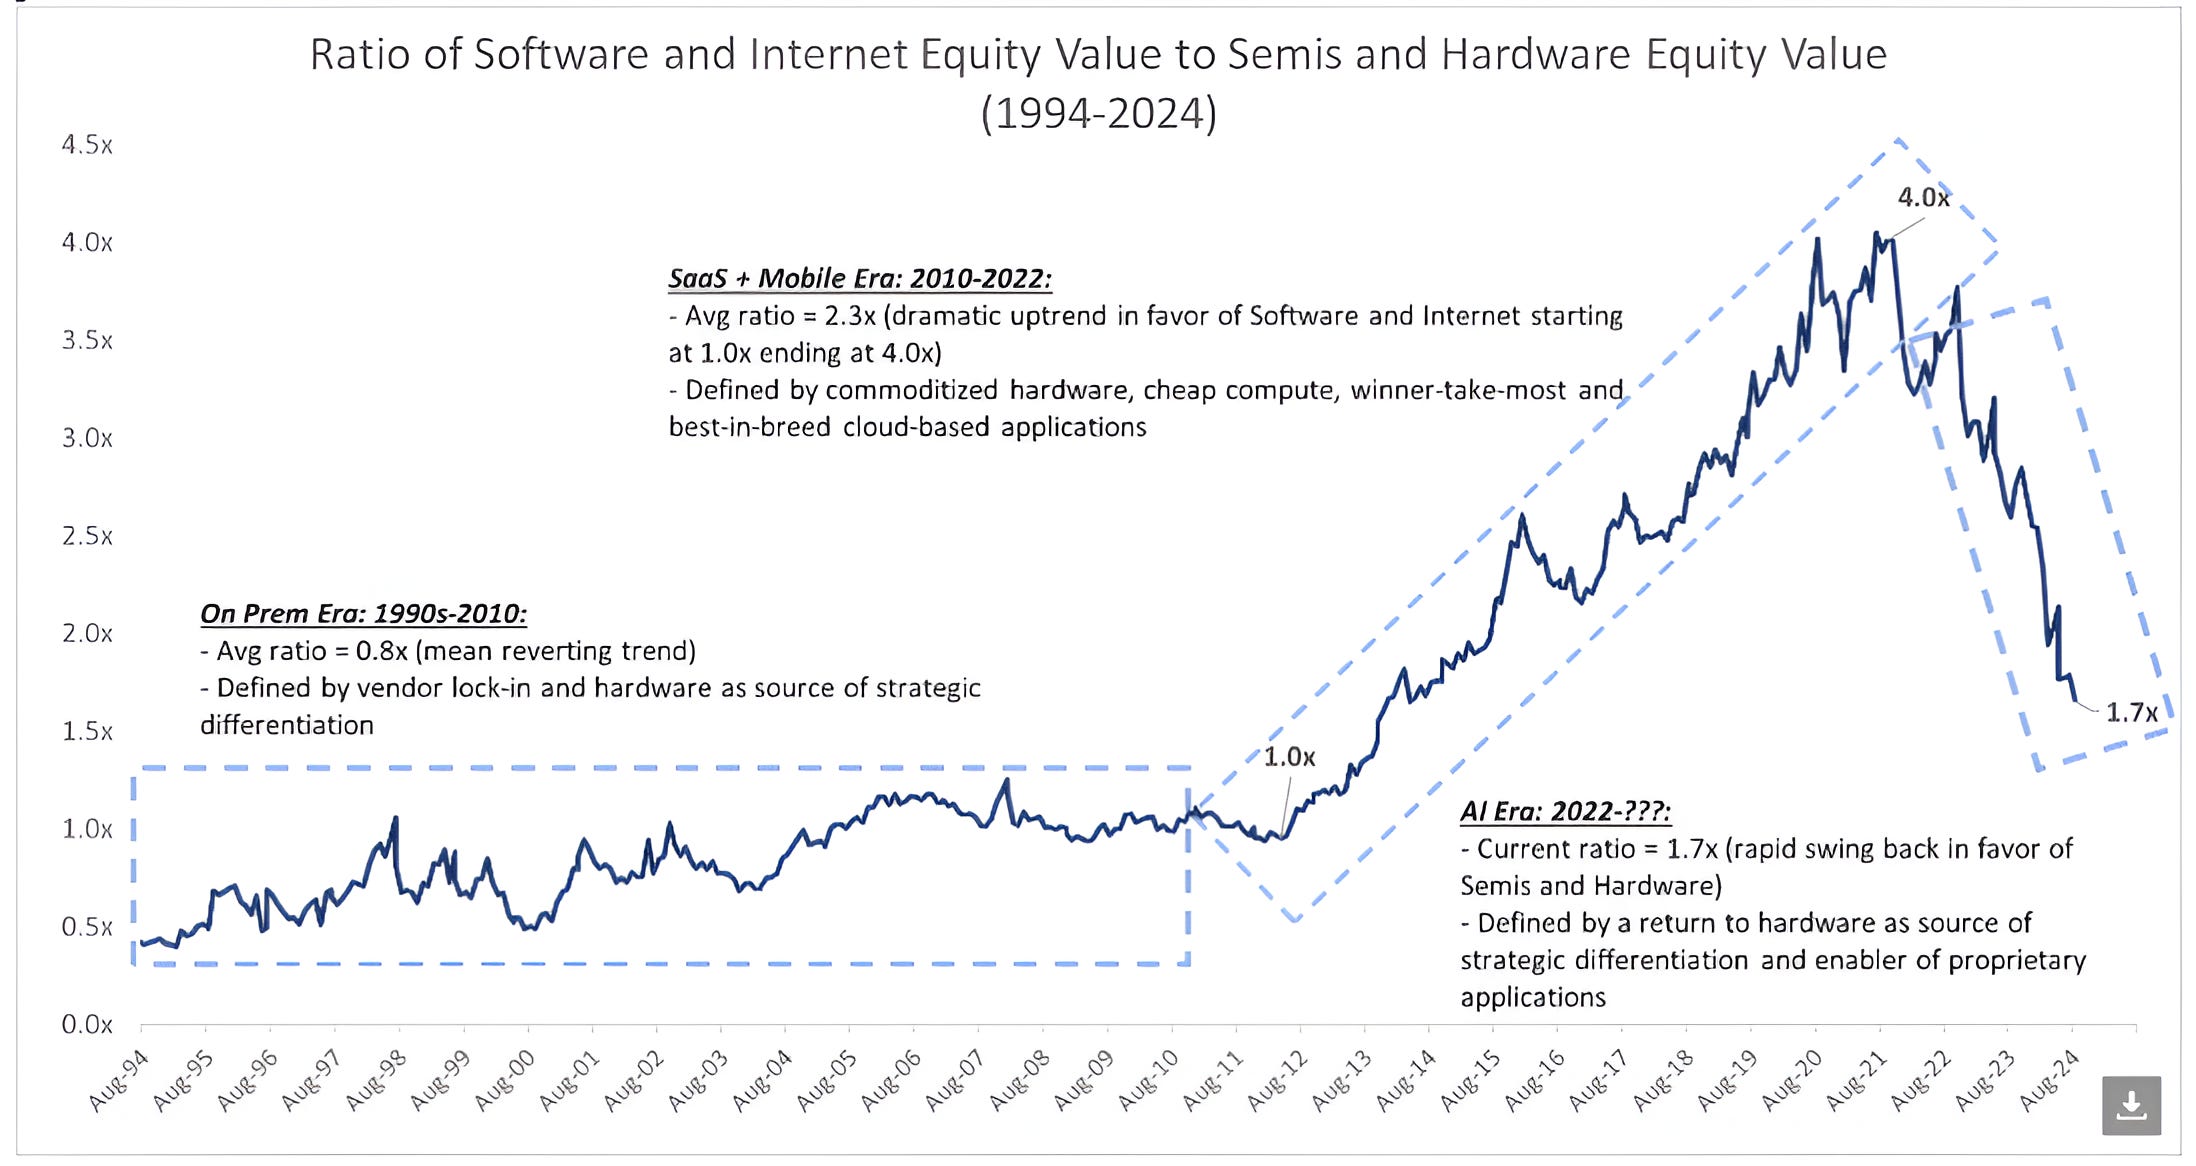
Source: Evercore. Through year-to-date 2024.
The chart above shows the Ratio of Software and Internet stocks to Semiconductor and Hardware shares from 1994-2024.
In general, there have been three periods:
The On Premise Era (1990s-2010).
This was the period of of giant servers that sat “on premise” in giant rooms that required significant air conditioning (think Oracle).
This was also the period when the “wintel” model of PCs and the Microsoft operating system dominated the office landscape.
These dynamics benefitted hardware and software equally as can be seen in the chart above.
The Software as a Service (“SAAS”) + Mobile ERA: 2010 - 2022
This was the period of cloud based software (think Salesforce and Service Now). Hardware (particularly semiconductors) was commoditized.
As can be seen on the chart, cloud software (not on premise) and apps on mobile devices benefitted relative to hardware.
The AI Era 2022 - ???
Kevin Rippey, from Evercore, has provided the best analysis of this period:
“My view is that LLMs (Large Language Models) are a new interface layer.
More akin to the introduction of Graphic User Interfaces (GUI) in the 1980s [the original Mac computers] or the touch screen mobile devices in the iPhone.
I’d argue that Interface layers like GUI, and touchscreens, have historically not been monetizable on their own, but rather have created new vectors of competition in existing markets, and additional surface area for new market creation. I believe that LLMs as trained on publicly available data will follow the same path.”
In other words, we are in the very early stages of the AI transformation (after Mac but before Windows and iPhone 1 / early stages of app store).
Given the fact that the other eras shown in the chart above lasted over a decade each and that we are two years into the AI / LLM disruption, it is likely that the trend of hardware over software (generally) will continue for an extended period.
(Past performance is not indicative of further results. This is not a recommendation to buy or sell any security and is not investment advice. Please do your own due diligence).
3. All In…
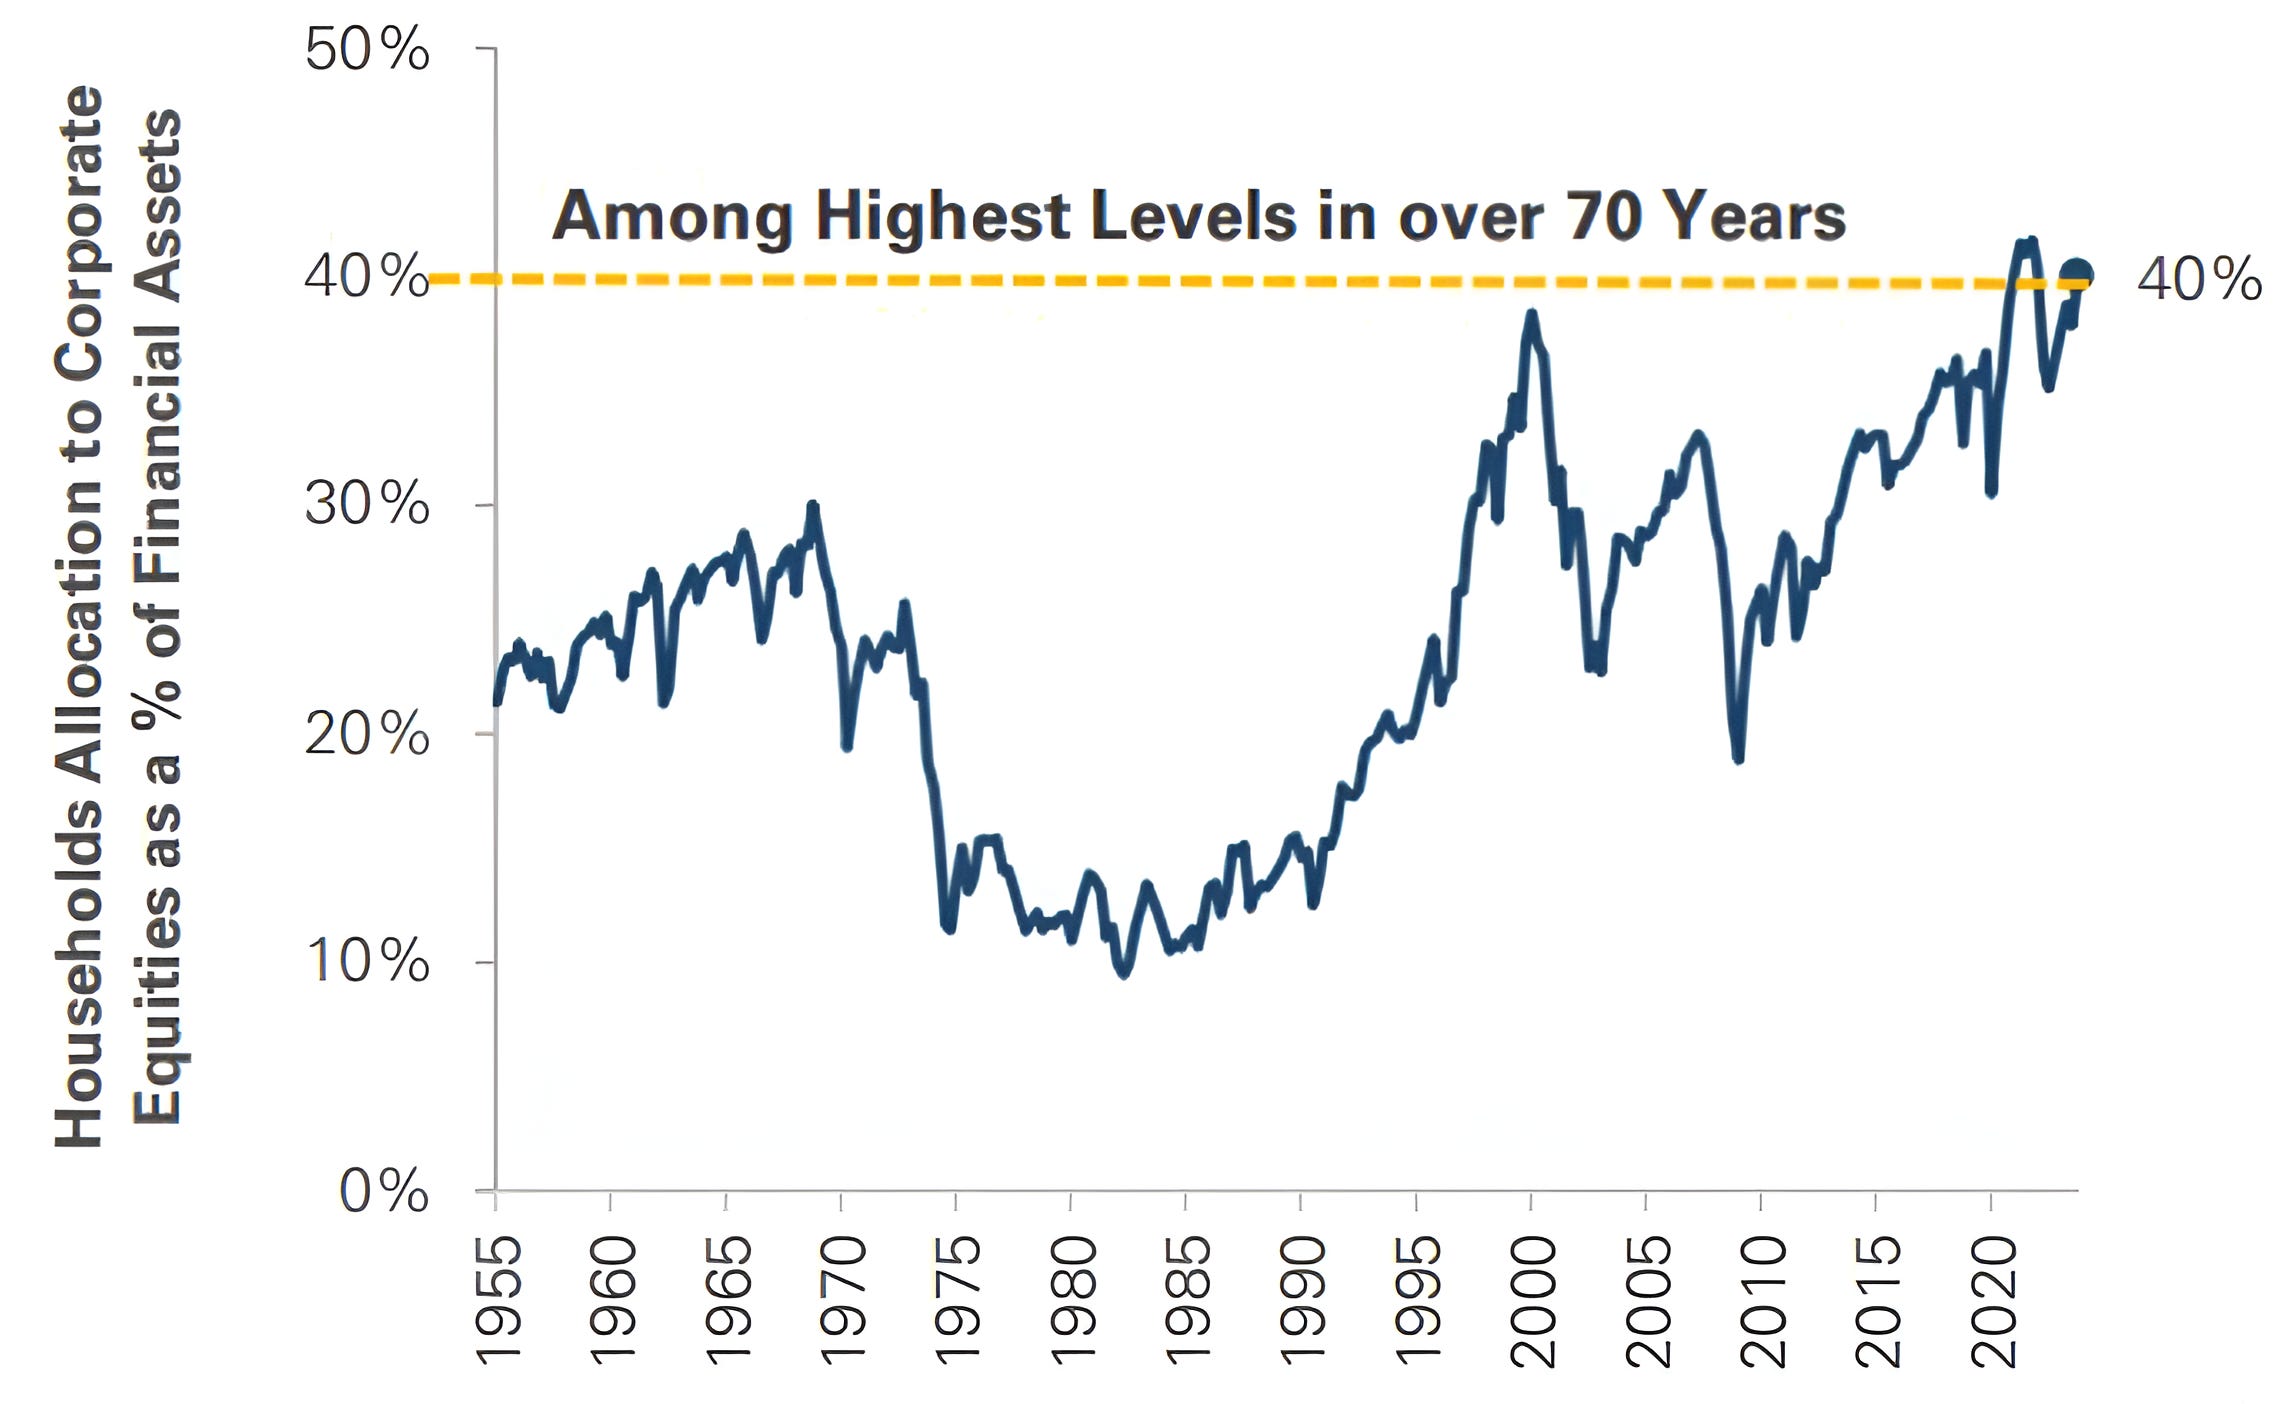
Source: MarketDesk. Through year-to-date 2024.
The chart above shows the Allocation to Equities as a Percent of Financial Assets since 1955.
At 40%, the current allocation to equities is among the highest levels in over 70 years.
While there are several reasons for this (low interest rates, broad acceptance of equities as an asset class), it is notable.
It is often said that the market will do what hurts most people, most of the time. We will see if this is the case once again.
(Past performance is not indicative of future results. This is not a recommendation to buy or sell any security and is not investment advice. Please do your own due diligence).
4. Cautious through the End of September?
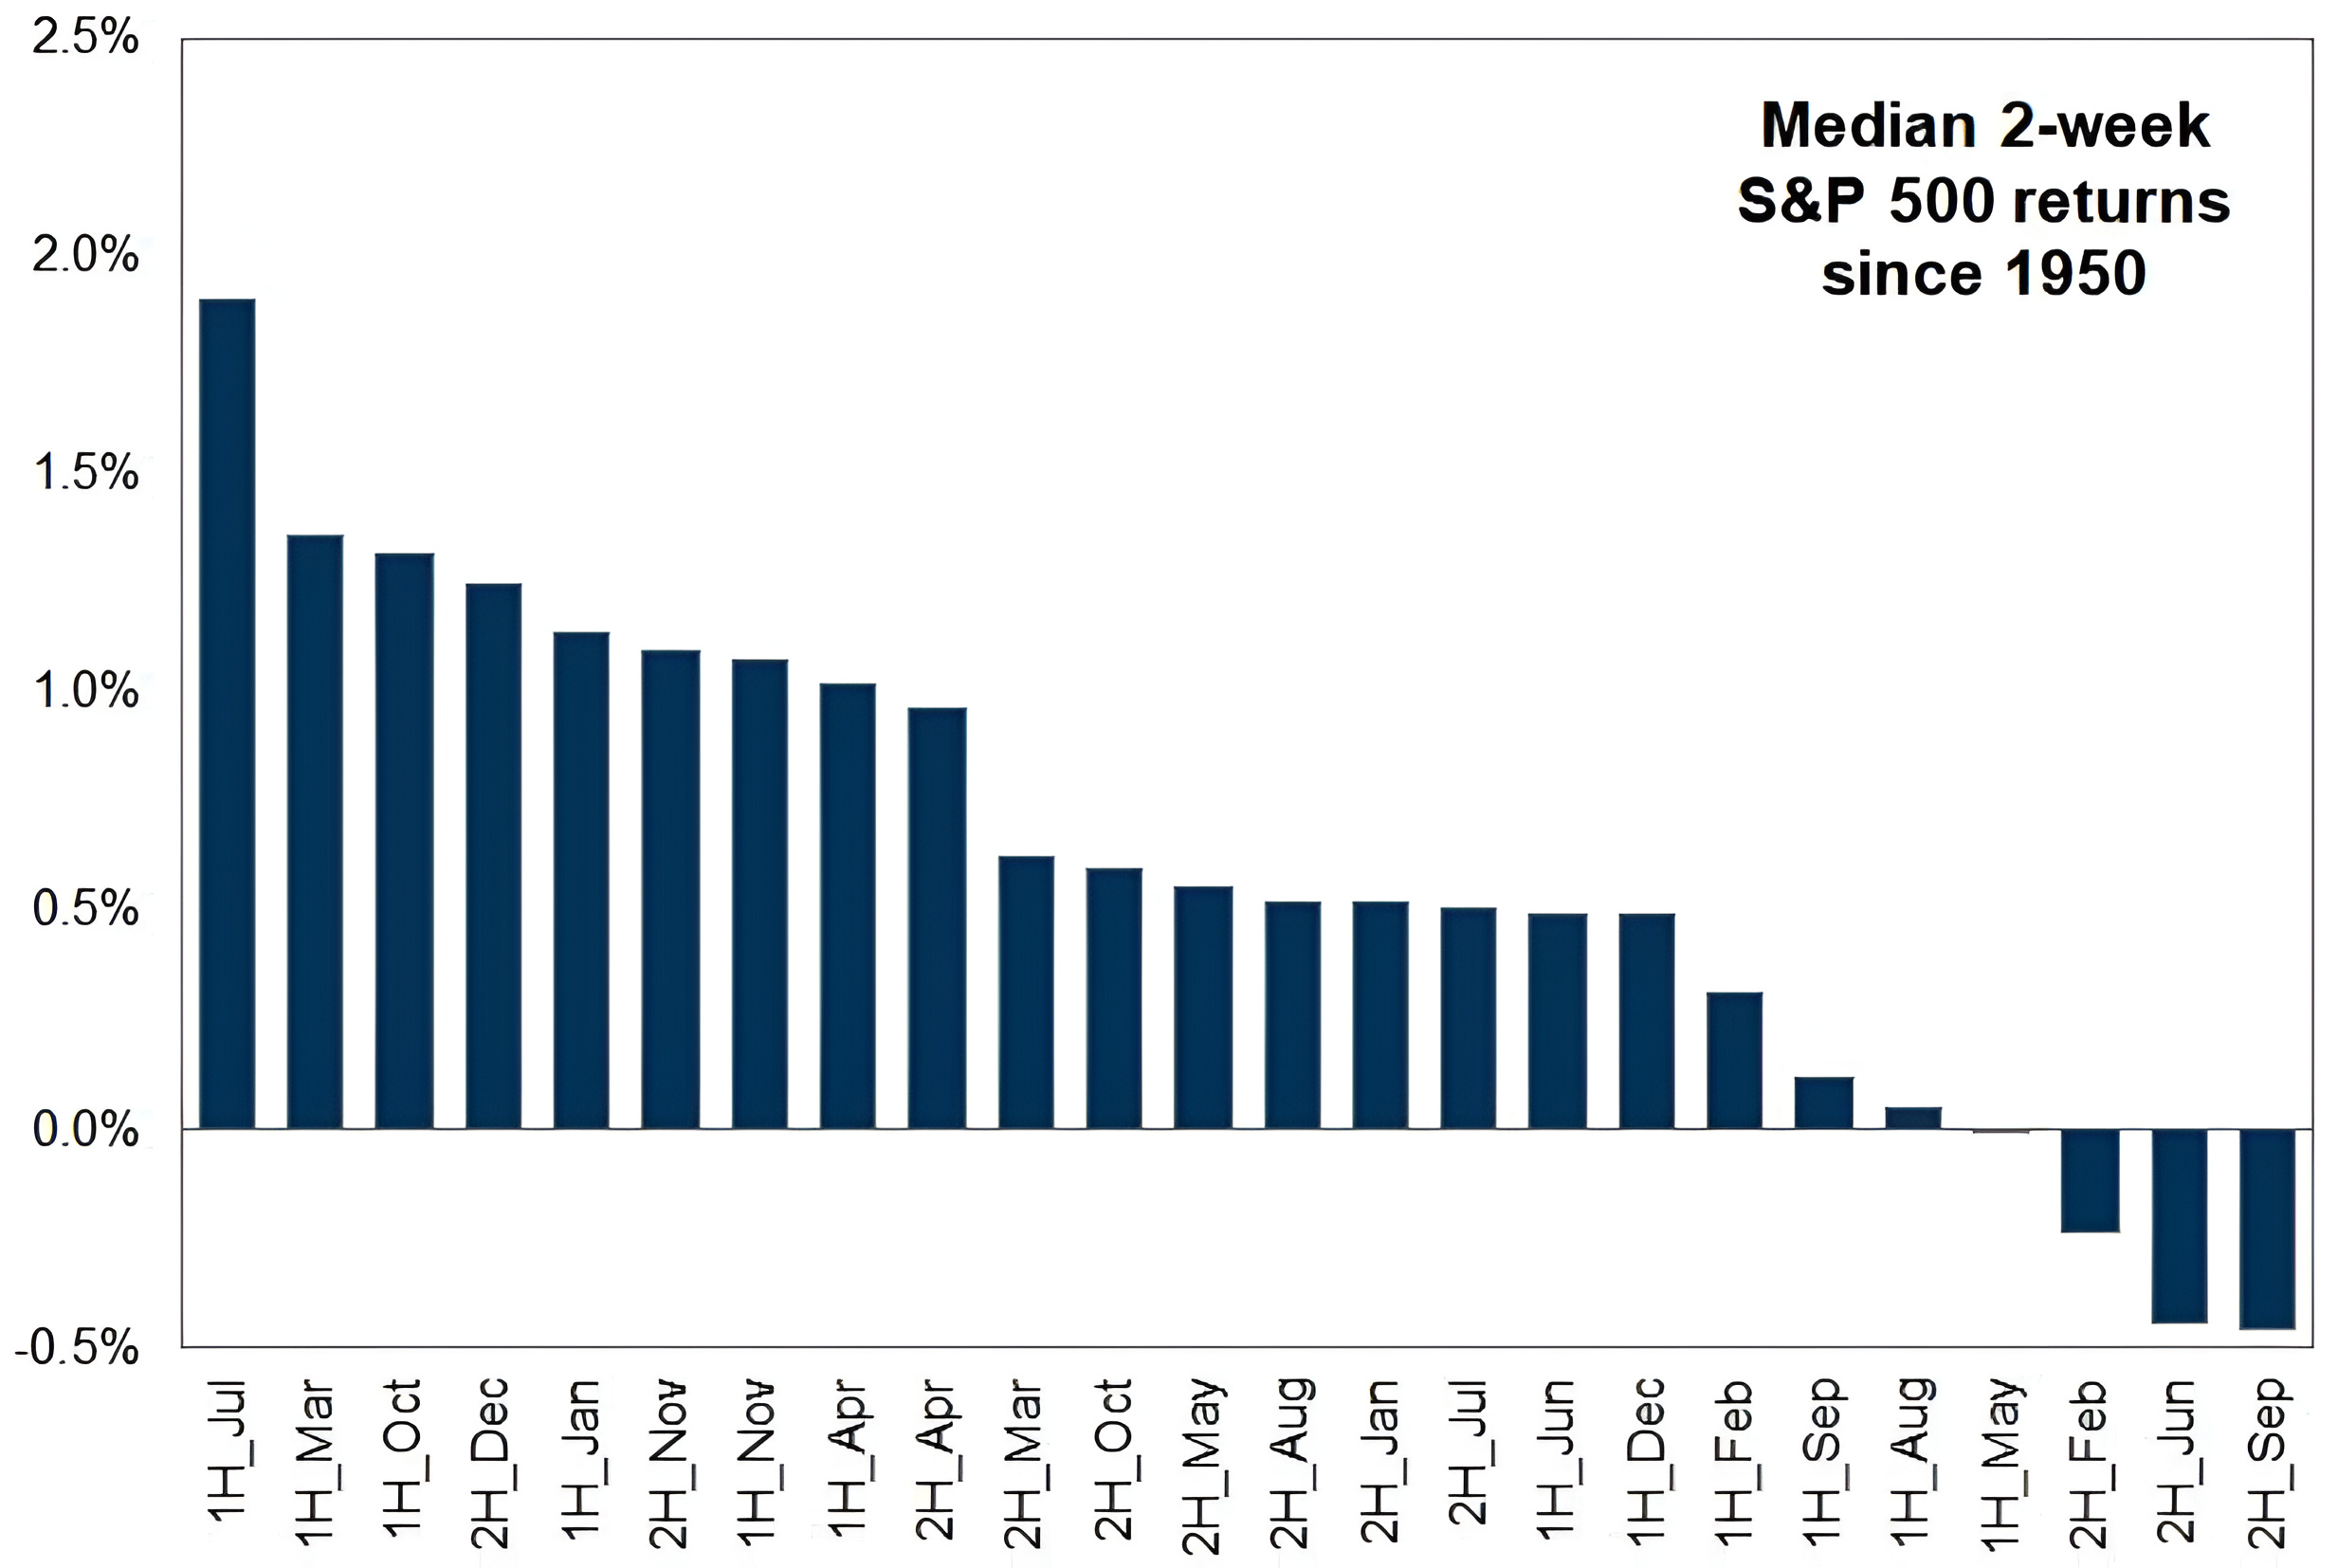
Source: Goldman Sachs. Through year-to-date 2024.
The chart above shows the median returns of the S&P 500 for each half-month since 1950.
Very simply, the second half of September has historically had the lowest half-month return of the year.
Combined with the the mid-September liquidity drain that should last from September 14-October 1st, this may be something that we should consider.
(Past performance is not indicative of future results. This is not a recommendation to buy or sell any security and is not investment advice. Please do your own due diligence).
5. But Bullish Longer-Term?
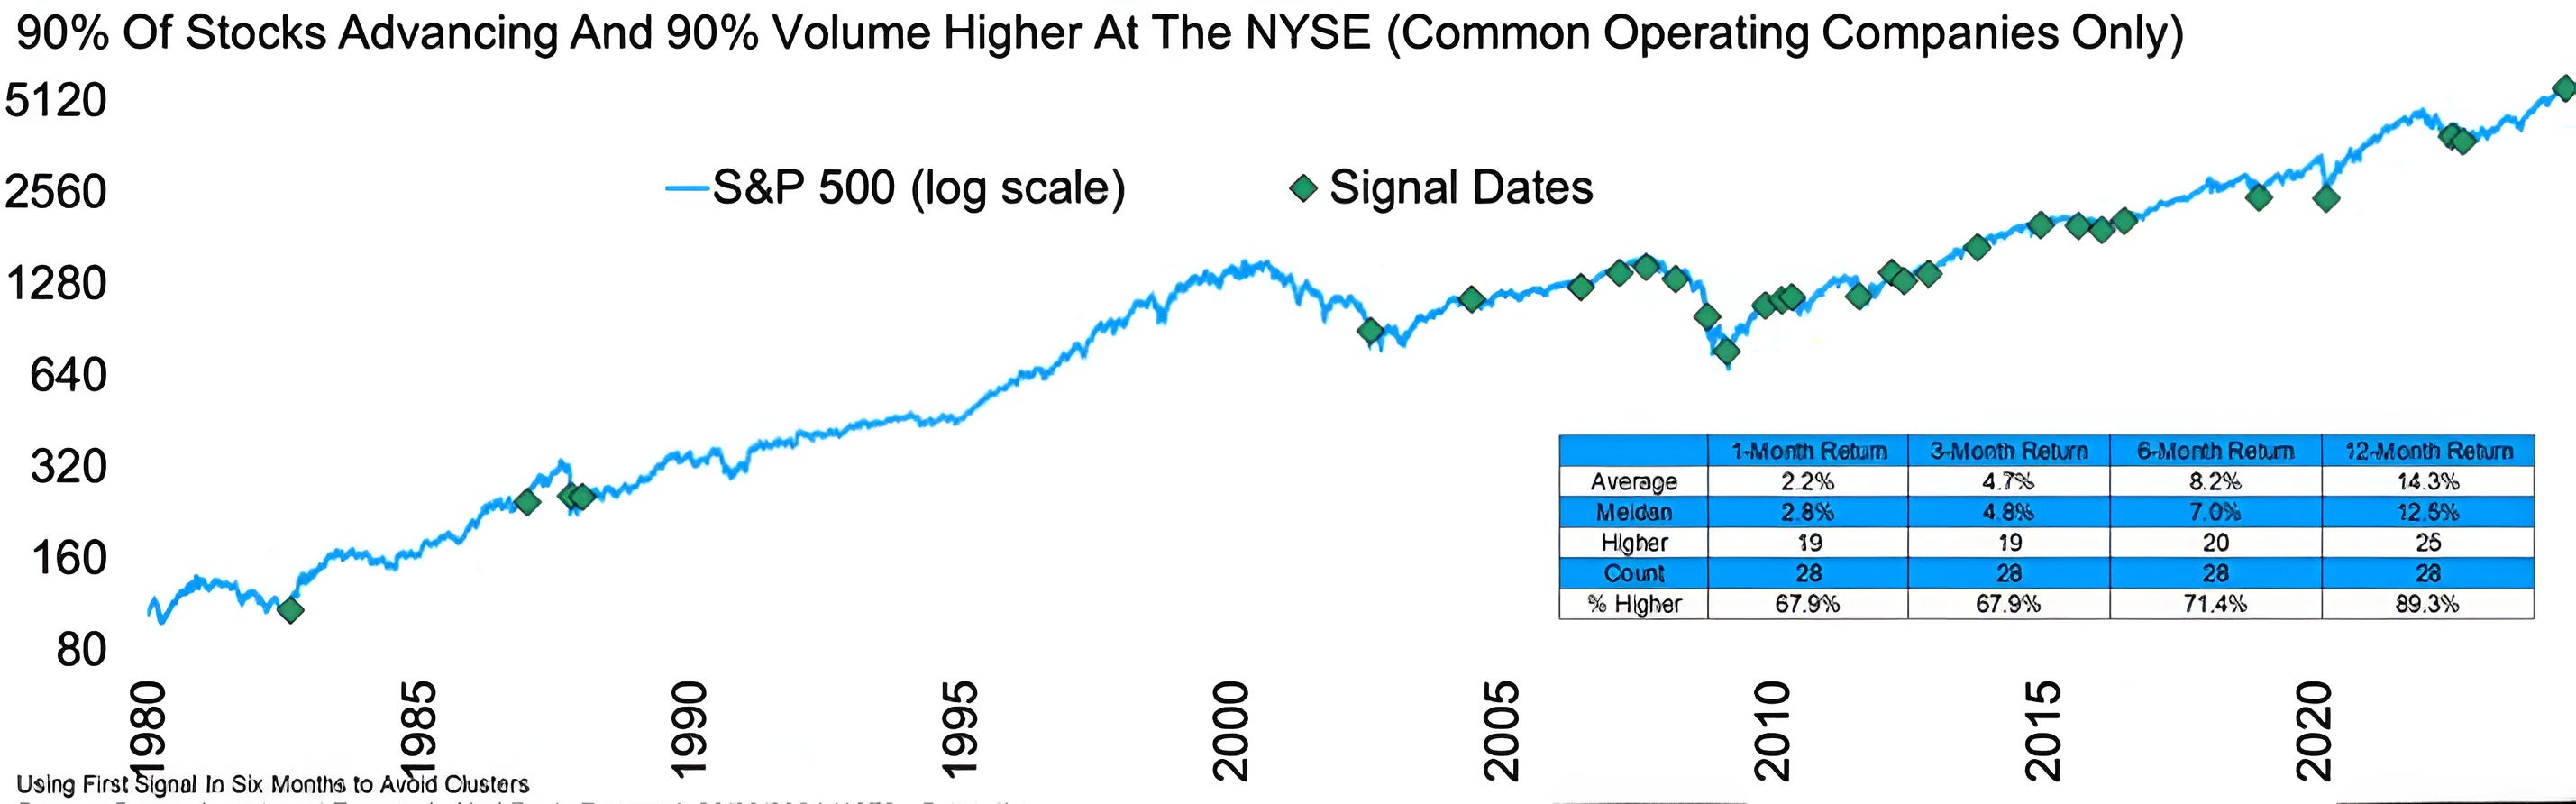
Source: Carson Investment Research / Ryan Detrick. Through year-to-date 2024.
The chart above shows the S&P 500 from 1979 with times that 90% of stocks are advancing and 90% of the volume at the NYSE is higher.
This occurred last Friday for the first time since October 2022 which was the low of the 2022 sell-off.
Historically, this signal has been up 89% of the time one year later and up 14.3% on average.
While this condition has been bullish nearly 90% of the time - looking closely at the chart, it signaled in 2006, 2007 and 2008 shortly before the financial crisis sell-off.
(Past performance is not indicative of future results. This is not a recommendation to buy or sell any security, please do your own research).