


Come Along and Ride on a Fantastic Voyage!
With the first half of 2024 nearly complete and equities, as typical, having performed as few expected, we are set to consider what surprises are in store for the next 6 months. Let's dig in...
1. The Resolution in the Average Stock Will Likely Set the Tone for the Second Half of 2024
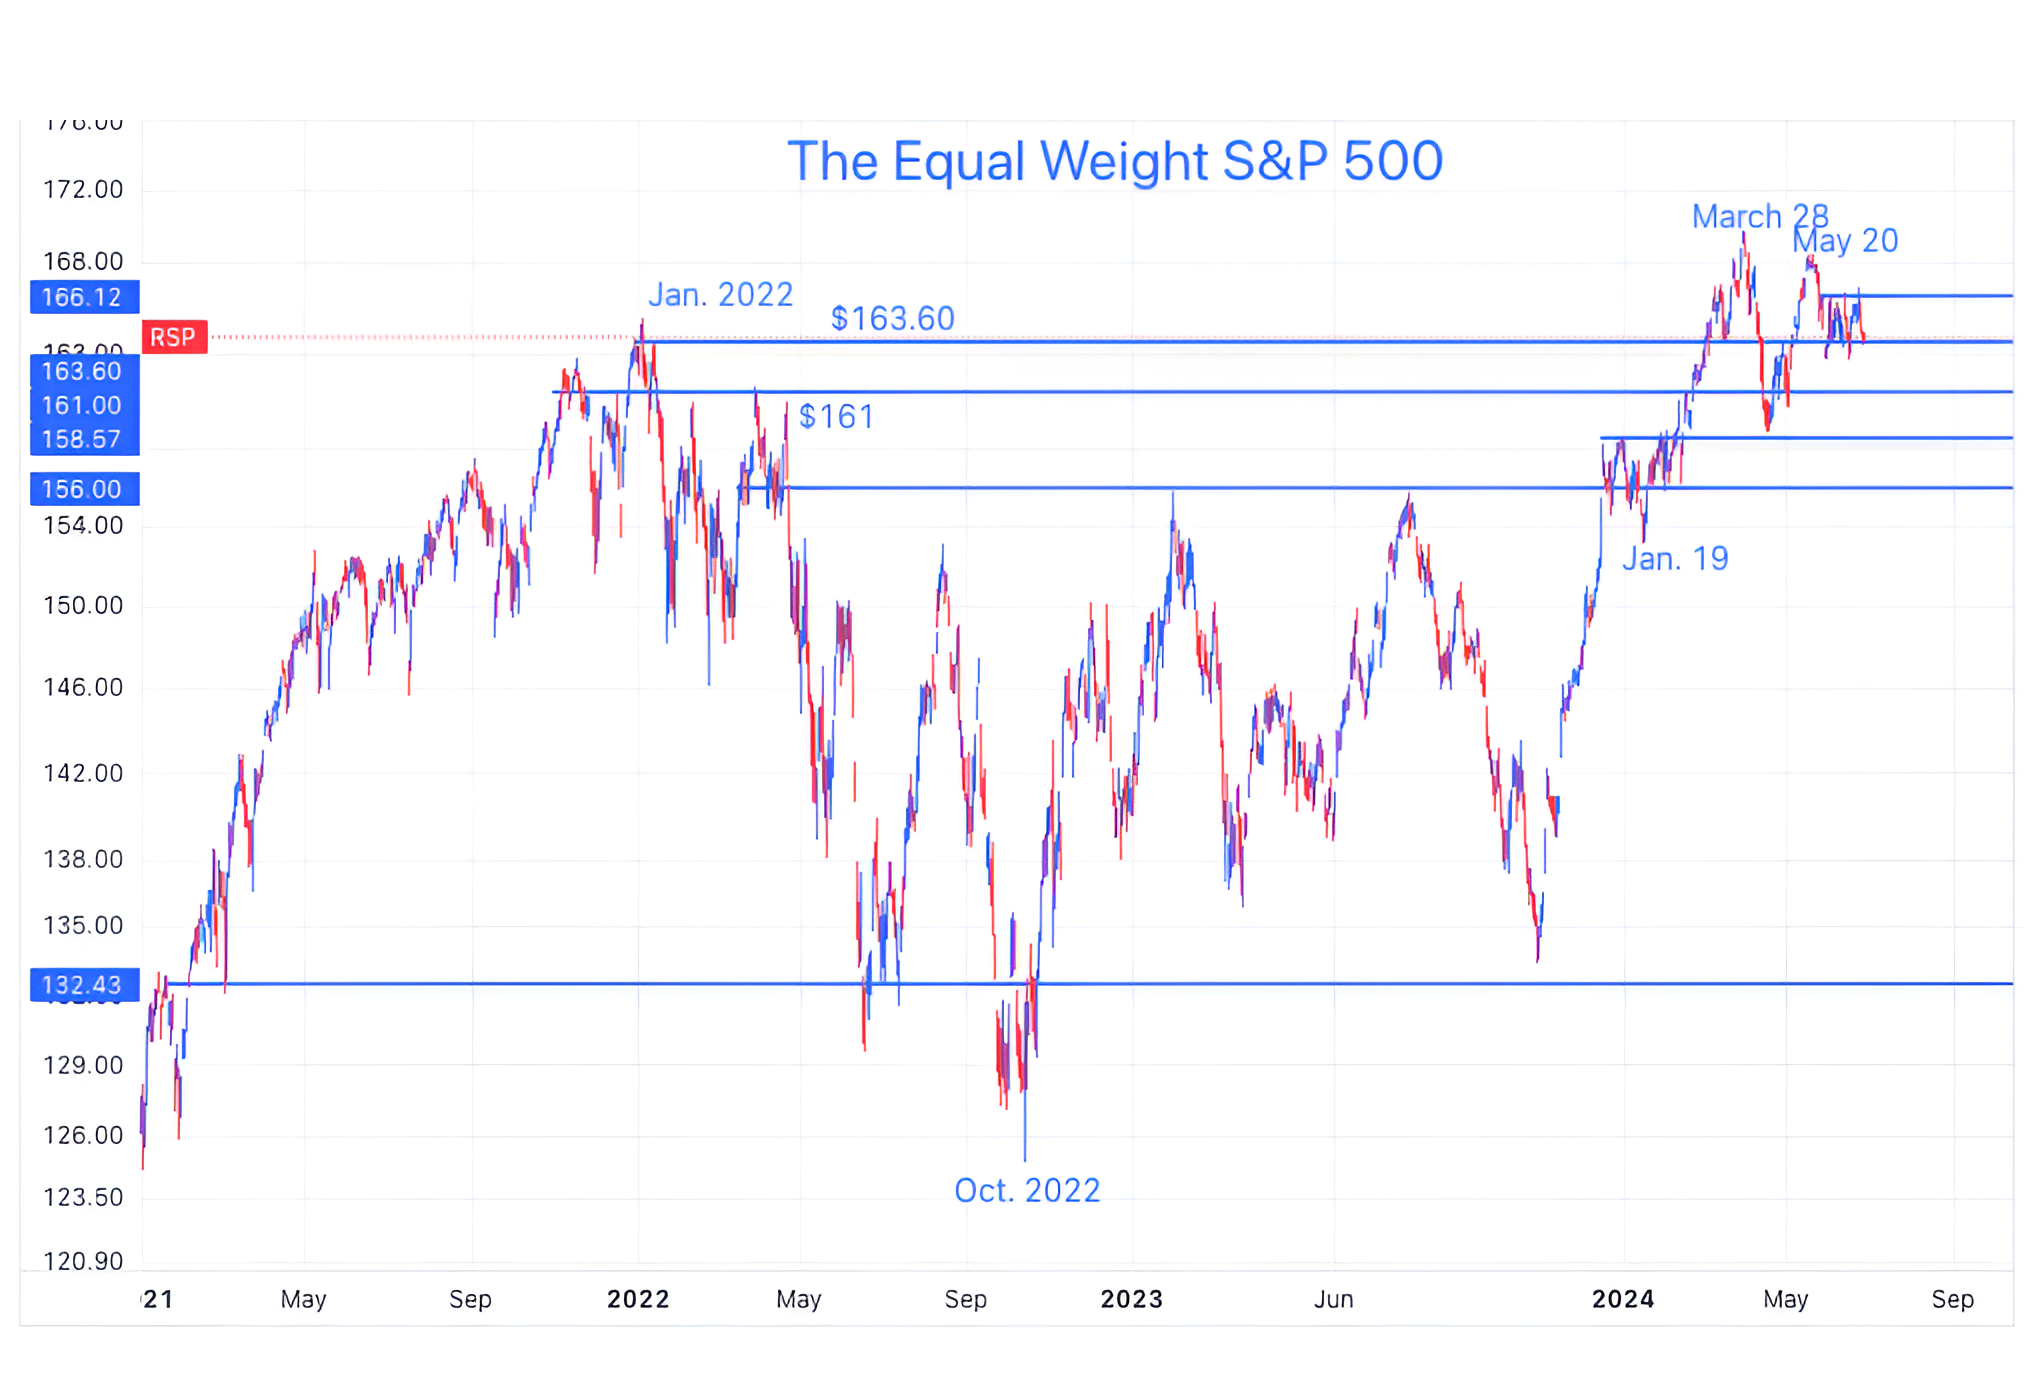
Source: TradingView. Through year-to-date 2024.
The chart above shows the Equal Weight S&P 500 - what we consider to be the “average” large-cap US stock. We last showed this here.
As a reminder, the Equal Weight S&P 500 has a 0.2% allocation to each of the 500 shares in the S&P 500 Index, whereas the typical S&P 500 is market cap weighted.
This means in the typical S&P 500 that Apple, Nvidia and Microsoft (see chart 4) - have much larger weightings and influence on index performance than Disney, Estee Lauder and McDonalds (as examples).
The average US large cap stock has essentially gone nowhere in two and a half years.
(Read that again, look at the chart).
The S&P 500 is up 14% over that same period.
What I find interesting about this is that the flat performance of the Equal Weight S&P 500 seems to be more in-line with people’s anecdotal view of the economy than the positive performance of the typical S&P 500.
Despite the fact that the average US large cap stock has essentially gone nowhere in two and a half years, the valuation has actually increased (see Chart 4 here).
This means that earnings for the average S&P 500 company have been flat or have slightly decreased over that period.
The expectation is that overall S&P 500 earnings will accelerate in Q4 and beyond. (see Chart 2 below)
If earnings increase in line with expectations, the chart of the Equal Weight S&P 500 can move higher and out of the sideways range (between the top two horizontal light blue lines on the chart) in which it has been for the last month.
If earnings disappoint, it is possible for the Equal Weight S&P 500 to fall back below its January 2022 high.
We believe that the guidance that corporate management teams provide in the upcoming earnings season (begins in 2 weeks!) will be critical.
(This is not a recommendation to buy or sell any security and is not investment advice. Please do your own research and due diligence).
2. Continuing to Try to Understand Expected Earnings Growth

Source: Strategas / FactSet. Through year-to-date 2024.
The chart above shows the S&P 500 net income growth attributable to the Magnificent 7 (Apple, Google, Microsoft, Tesla, Facebook/ Meta, Nvidia and Amazon) and that attributable to the “other 493” companies of the S&P 500 (“Ex Mag 7”).
Given the Mag 7 net income growth over the past three quarters - it is clear why they are called Magnificent.
That said, our questions have been centered on expected S&P 500 earnings growth for Q3 2024 and beyond.
Looking at the chart above, analysts are expecting Magnificent 7 earnings growth to decelerate as the comparison periods from last year become more challenging. At the same time, they are projecting that the Ex Mag 7 (other 493) earnings - which have not grown over the past year - to grow 13% in Q3 and Q4 and 15% in Q1.
As we highlighted on Monday (chart 2 here), this is largely due to margin expansion.
In our view, and we are not looking at this on a company by company basis as the analysts whose estimates are aggregated to derive the figures in the chart above are, this remains aggressive.
On Monday, we wrote “This might make sense if it were a one time event - perhaps the reversal of a large loss - but the heightened margin trend (the difference between sales growth and earnings growth) continues into the first half of 2025.”
After doing some research, there was in fact a one time loss in Q1 2024 - as Bristol Meyers wrote down $12 billion for an acquisition. This write-down is largely responsible for the -8.7% ex Mag 7 earnings growth in Q1. This will help with the Q1 2025 comparison but should not impact Q4 2024.
We draw two conclusions from the chart above:
Even as their earnings growth slows, the S&P 500 remains dependent on the Magnificent 7. Any miss from this cohort could be significant.
If the earnings broadening occurs as analysts expect (we will be watching for signs of this in Q2 earnings season), a cyclical recovery could accompany the AI boom and the S&P 500 could be headed much higher.
(This is not a recommendation to buy or sell any security and is not investment advice. Please do your own due diligence).
3. US Equities Have Typically Not Peaked in June
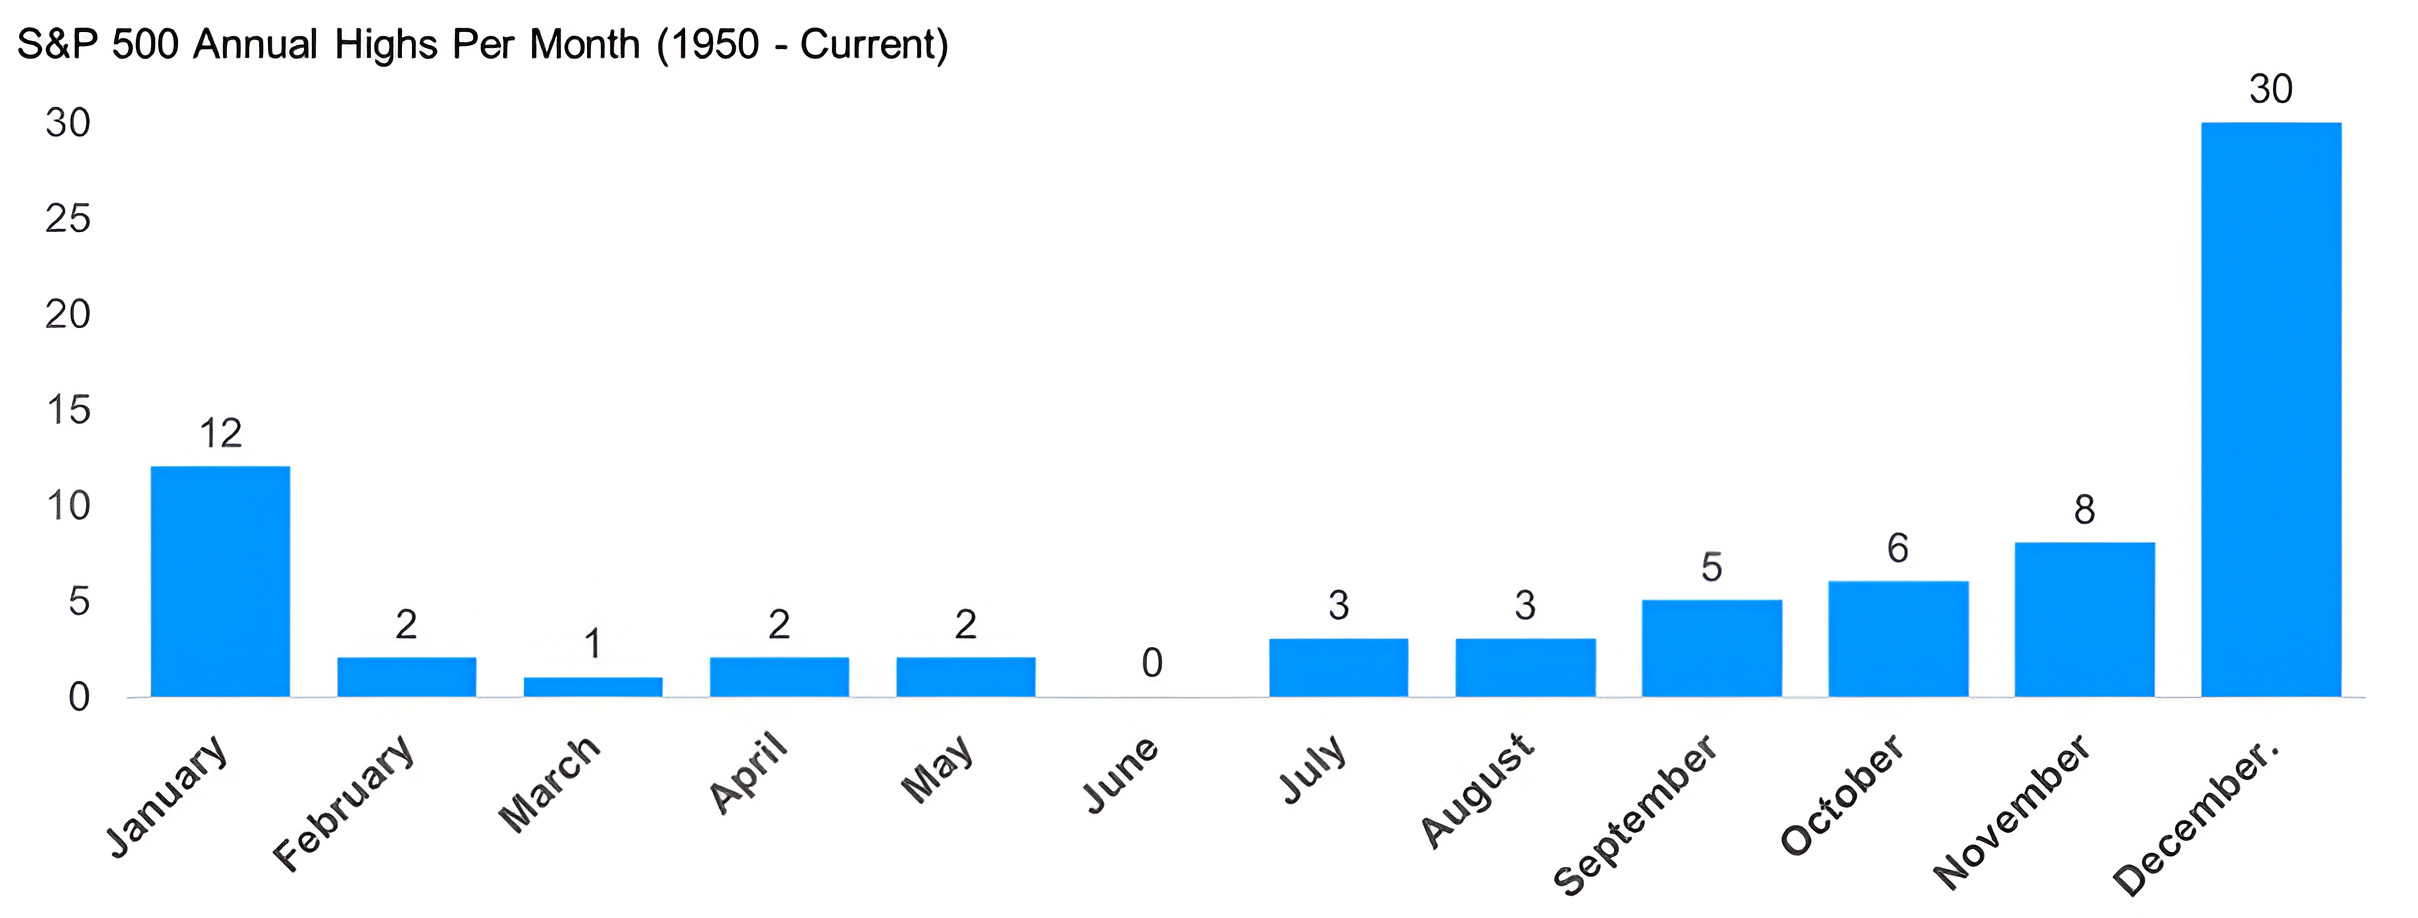
Source: Carson Investment Research / Ryan Detrick. Through year-to-date 2024.
The chart above shows the number of S&P 500 annual highs per month since 1950.
In other words, in what month did the S&P 500 peak for any given year.
While I was surprised to see the number of times (12) that the S&P 500 hit its high for the year in January - it is easy to remember that it recently occurred in 2022.
Interestingly, since 1950, the S&P 500 has not peaked in June.
If this streak were to continue, it would imply that new highs for the S&P 500 are still ahead in 2024.
That said, looking closely at the chart, it looks like until 2000, the S&P 500 had not had an annual peak in March - until it did. Interestingly, it has not peaked in March since.
(Past performance is not indicative of future results. This is not a recommendation to buy or sell any security and is not investment advice. Please do your own due diligence).
4. A Concentrated Market

Source: Goldman Sachs / FactSet. Through year-to-date 2024.
The chart above shows the weight within the S&P 500 of the largest market cap company (light blue line); the three largest combined (black line); and the ten largest (dashed blue line).
The largest ten companies in the S&P 500 (the Magnificent 7 + 3) account for 27% of the index. The other 490 companies represent 73% of the index.
While this is nearly “peak concentration” in the S&P 500, we know there are indexes in other countries which are more concentrated.
And although we have indicated that in our view this makes the S&P 500 fragile and reliant on the performance of a relatively small number of companies, it is not indicative of market direction, nor is it a timing tool.
We wanted to show this as we’ve referred to it from time to time (and we like to show rather than tell), but it is important to state that we consider this a condition or characteristic of the current market environment rather than a catalyst for direction.
(This is not a recommendation to buy or sell any security, please do your own research).
5. Checking in On Chinese Internet Shares
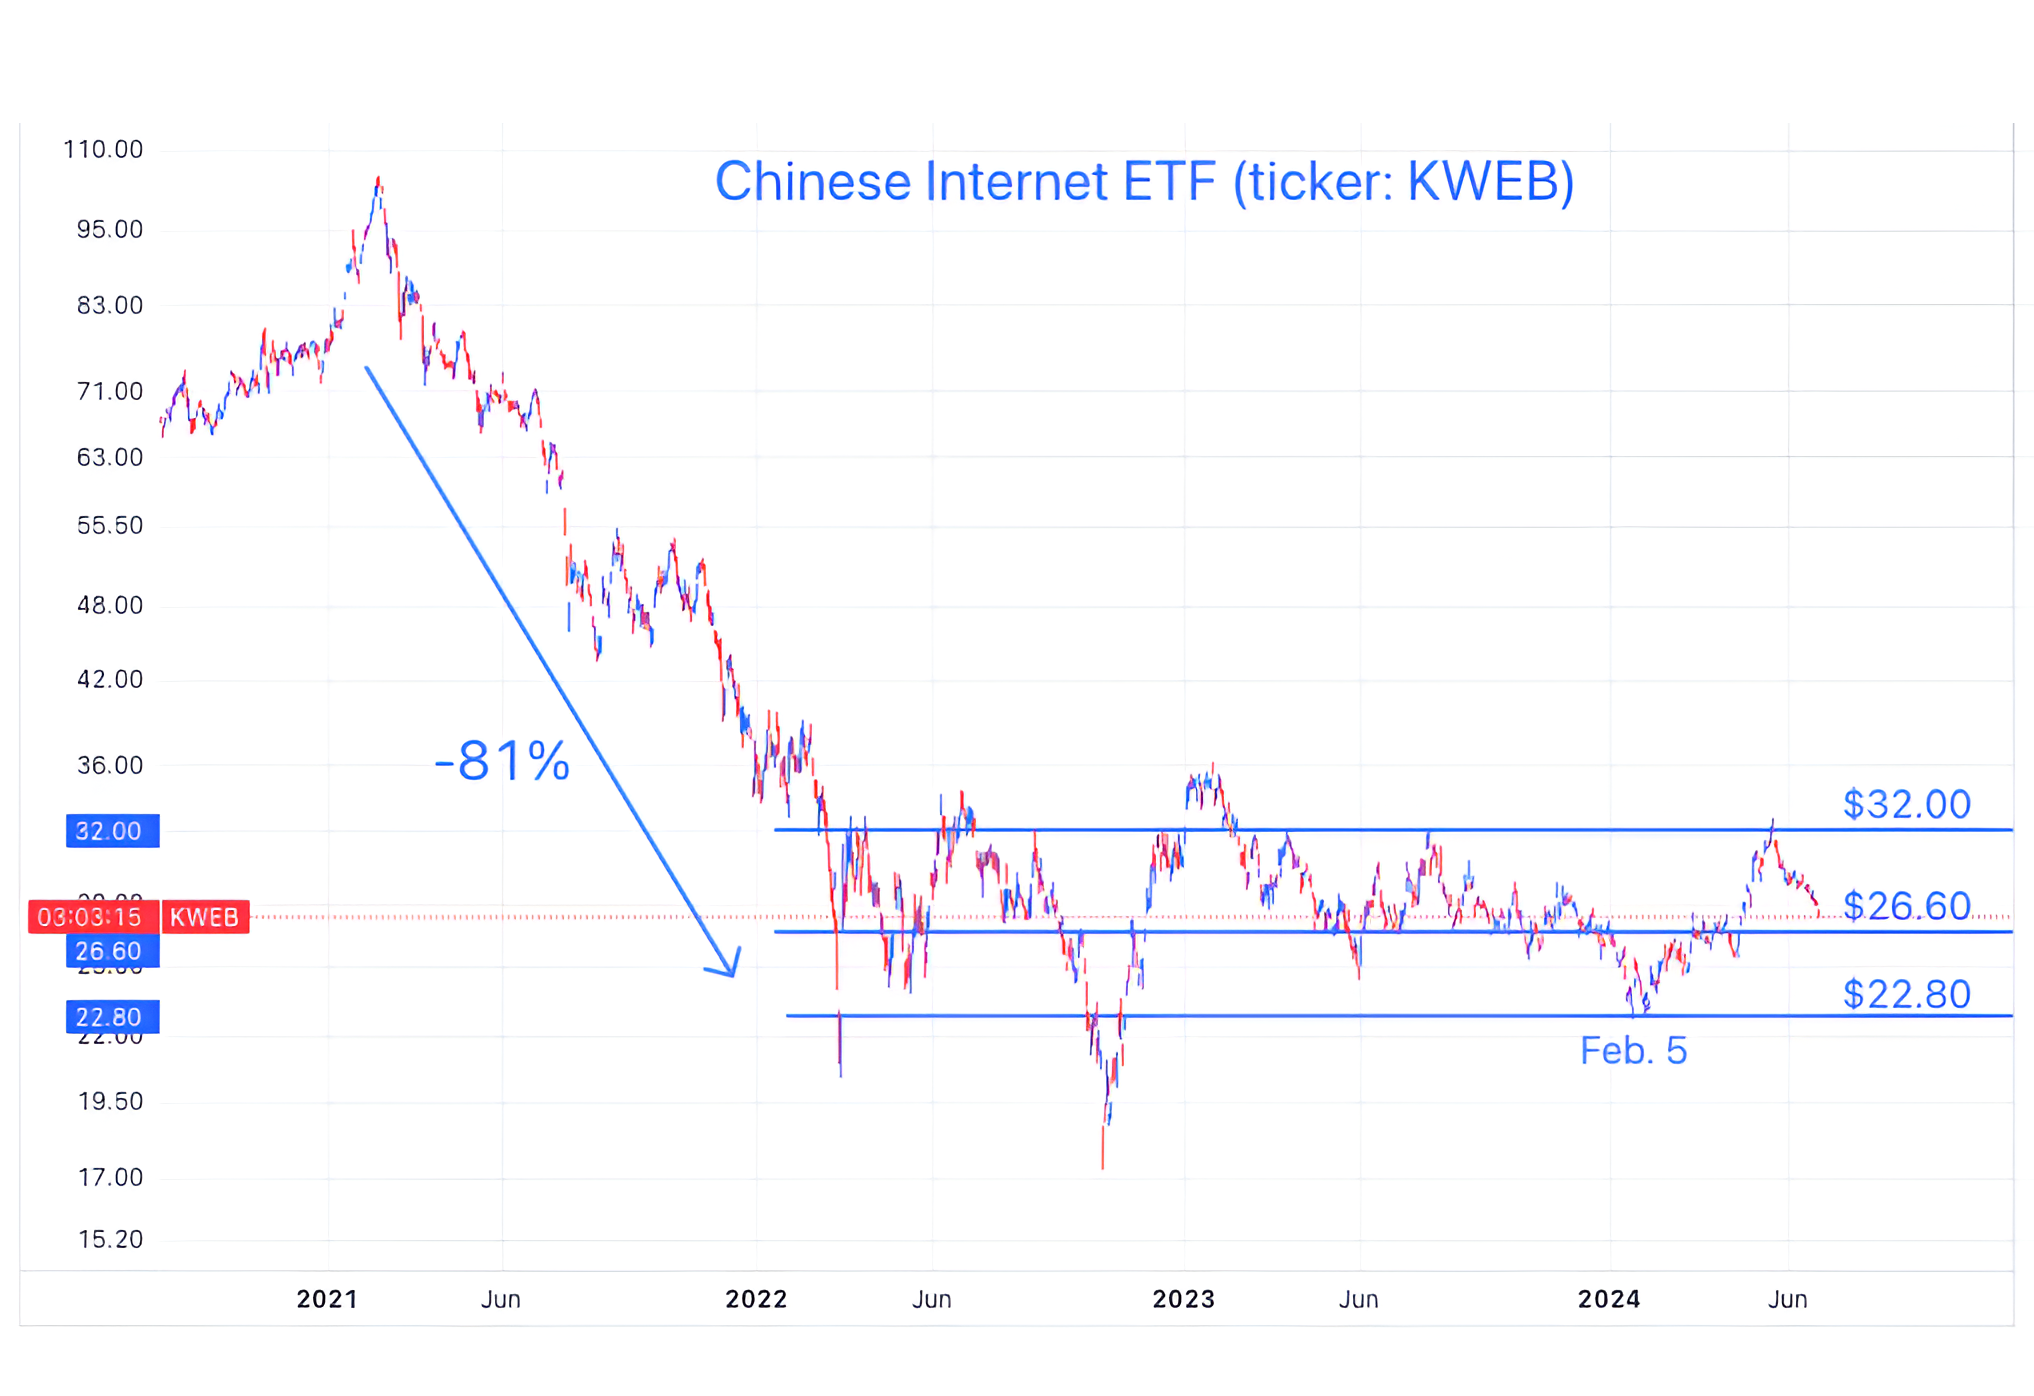
Source: TradingView. Through year-to-date 2024.
When we last showed the Chinese Internet ETF (ticker: KWEB) (here), it was approaching the $32 target that we had identified in early February (here).
As the Chinese Internet ETF is now trading back to the $26.60 level (it is currently at $27.30) that has been a battleground for the past two years, we want to see how it reacts.
In our view, it is likely that the $26.60 area will “hold” and nimble investors may consider viewing Chinese Internet as a opportunistic tactical trade again.
Due to travel and the US holiday next week - I will likely publish only once.
Have a great weekend!
(This is not a investment advice and is not recommendation to buy or sell any security).