


Blinded Me With Science
With US payrolls tomorrow, the S&P 500 earnings season two weeks away, and the next Fed meeting a month away, we wanted to focus on micro today and highlight AI capex beneficiaries. Let's dig in...
I recently had a meeting with a family office that was coming from a presentation led by a large, well-known hedge fund.
The hedge fund spent the majority of the presentation talking about AI and the AI “picks and shovels” within its portfolio.
Today, we wanted to highlight those “picks and shovels” and how they relate to the AI stack.
(As an aside, the idea of “picks and shovels” comes from the US gold rush in the 1840s. While there were many people looking for gold, and some found it, the people that often did the best were the ones selling the “picks and shovels” that were used to hunt for the precious metal.)
In charts 3 and 4 today, we show the companies involved in Data Center infrastructure (chart 3) and the AI ecosystem (chart 4).
The engineering and construction companies and energy providers that help build and support data centers and the memory, cloud service and telecomm service providers that facilitate AI will, like Nvidia and other chip makers, be beneficiaries of hyper-scaler capital expenditures (we showed hyper-scaler capex chart 2 here and chart 2 here).
All of that said, compliance is here to remind me to remind you that these are not buy lists or recommendations. Please do your own homework!

1. Where the Test in the Nasdaq 100 Will Likely Occur

Source: Trading View. Through year-to-date 2024.
The chart above shows the Nasdaq 100 ETF (ticker: QQQ).
Unlike the chart of the S&P 500 that we showed on Tuesday (here), the Nasdaq 100 never made it back to its July all-time high.
What we have seen, however, is that since the Nasdaq 100’s January low, the index has established an uptrend based on a series of higher lows (the angled light blue line).
Notably, the August low coincided with the 200-day moving average which, since that time, has continued to move higher towards the uptrend line.
As the 200-day moving average converges with uptrend line, we would not be surprised to see the index move down to test this meeting point.
If that were to transpire, it would happen around the $460 level in the ETF which would represent a 4.0-4.5% move lower from current levels.
Transposing this (at least mentally) to the S&P 500 and our technical view of the chart from Tuesday - a 4.0-4.5% drop in the S&P 500 would move the index meaningfully below the 5620 level that we highlighted (to around 5400).
If this were to occur in the next three to four weeks, it would be consistent with prior October performance after the first nine months of the year have posted 20%+ gains (chart 5).
(This is not a recommendation to buy or sell any security and is not investment advice. Past performance is not indicative of future results. Please do your own research and due diligence).
2. Growth vs. Value…

Source: FactSet. Through year-to-date 2024.
The chart above shows the Russell 1000 Growth relative to the Russell 1000 value.
The relationship is in the same place as it was in mid-February.
From January 2023 to mid-February 2024 and again from April 25 to July 10, Growth dramatically outperformed Value.
However, since July 10, Value has been outperforming and the “winner” of Growth vs. Value for 2024 will likely be determined over the next three months.
While we don’t have a strong view on which style will win:
a) we were surprised when we pulled up this chart that Growth wasn’t dominating value this year (one reason we’re showing the relationship); and
b) we think that stock picking (rather than index allocation) will be a critical component of outperformance going forward.
(Past performance is not indicative of further results. This is not a recommendation to buy or sell any security and is not investment advice. Please do your own due diligence).
3. Data Center Infrastructure

Source: Bank of America. September 2024.
The chart above shows different aspects of Data Centers (that host cloud and AI services) infrastructure and the companies involved.
While it is easy to consider semiconductors, networking equipment and servers when thinking about AI, there are several, less obvious, beneficiaries of the investment in Data Centers.
From generators supplied by companies like Caterpillar, Rolls Royce and Cummins to chillers from Johnson Controls, Trane and Carrier, Data Centers are complex and specialized.
The chart above is not supposed to be a comprehensive list of those companies involved in Data Center infrastructure, but should serve as a thought provoking starting point for potential investment consideration.
If the hyper-scaler cap-ex boom continues, several of the companies in the chart above could be beneficiaries.
(Past performance is not indicative of future results. This is not a recommendation to buy or sell any security and is not investment advice. Please do your own due diligence).
4. The AI Ecosystem
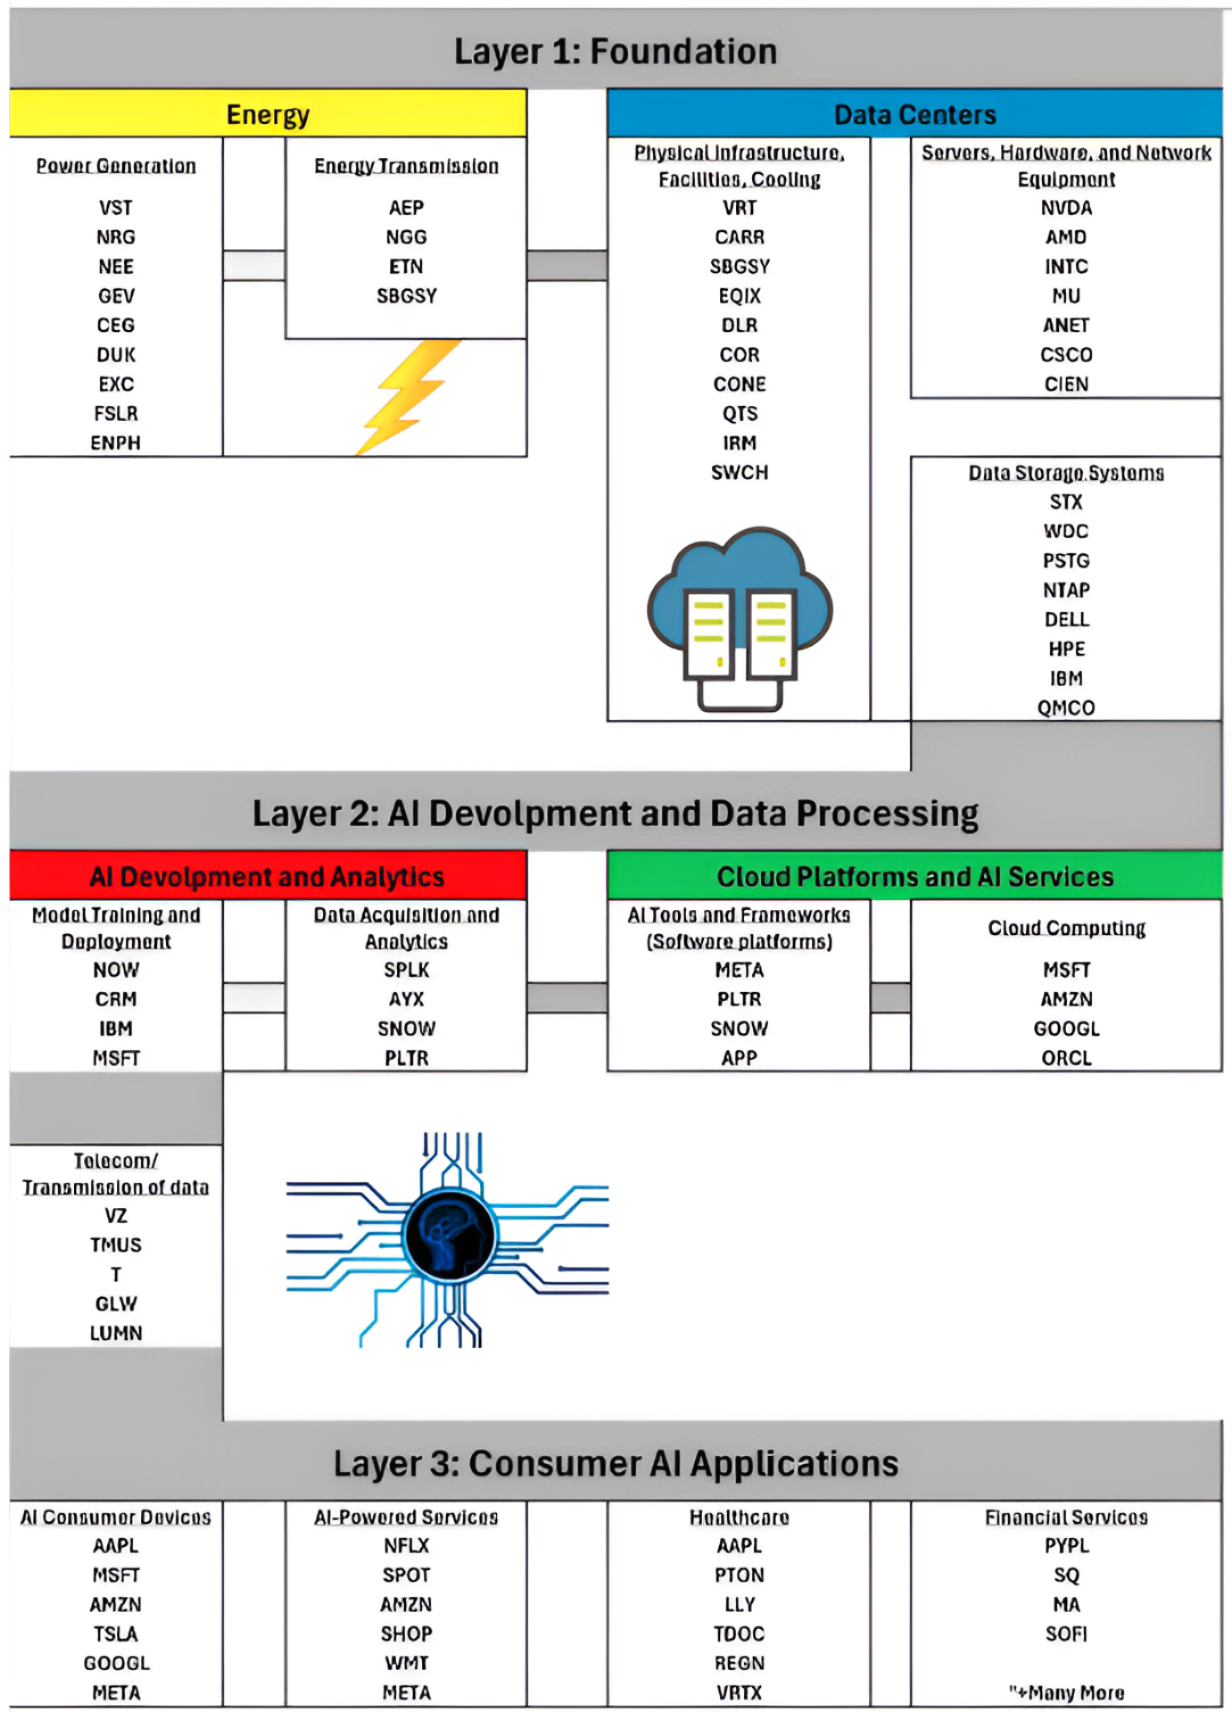
Source: Josh Darwin. September 2024.
The chart above provides a graphical representation of AI infrastructure from its foundational layer (including energy providers and data centers) down to consumer application providers.
While this has some overlap with the Data Center in chart 3, for the most part, it is complementary.
Again, this chart is not supposed to be a comprehensive list of those companies involved in AI infrastructure, but should serve as a starting point for potential investment consideration.
If there are any challenges seeing the company names in chart 3 or the symbols in chart 4, or if there are any other questions, please do not hesitate to respond to this email and I will try to provide clarity.
(Past performance is not indicative of future results. This is not a recommendation to buy or sell any security and is not investment advice. Please do your own due diligence).
5. Could October Volatility Set the Stage for a Year-End Rally?

Source: Carson Investment Research / Ryan Detrick. Through year-to-date 2024.
The chart above shows the October and Q4 S&P 500 returns in the nine previous years since 1954 that the S&P 500 was up more the 20% during the first nine months of the year.
Historically, after strong performance in the three quarters, the S&P 500 has paused in October as the month on average has been down 3%.
That said, in eight of the nine previous 20%+ starts to the year, November and December have had positive returns and Q4 overall has averaged +4% despite the soft start during October.
(Past performance is not indicative of future results. This is not a recommendation to buy or sell any security, please do your own research).