


What's Going On?
We will address the election (and the debate) in the future. For now, we wanted to try to understand a complicated first half and consider where markets might go from here. Let's dig in...
Within the US economy and equity market, there seem to be two parallel and, at times, contrary narratives and realities.
We have continued to try to describe this both in our introductions (as an example see here) and in the charts themselves.
In the US, lower-income and upper-income households are experiencing differing realities. We described this when we showed the inflation expectations chart (chart 4 here).
Within equities, the Nasdaq 100 and the average S&P 500 stock are on different paths.
The Nasdaq 100 (chart 1, below) seems immune to gravity while the Equal Weight S&P 500 (the average US stock) is battling its 2022 high and has had no return in 30 months (chart 1 here). (We also showed the relative performance between the Nasdaq 100 and the Equal Weight S&P 500 in chart 1 here.)
Furthermore, we highlighted the valuation divergence between the (typical) S&P 500 and the Equal Weight S&P 500 (chart 4 here).
How do we reconcile this or at least try to explain it?
The Nasdaq 100 is benefitting from the emergence and spend on AI while the the Equal Weight S&P 500 is reflecting the “real” economy that is slowing down and constrained by tighter monetary policy.
The US hasn’t fallen into a recession most likely because of fiscal spending and stimulus from the Treasury that we have characterized as “stealth liquidity” (see here, here, here, here, chart 4 here and here).
The Nasdaq 100 is immune to the “real economy.”
The largest global “platform” companies are using their balance sheets to fund an arms race to own the next great platform or platforms.
The current platforms are: desktop operating systems (Microsoft); mobile operating systems (Apple, Google); social media (Meta / Facebook, Bytedance / TikTok); cloud (Amazon, Microsoft, Google); streaming (Netflix); electric vehicles (Tesla); and internet search (Google).
Each vertical is at best an oligopoly that comes along with influence, pricing power and earnings.
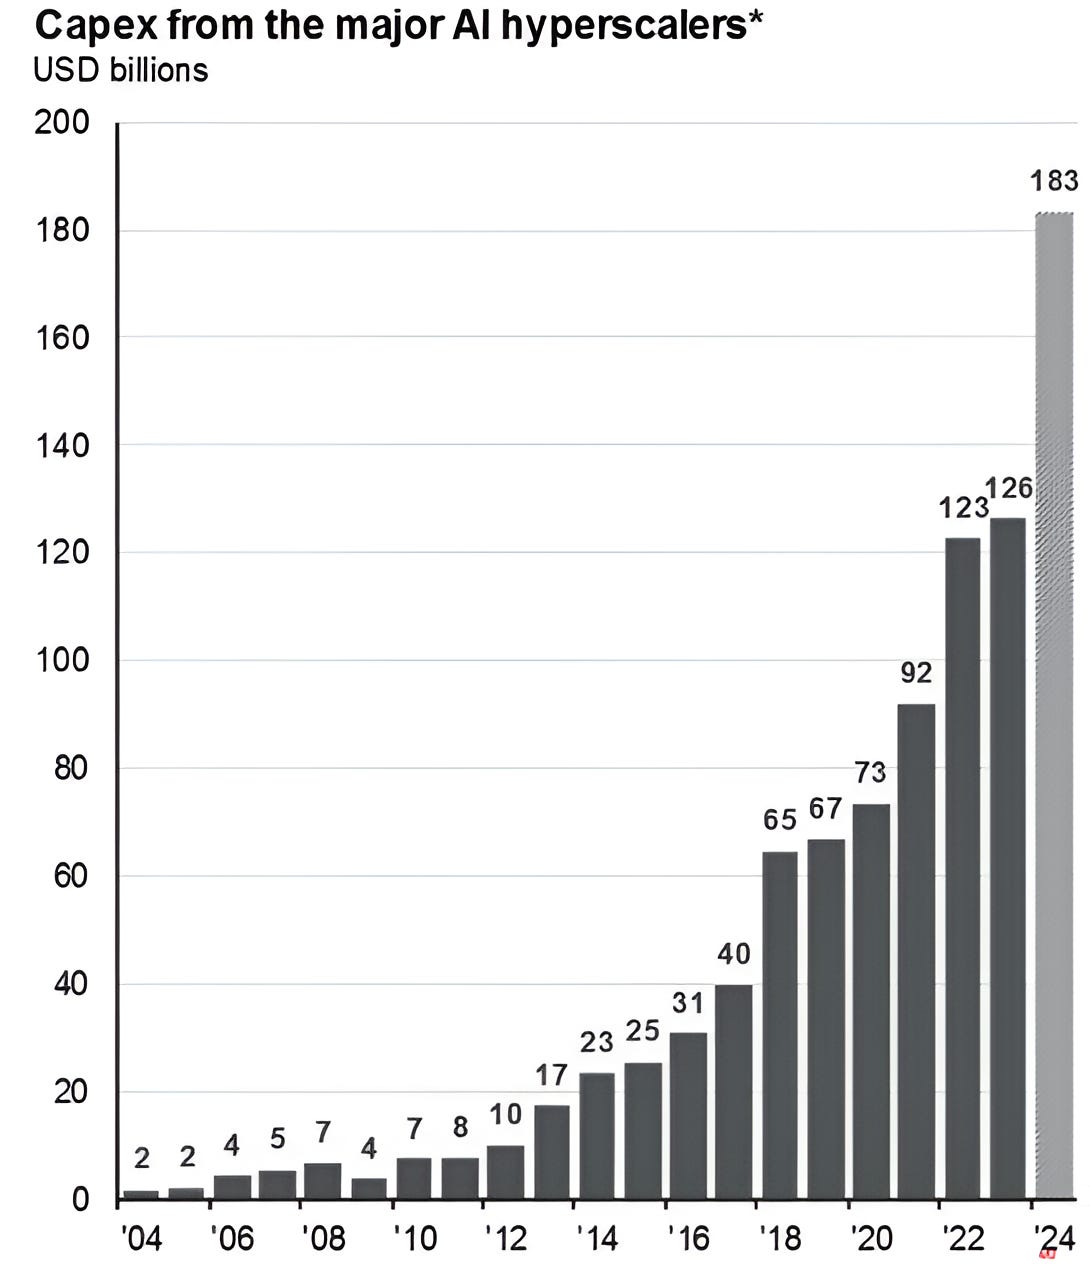
Does it make sense to invest $183 billion in NVIDIA chips and capex? (see chart 2, below).
For the big players yes.
They are funding a parallel economy in search of the next great business model supported by AI.
The ultimate details of the AI vision may not be clear, but each of the current leaders wants to own the next generation whatever it happens to be: the metaverse (augmented or virtual reality); electric / autonomous driving; robotics; medtech or other.
There will also be auxiliary services that benefit from innovation. These are also being funded outside of the “real economy.”
These are the next wave of cloud analytics companies, security companies, apps, programs, influencers and ad tech.
These auxiliary businesses - in the current cycle energy, data centers, memory, infrastructure - are like the pilot fish that swim around sharks. They benefit from the shark, but the large companies are competing to be the shark.
The market is constantly evaluating this. Will this work? Is it a bubble? Will the spending pay off? How much time do we give it?
Against this dynamic of an AI arms race and incredible capital spending, there is an economy that is still dealing with the ripple effects of a Chinese slowdown, Fed tightening, the post-covid hangover, and increasing geo-political tensions.
That is the tug of war being played out in the global economies, politics and equity markets.
Within this context, we continue to see upside in the S&P 500 (here):
In our view, the rally will continue for the next 3-9 months driven by technicals and seasonality and supported by stealth liquidity and the expectation of improving fundamentals.
While our S&P 500 target is 5500, it is possible in a blow-off top type scenario that the S&P 500 could move to 5600 or even 5800.
However, We continue to believe that at some point, the “bill will come due” in this market and a more extreme correction (~30%) will take place.
In our view, this is likely to occur within the next 6-18 months.
1. The Nasdaq 100: Nearing Our Near-Term Target
Source: TradingView. Through year-to-date 2024.
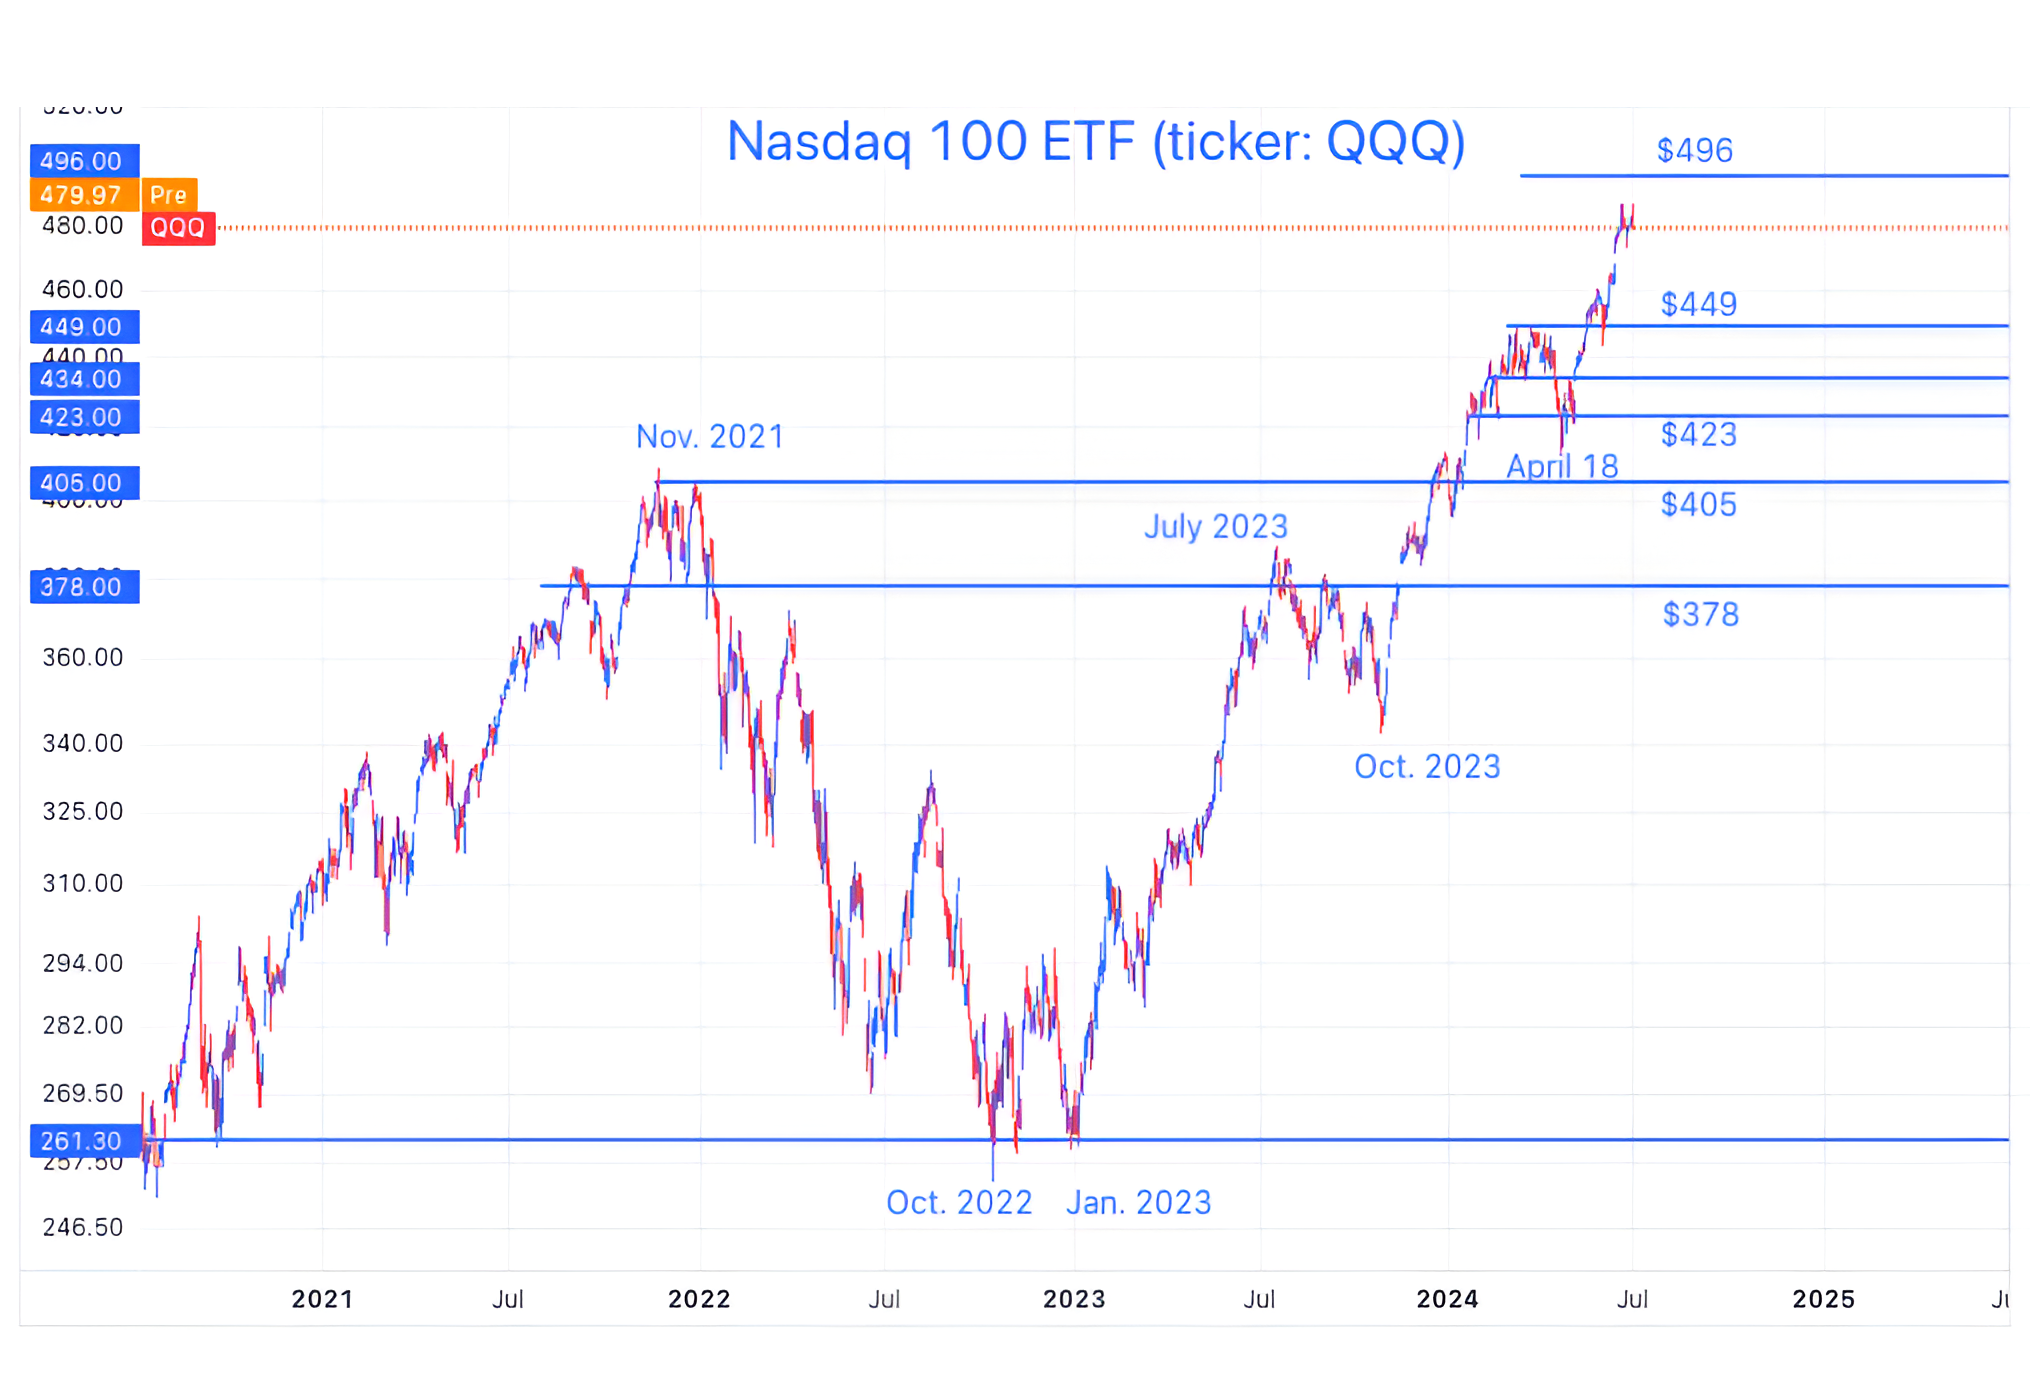
The last time we showed the Nasdaq 100 ETF (here) at the beginning of June it had developed a challenging technical formation called a “bearish engulfing pattern.”
Despite this, we said:
“Given our constructive view of equity markets through year-end, we could see the current “bearish engulfing candle” as foreshadowing some downward and frustrating “chop” through the month.
If this is the case, we would try to be opportunistic.
For the time being we would put this condition in our things to be aware of basket rather than our things to react to basket.”
In retrospect, the bearish engulfing pattern did not foreshadow any downward pressure or frustrating chop.
In fact, the Nasdaq 100 continued to climb steadily throughout the month.
At this point, the Nasdaq 100 ETF is nearing our target of $496 which is 3.5% higher than last Friday’s closing level.
Similar to our S&P 500 target, our Nasdaq 100 target reflects the 1.618 extension of the November 2021 to October 2022 sell-off.
Could the Nasdaq 100 move a little above our target?
Absolutely, but our expectation is that there will be a pause and at least a minimal retracement from around that zip code.
As stated above, we continue to be constructive through year-end 2024, and after a pause /fight in the $496 area, the Nasdaq 100 can trade above that level.
However, this will largely be dependent on the sustainability of earnings, earnings growth and expectations. Q2 earnings season begins in two weeks.
(This is not a recommendation to buy or sell any security and is not investment advice. Please do your own research and due diligence).
2. The AI Arms Race to Own the Next Big Platform
Source: Mike Zaccardi. Through year-to-date 2024.
The chart above shows the Cap Expenditures from the AI hyper-scalers.
In general, the major hyper-scalers include Meta (Facebook); Alphabet (Google); Amazon; Microsoft and Apple.
We showed a similar chart (chart 2 here) two months ago and wrote about data center electricity consumption last week (chart 2 here).
There are two things to consider:
First, how much more can this spending grow. At best growth will slow (2nd derivative).
Second, although the hyper-scalers have strong balance sheets, impressive cash flows and ability to fund capex, at some point, investors will likely consider whether the payoff is worth the investment.
This is what happened in the dot-com cycle and when Facebook began to spend excessively on the metaverse. In the dot-com era capital dried up and with Facebook and the Metaverse investors ran out of patience.
That being said, despite being rationalized, the dot-com era clearly led to some of the world’s largest companies and greatest innovation.
In other words, despite volatility, the investment led to a payoff (eventually).
We believe the current AI period could be similar in that the pay-off from AI investments may take longer than some are currently forecasting, there may be volatility in the meantime, but the innovation will be significant.
(This is not a recommendation to buy or sell any security and is not investment advice. Please do your own due diligence).
3. Growth vs. Value

Source: TradingView. Through year-to-date 2024.
The chart above shows the Russell 1000 Growth relative to the Russell 1000 Value.
We last showed this three weeks ago (here) when the relationship had “retested” (bounced off of) its September 2020 to January 2024 ceiling and began to surpass its February 12 high.
At the time we said that “while we would continue to emphasize growth in portfolios, we would not ignore value.”
While we may have been a little early with that call, as Growth’s performance looks a little stretched vs. Value’s, we would continue to consider diversifying portfolios.
Some value sector considerations:
In the aftermath of Trump’s 2016 Presidential election, Financials and Industrials were out-performers.
We have highlighted the Energy sector both for what we believe to be attractive dynamics and an inflation hedge.
And Healthcare, as a sector, has recently moved above its 3-year range and looks poised for further upside.
(Past performance is not indicative of future results. This is not a recommendation to buy or sell any security and is not investment advice. Please do your own due diligence).
4. What Has Happened After a Strong First Half?

Source: Carson Research / Ryan Detrick. Through year-to-date 2024.
The chart above shows the S&P 500 returns in years when the index has increased 10% or greater in the first half of the year.
What I found interesting about this chart - other than the 7.7% average second half return - is the cadence of the returns.
Looking closely, historically, the next quarter (the 3rd quarter) has been up on average 1.5%.
This means that the majority of the 2nd half gains in 10%+ first half S&P 500 years have come in Q4.
This is consistent with what we have typically seen in US presidential years as the market has paused in advance of the election and has rallied at the end of the year with the election outcome having been determined.
We will see if 2024 follows the historical path.
(Past performance is not indicative of future results. This is not a recommendation to buy or sell any security, please do your own research).
5. The First Two Weeks of July Have Been the Strongest Half Month for the S&P 500
Source: Goldman Sachs. Through year-to-date 2024.
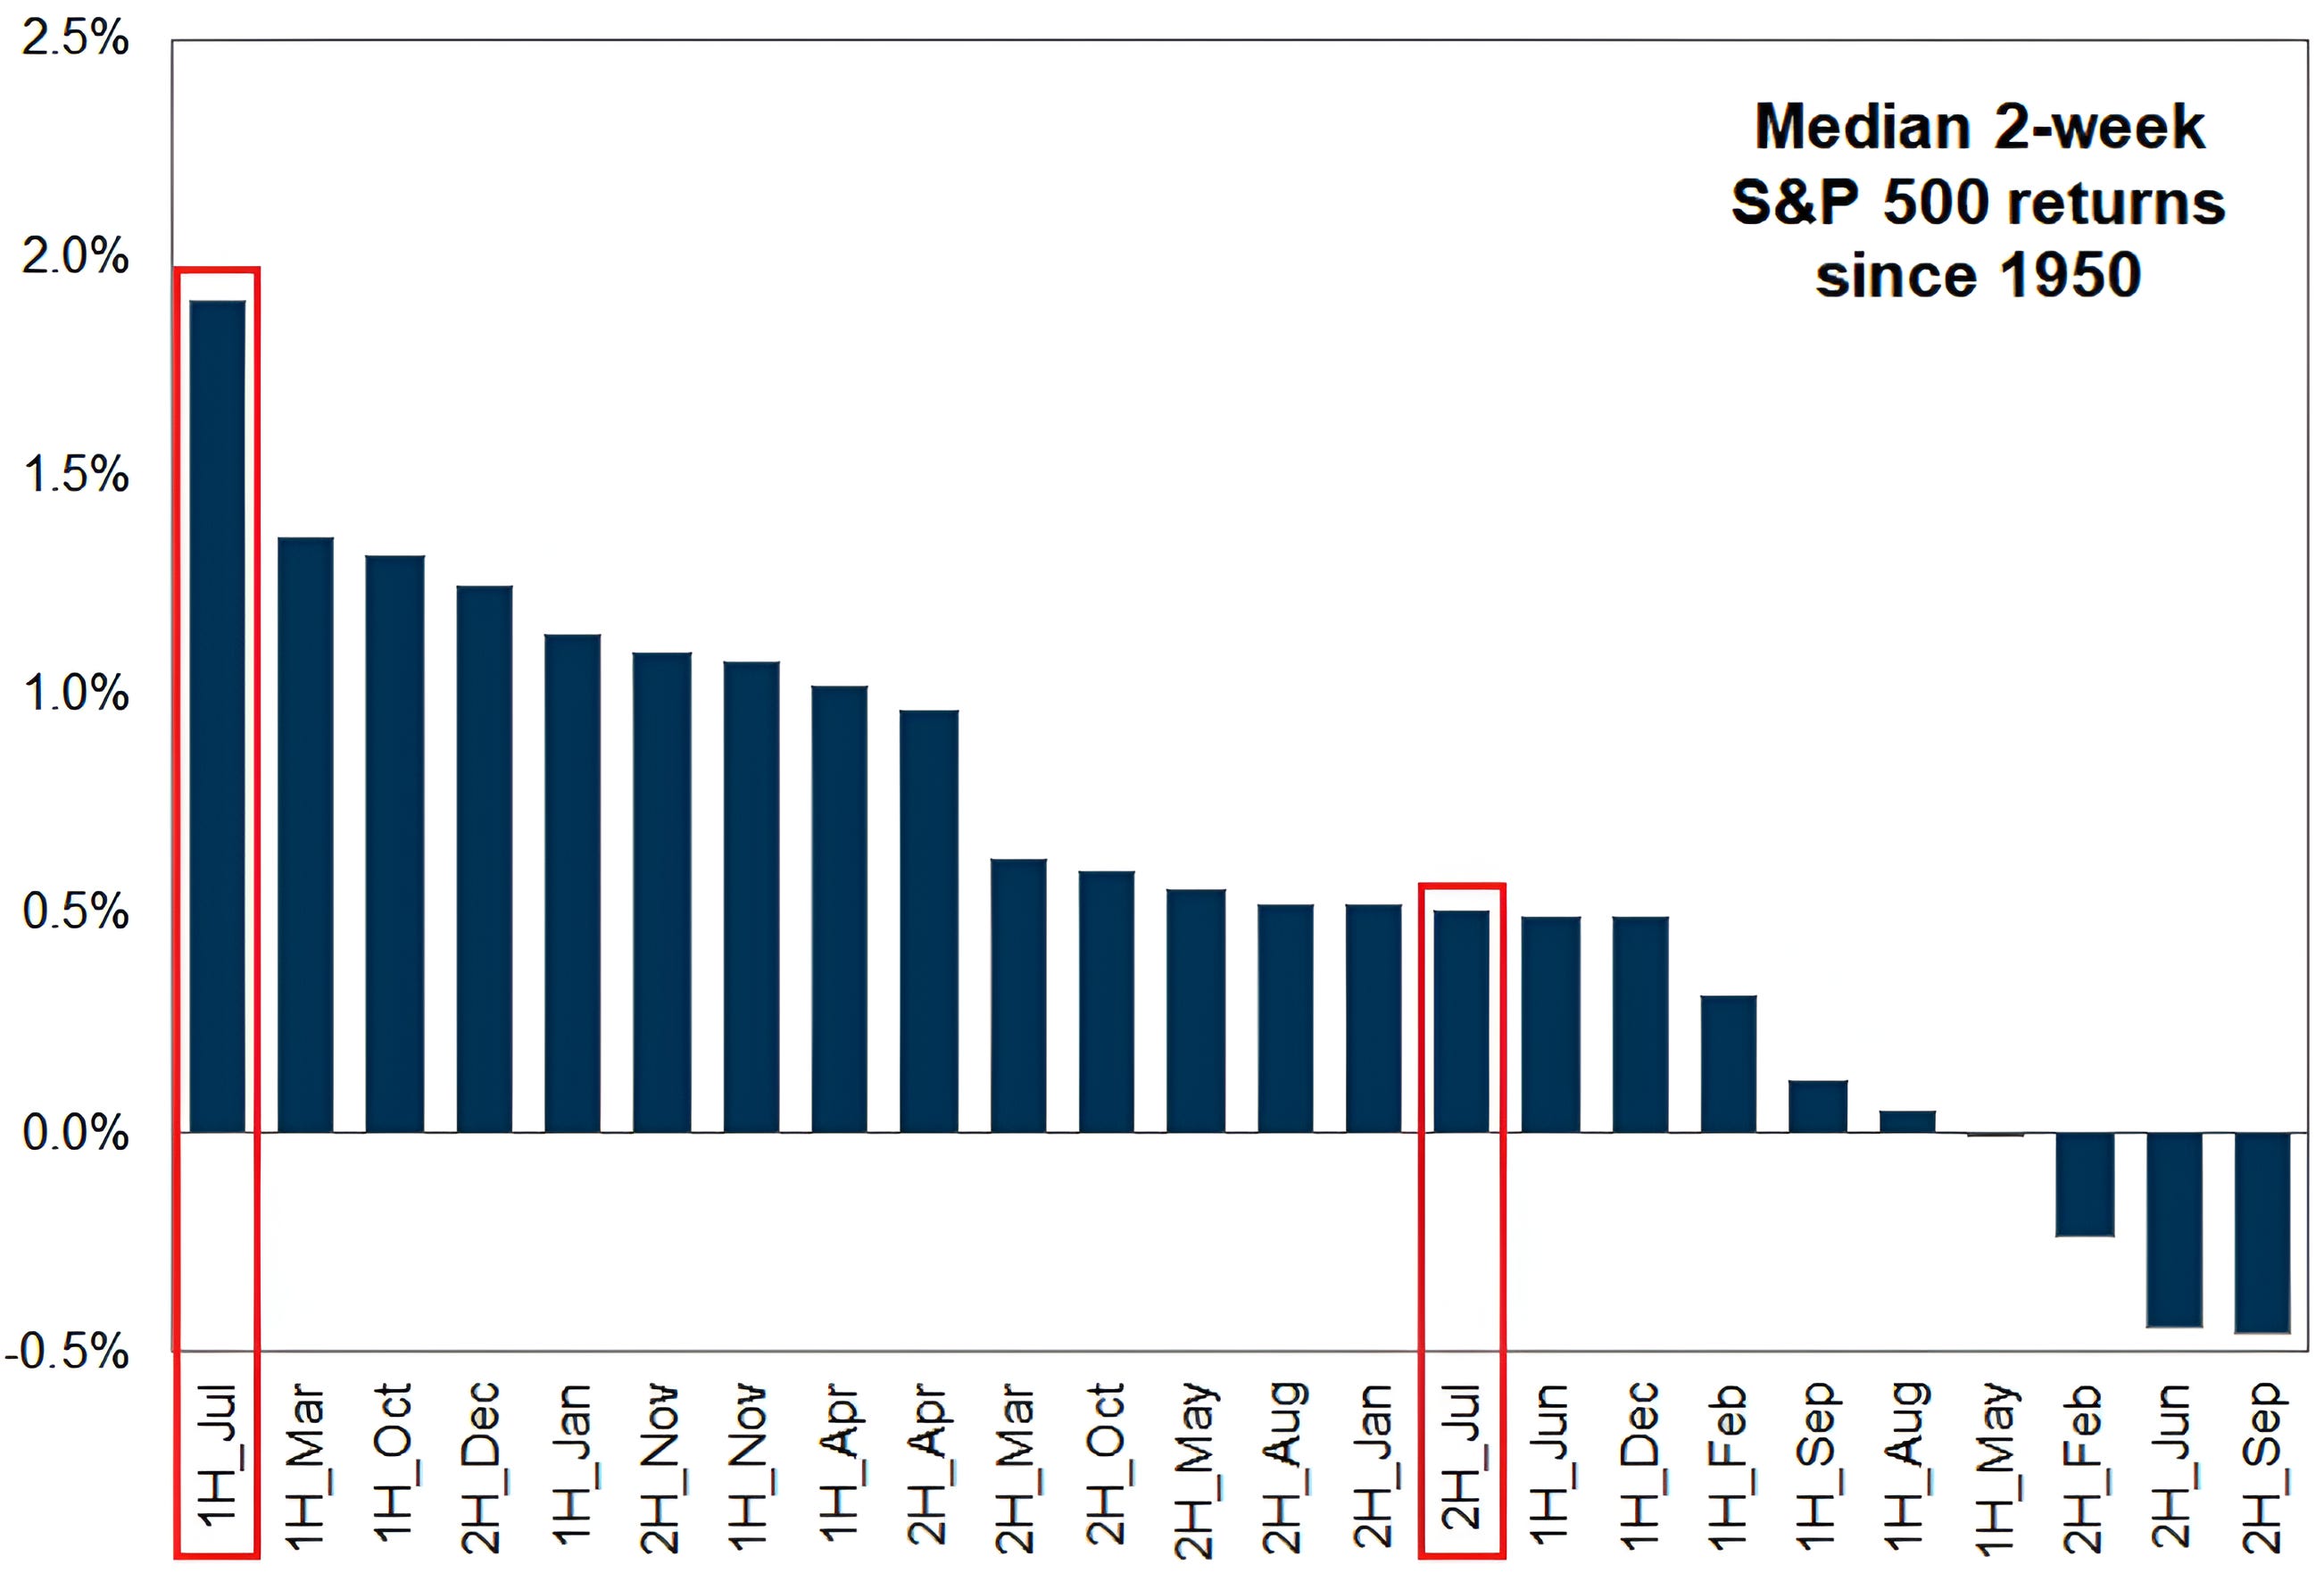
The chart above shows the median S&P 500 return for each half month of the year since 1950.
The first two weeks of July, on average, have had the strongest return of any first or second half of a month over the last 73 years.
We showed a different seasonality chart (chart 5 here) that focused on year 4 of the US election cycle.
As we always caution, past performance is not indicative of future results.
Looking at the chart above, on average, the first half of April has been one of the better performing periods. This year, the first half of April may have been the only two week period with negative performance.
We would also note - looking at the chart - that the second half of June has historically been the second worst period. This year it was up 0.6%.
We will see what July has in store.
(This is not a investment advice and is not recommendation to buy or sell any security).