


Money for Nothing
With the Fed expected to start an easing cycle tomorrow, we wanted to revisit our theme of "stealth liquidity." Could Fed and Treasury stimulus work together to lift equities in 2025? Let's dig in...
As the S&P 500 moved well above my expectations in 2023 and has consistently moved higher thus far in 2024, despite:
quantitative tightening;
modest earnings growth;
premium valuations (not as high as today, but around 1 standard deviation above long-term averages);
higher for longer Fed Funds;
and elevated 10-year yields,
I have tried to understand why.
Other than the past two years, each time since 2008 that the Fed has tried to shrink its balance sheet (Quantitative Tightening), it has coincided with equity market volatility. I detailed this in chart 5 here .
Why has this time been different?
My conclusion (or theory), as I have consistently tried to detail, is that “stealth liquidity” provided by the Treasury through the use of its General Account (the “TGA” - see chart 2), Reverse Repos and the issuance of T-bills (short-term) rather than Notes (long-term) has offset the Fed’s tightening and driven US equity markets higher.
“Stealth liquidity” has been a consistent them of ours starting here (eight months ago exactly) and more recently here, here, here, here, here, chart 4 here and here.
(It should be noted that aggressive fiscal stimulus has also played a role in off-setting restrictive monetary policy but, as investing legend Stan Druckenmiller says, “It's liquidity that moves markets.”)
With the Fed set to announce its first rate cut in 4.5 years, it would be easy to think that “stealth liquidity” may be giving way to “traditional liquidity” and we can “retire” the theme. However, we still believe that “stealth liquidity” may be a key to achieving a soft-landing and could remain a key pillar of equity market performance through 2025.

Screenshot from Dire Straits’ “Money for Nothing” music video.
1. The S&P 500: We Are So Back!

Source: Trading View. Through year-to-date 2024.
The chart above shows the S&P 500 ETF (ticker: SPY).
We showed this chart the two weeks ago (here), which was the last time the S&P 500 ETF was in the 562 (record high) neighborhood.
We always find it notable that when an index lands at an important level at a critical time:
The S&P 500 (and the ETF in the chart above) are sitting in the range of their respective all-time highs;
Both are at the 1.618 Fibonacci extension of their 2022 sell-offs (we first highlighted this (using the S&P 500 rather than the ETF) in early June (here) and this level continues to be a magnet);
Both the S&P 500 and the ETF have visited this area twice and have been unable to advance further;
And, as we know, the Fed is set to change policy tomorrow .
Whether the Fed cuts rates by 0.25% or 0.50% (I discuss this in chart 4), there is a 70-80% chance in our view that they will achieve a soft landing.
(There is a 20-30% chance they’re too late and the S&P 500 has a 30% sell-off. We highlighted this in the introduction here).
In addition to the Fed, it may be that, in 2025, the Treasury could once again provide “stealth liquidity” to the economy through the use of its General Account (“TGA”). (See charts 2 and 3).
With the help from both the Fed and Treasury, it is possible that the 2025 soft-landing could be more robust than we have previously considered.
In a soft landing scenario, analysts will begin looking at 2026 S&P 500 earnings of at least $300-310 (regardless of whether 2025 earnings are achievable).
With a 20x forward PE (where the S&P 500 is trading today), it is possible to see 6000-6200 (6-10%) as achievable (600-620 on the ETF).
Our view, in this scenario, would likely be 6100 (+8%) on the S&P 500.
This would be consistent with many of the technical and historical analogs that we often provide (including charts 4 and 5 today).
(This is not a recommendation to buy or sell any security and is not investment advice. Please do your own research and due diligence).
2. The Fed + Treasury in 2025: Shock and Awe!
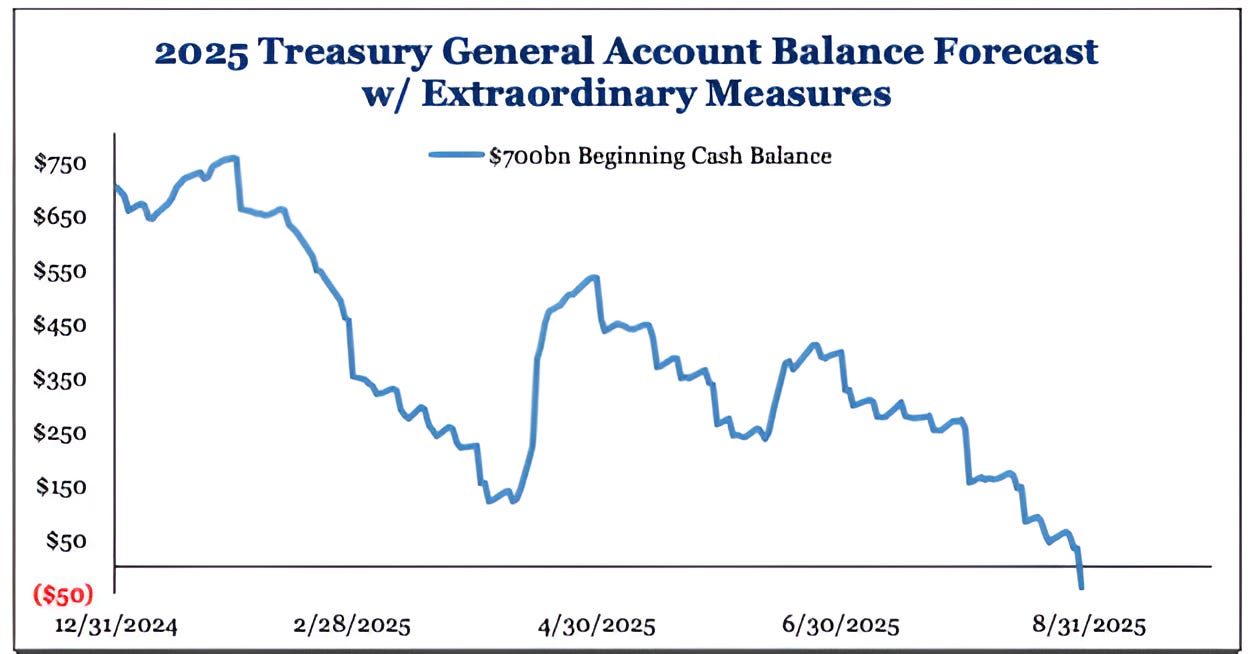
Source: Strategas. Through year-to-date 2024.
The chart above shows the projected path of the Treasury’s General Account (“TGA”) as expected by Dan Clifton, the chief policy analyst at Strategas (the best on the street in our view).
Regardless of who wins the US Presidential election, the US government will hit its debt ceiling in January 2025. When that happens, no new net debt will be allowed to be issued.
Similar to 2023, the US government rely on the Treasury to pay its bills out of its General Account.
According to Clifton, “Congress will not need to act [to lift the debt ceiling] until August, which means the US government will be increasing net liquidity for eight consecutive months via the TGA.”
The TGA will start the year with $700-750 billion and given the expected path of the fiscal deficit, Clifton expects the entire amount and then some being used by the end of August.
At the same time, it is expected that the Fed will continue its easing cycle and the consensus expects the Fed to end Quantitative Tightening at the end of Q1.
In 2023, when the Treasury was using its General Account, Reverse Repos and later financing the government with bills (short-term) rather than notes (long-term) (combined = “Stealth Liquidity”), Fed policy was restrictive (higher for longer Fed Funds and Quantitative Tightening).
If Dan Clifton’s view is correct that the Treasury will drain its General Account at the same time the Fed is cutting rates and ending QE, this could be a liquidity firehose that supports the economy and equity markets.
(Past performance is not indicative of further results. This is not a recommendation to buy or sell any security and is not investment advice. Please do your own due diligence).
3. Gold Agrees with the 2025 Liquidity Shock and Awe Thesis
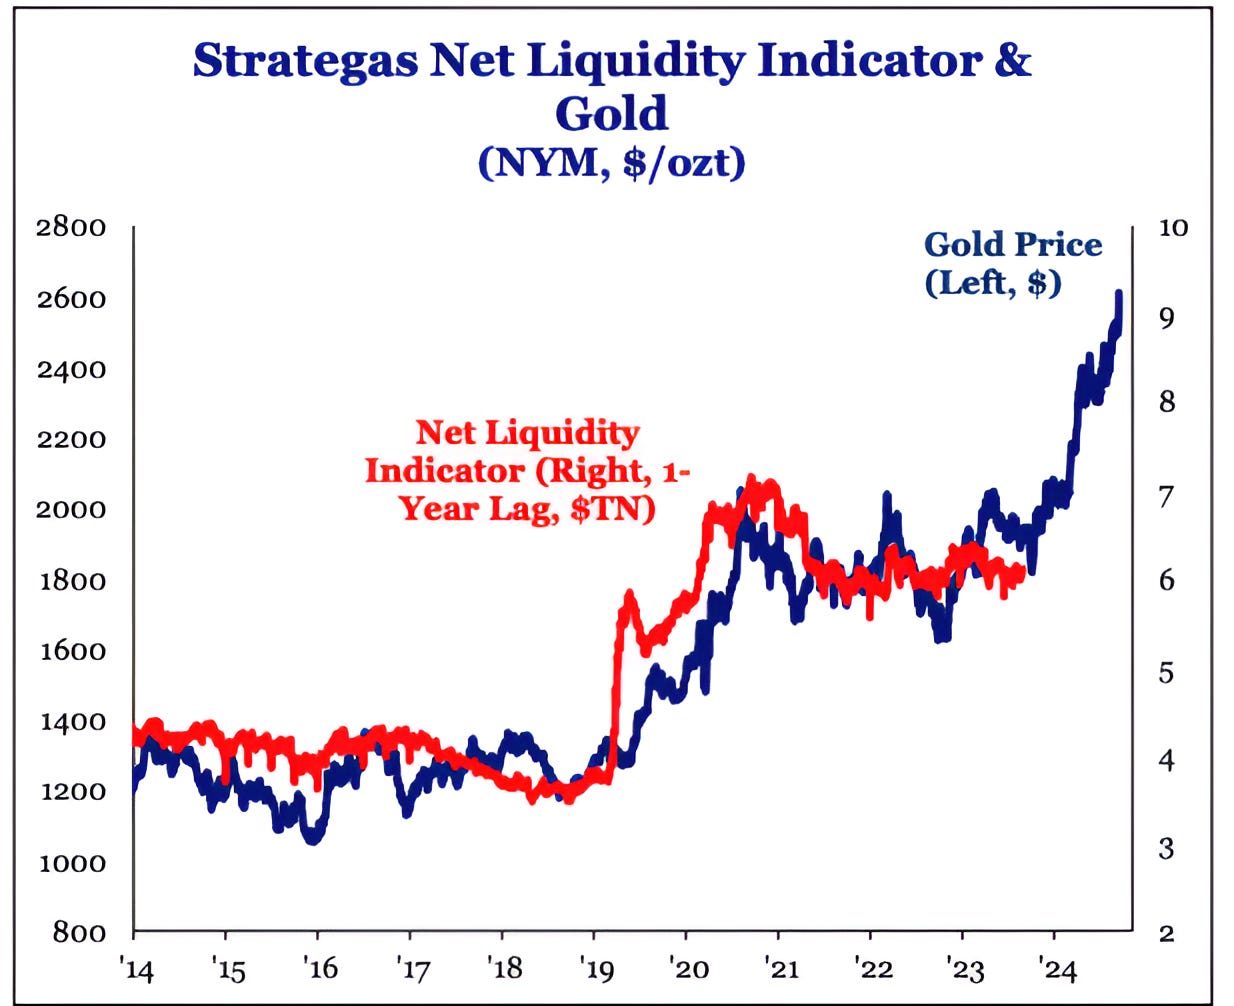
Source: Strategas. Through year-to-date 2024.
The chart above shows the price of Gold (blue line) and Strategas’ Net Liquidity Indicator (red line) with a one-year lag.
The Net Liquidity Indicator is an aggregate of the moves in the Feds balance sheet from quantitative easing / tightening; the Treasury’s General Account; and Reverse Repo operations.
The price of Gold has led liquidity by one year and the jump in gold prices over the past 12 months may be foreshadowing a big increase in liquidity in 2025.
This is consistent with the end of Quantitative Tightening in Q1 and the use of the Treasury’s General Account that we highlighted in chart 2.
(Past performance is not indicative of future results. This is not a recommendation to buy or sell any security and is not investment advice. Please do your own due diligence).
4. S&P 500 Performance Around Rate Cuts

Source: Goldman Sachs.
The chart above shows the S&P 500 performance around the start of Fed cutting cycles.
The point is simple, if the economy avoids a recession in the 12 months following a cut, the S&P 500 has been higher by about 10% one year later.
If the US economy falls into a recession within one year following a cut, the S&P 500 on average has dropped 20%.
As neither scenario is statistically significant (five examples of no recession and 3 with a recession), we view this as illustrative rather than predictive.
However, it is notable in our view, that the average “no recession” S&P 500 return of 10% is consistent with the soft-landing scenario (6000-6200) that we highlighted above, while the -20% is a little less than our recessionary view but in the neighborhood.
We also wanted to take this chart - and the mention of the Fed cut - as an opportunity to highlight tomorrow’s Fed decision.
Nick Timiraos from the Wall Street Journal has characterized it well:
“The Fed faces a finely balanced set of considerations over whether to cut by 25 or 50 basis points.
The case for 50 comes down to what Fed officials call risk management but what might be thought of as regret minimization.
Per former Dallas Fed President Rob Kaplan, if you cut 50 here and you think the Fed will need to cut again after that, you are unlikely to regret such a cut even if the economy chugs along between now and your next meeting.
But if you cut 25 and things worsen a lot in the coming weeks, you'll feel bigger regret as you'll be behind the curve.
The case for 25 boils down to some combination of:
process issues (i.e., 50 will signal something more urgent; there's an election soon; communications were not explicit enough about 50 in the run-up to this meeting);
a view that the economy is doing just fine and will continue to do so with more gradual reductions; and
that because financial conditions are easy (in part because markets expect the Fed to deliver a string of cuts), igniting risk assets could make it harder to finish the inflation fight.”
This is the least predictable Fed decision in some time and even if we did know the decision in advance, I am not sure I could predict the near-term equity market reaction.
The point of the chart is that the economy, not the Fed, will likely dictate the medium-term equity market reaction.
(Past performance is not indicative of future results. This is not a recommendation to buy or sell any security and is not investment advice. Please do your own due diligence).
5. Another Historical Analog with Bullish Implications

Source: Carson Investment Research / Ryan Detrick. Through year-to-date 2024.
The chart above shows the times when the S&P 500 has had a week when it was down more than 4% followed by a week when it was up more than 4%.
This has occurred 22 times since 1950 and occurred once again over the last two weeks.
The average one-year return in the previous 22 instances of this signal has been 16% and the S&P 500 has had a positive return one year later 18 times.
However, it should be noted that, similar to the chart that I showed last week of the S&P 500 down more than 1.5% in a session but closing up over 1% (chart 5 here), today’s signal has often occurred near (what in retrospect) is a low and after a sell-off.
As the S&P 500 is near an all-time high and has been trending higher, given these characteristics today’s signal, like last week’s, has historically had more mixed forward returns.
(Past performance is not indicative of future results. This is not a recommendation to buy or sell any security, please do your own research).