


Hello from the Other Side.
Although the post-election US equity relief rally has been strong, in our view, when the dust settles, investors may focus on fundamentals, valuation, interest rates and the deficit. Let's dig in...

Thankfully, the election is over.
Not because I am necessarily pleased with the outcome, but as someone that consumes too much news, I am hoping that the volume is lowered and that will definitely be welcome.
From a market standpoint, Goldman’s estimate that the S&P 500 would rally +3% in the event of of a Trump victory with a Republican Sweep (to which they ascribed a 25% probability) looks somewhat accurate. (We showed this in the introduction on Tuesday here).
Within US equity markets, sector performance has reflexively mimicked the Trump trade of late 2016 and early 2017: Small Caps, Financial and Industrials (cyclicals) all outperformed yesterday.
However, I would note one big difference between 2016 and today.
When Trump won the election in 2016, the S&P 500 was trading at 16.5x next 12 months earnings. Today, it is at 22.6x (higher today than on Tuesday because of the equity rally).
Treasury yields also moved higher yesterday as markets digested the prospect of potentially higher growth, higher inflation and higher deficits (we showed possible deficit scenarios in chart 3 here).
When comparing Treasury yields of 4.37% today to Treasury yields in 2016 of 2.25% (right after Trump won the election), there is a notable difference.
This means that the equity risk premium - the amount that investors are being paid to take equity risk rather than invest in “risk free Treasuries” - is much lower today than it was when Trump won in 2016.
In other words, both the absolute and relative (to Treasuries) valuations of US equities today are much more expensive now than they were in November 2016. While this is not insurmountable, it is a significant headwind.
In our view, regardless of the Fed rate cut, we continue to believe the bond vigilantes will begin to focus on the fiscal deficit and refinancing needs of the government (see chart 3 below) and push longer-term Treasury yields higher.
Combined with top-decile valuations and overly optimistic earnings expectations this will present an equity (and potentially policy) risk.
Since early June (here), we have been writing:
In our view, the rally will continue for the next 3-9 months driven by technicals and seasonality and supported by stealth liquidity and the expectation of improving fundamentals.
While our S&P 500 target is 5500, it is possible in a blow-off top type scenario that the S&P 500 could move to 5600 or even 5800.
That said, we are beginning to see possible cracks in the foundation of the market’s ascent that, in our view, could become more apparent either late this year or in early 2025.
Although it’s a fools errand to try to develop a 6, 12 and 18-month road map for the equity market, we see the possibility (10-15% likelihood) of a 30% sell-off that see the S&P 500 bottom around 4000-4200 in 2025 from a peak of 5500-5800 in 2024.
Since that time, we have increased the probability of a significant sell-off to 20-30% (here), but it is clear that we under-estimated the magnitude of the rally.
We would now call this a 30% chance of a 20-30% sell-off from a level of around 6000 in the S&P 500 leading the index back down to a range 4200-4800.
We see this occurring in the first half of 2025 and, in our view, it will most likely be met with a new round of quantitative easing (they may give it another name - but it will be Fed balance sheet expansion).
We have been careful this year to remain invested even as animal spirits have driven markets (and valuations) higher than our expectations. We don’t want to prematurely react, but we want to be acutely aware of signs.
Hello from the other side!

1. Nasdaq 100 Moves to the Other Side!
Source: Trading View. Through year-to-date 2024.
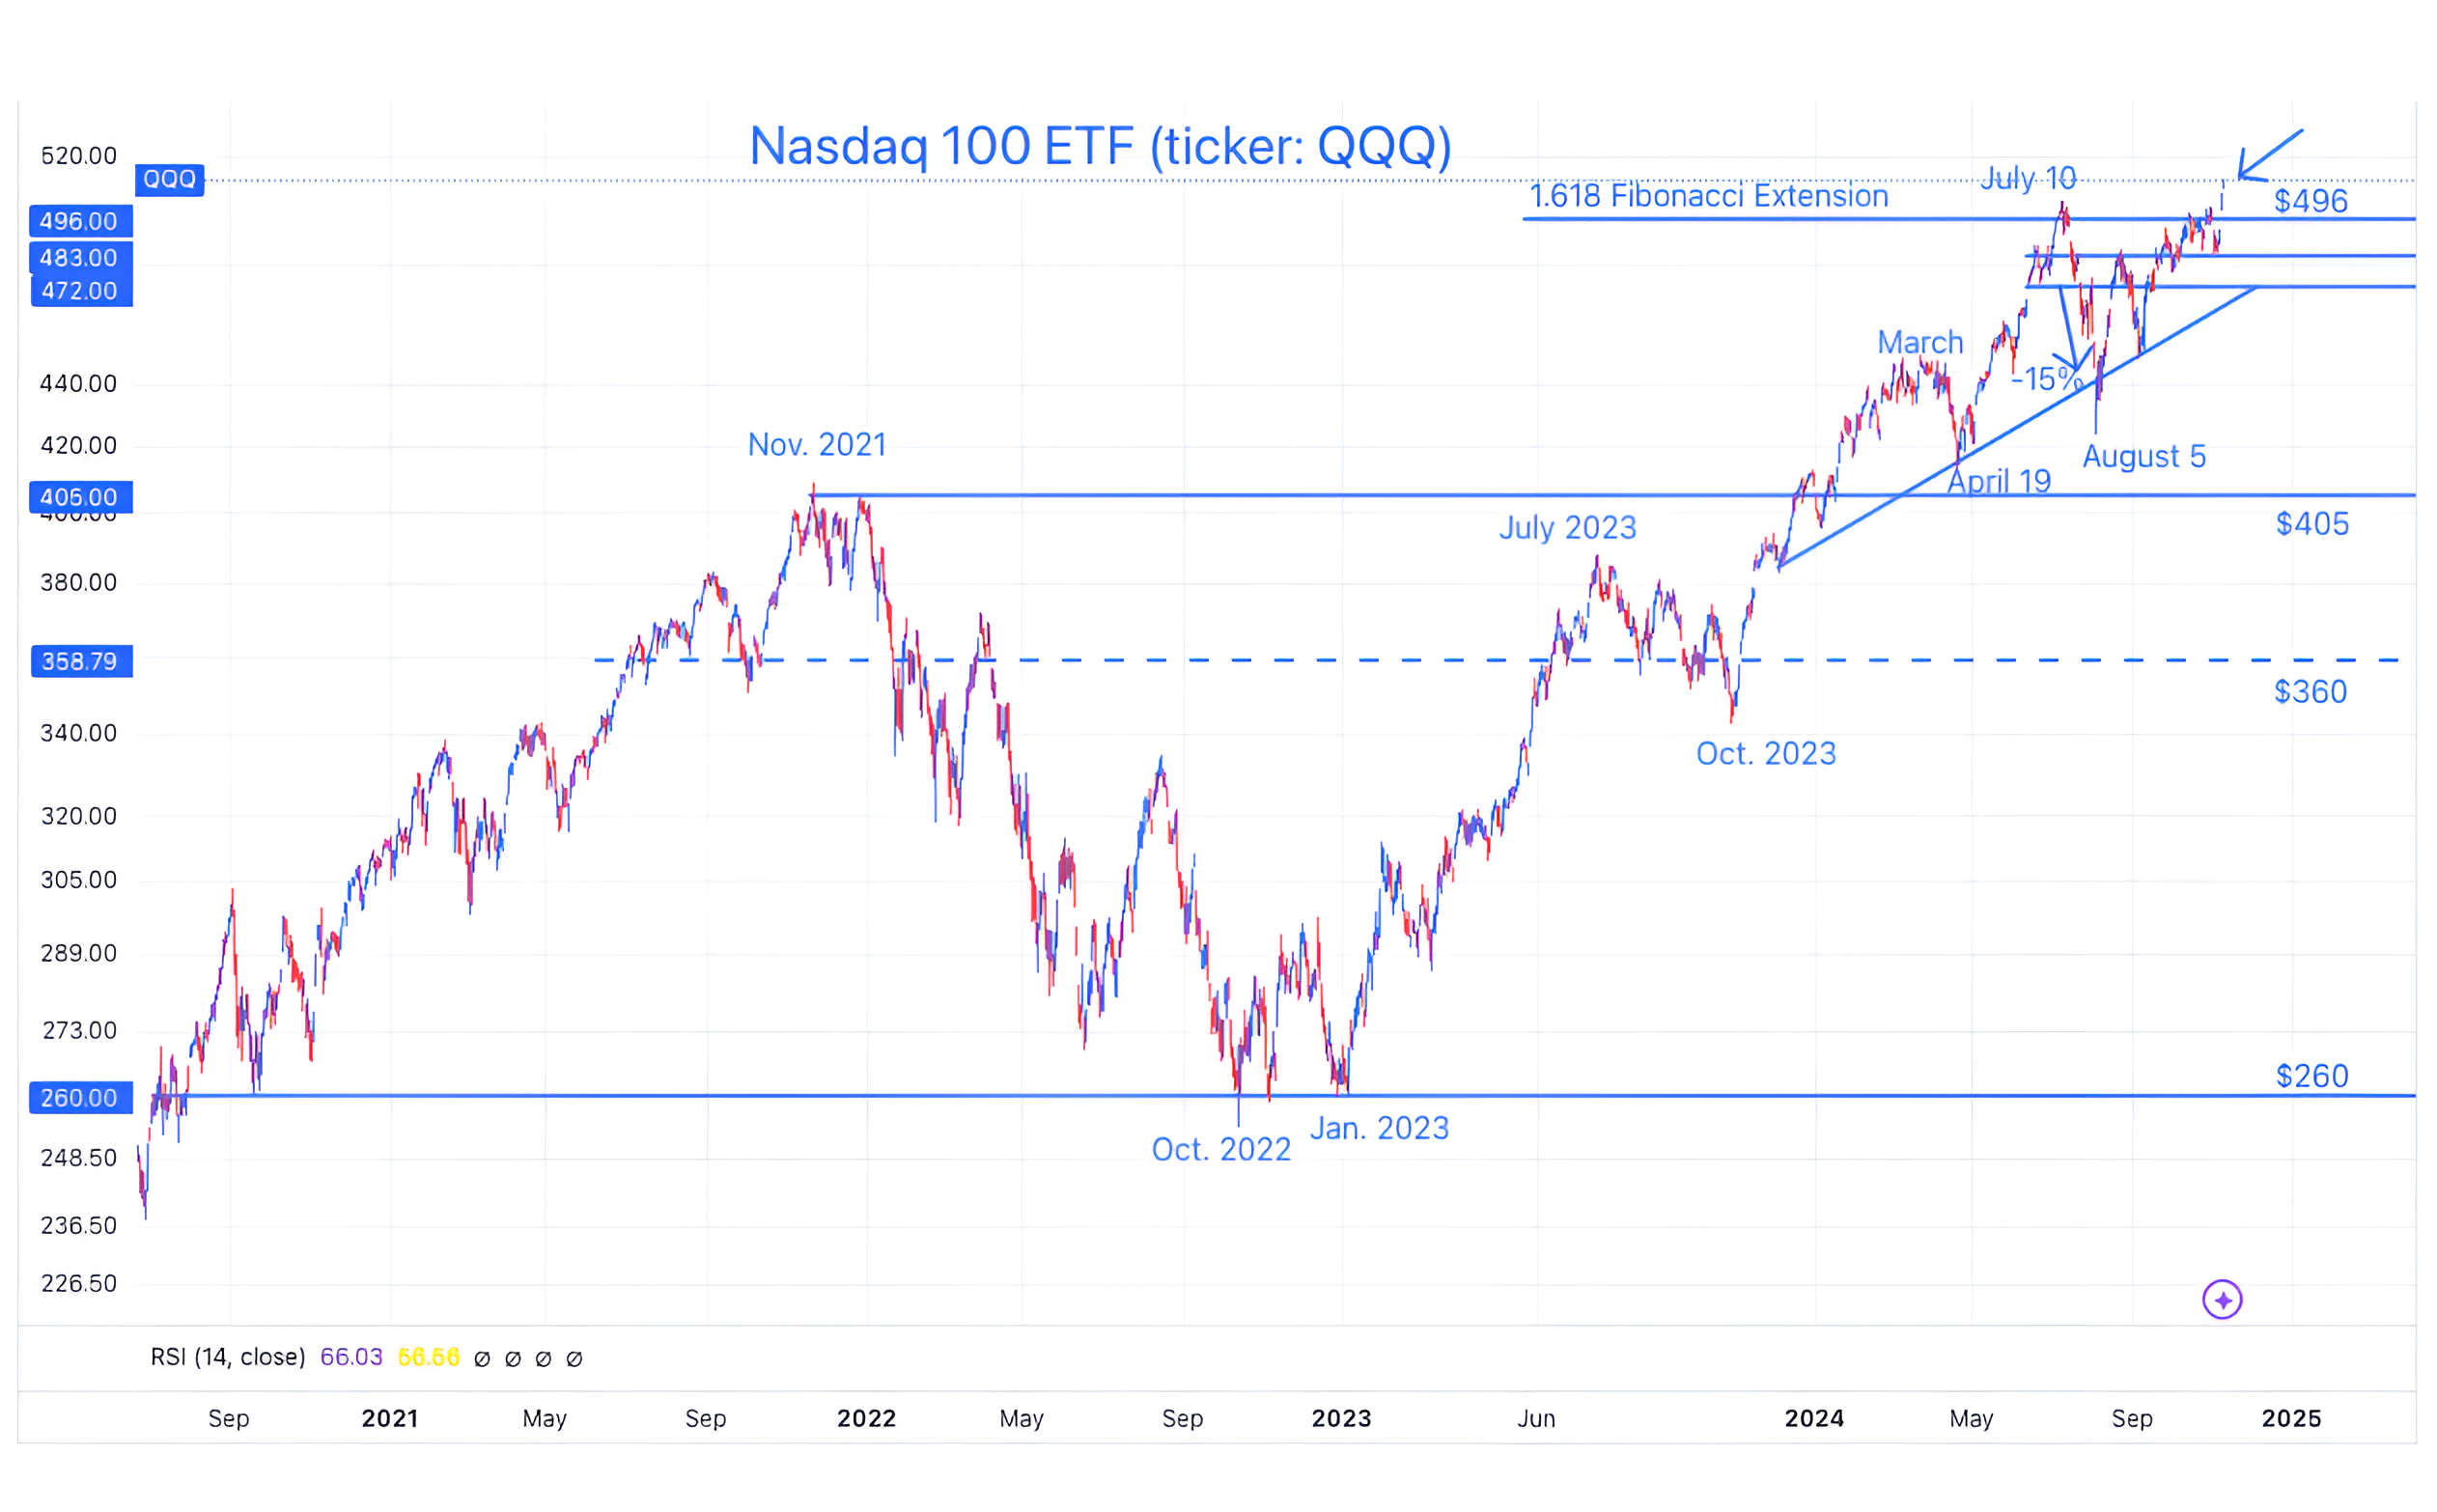
The chart above shows the Nasdaq 100 ETF (ticker: QQQ).
For the last four months, the Nasdaq 100 ETF has been contending with the $496 level that is the Fibonacci extension of its 2022 sell-off. We initially highlighted this battle on July 1 (here).
Until yesterday, as the Nasdaq 100 ETF had been unable to cross this threshold, we considered the possibility that this high growth index would weigh down the S&P 500 or the Dow Industrials which had both cleared their respective 1.618 Fibonacci extensions.
With the post-election relief rally, the Nasdaq 100 ETF has joined the other major US equity indexes on the “other side” of what we have considered a key level.
This is bullish.
It is also an indication of rotation and broader participation in the equity environment - which is also constructive.
Two weeks ago (here), we characterized the chart of the S&P 500 as “picture perfect.”
With all three major US large cap indexes clearing key resistance level and moving to all-time highs, the Technical scenario and outlook remains strong.
That said, after each of the indexes has cleared this key level, we have watched for a “retest” or a move back down to the prior ceiling.
We will see if this occurs with the Nasdaq 100, and, if it does, we will watch closely as the index revisits the $496 area.
(This is not a recommendation to buy or sell any security and is not investment advice. Past performance is not indicative of future results. Please do your own research and due diligence).
2. Small Caps, A New Range, but Still Below 2021 High
Source: Trading View. Through year-to-date 2024.
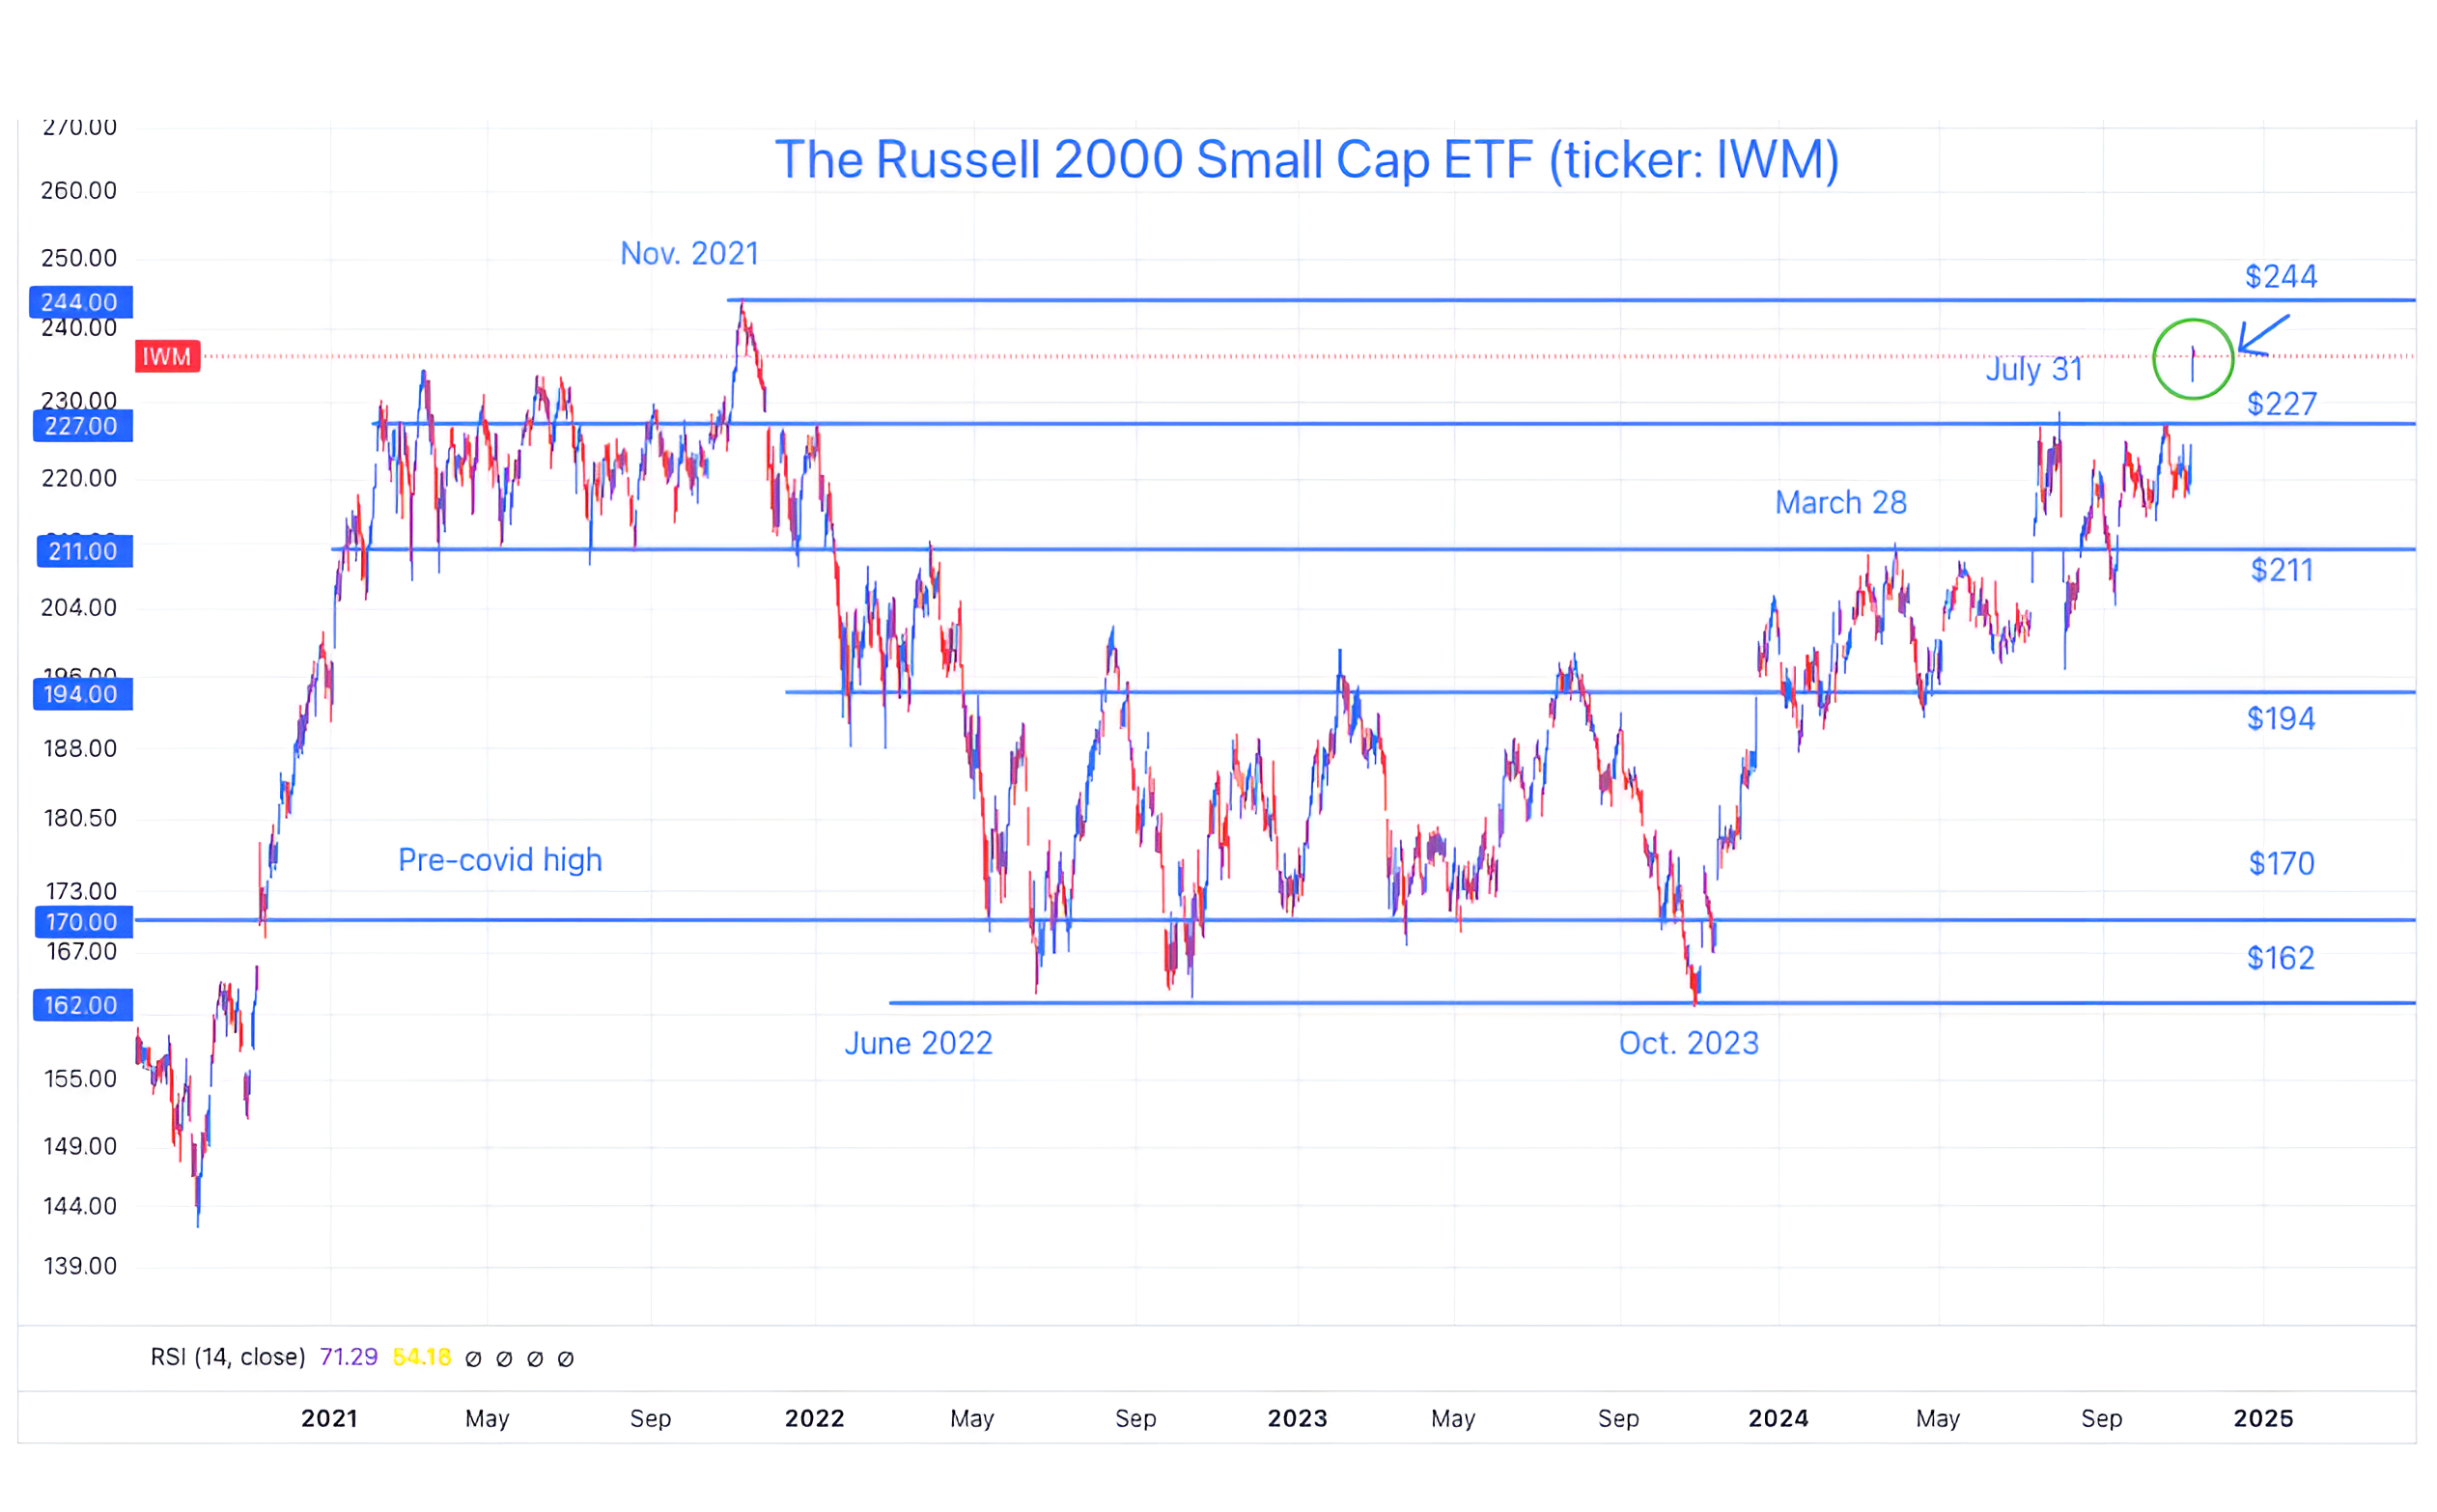
The chart above shows the Russell 2000 Small Cap ETF (ticker: IWM).
We last showed this two and half weeks ago (here).
At the time, we noted that, like the Nasdaq 100 (back then), the Small Caps had not made it back to their July high.
We had identified the Nasdaq 100 and Russell 2000 Small Caps as the questionable pieces of the overall equity market puzzle.
While the Nasdaq 100 seems to have fully “resolved” (at least for the time being) the questions as it is at a new all-time high and above its key level; the Russell 2000 - although it has surpassed its July high - still needs to contend with its 2021 all-time high.
With the Russell 2000 in “purgatory” between two important levels, we will watch the direction from here. We would not be surprised to see a “retest” move back down towards the July high around $227 before a more significant move higher.
(Past performance is not indicative of further results. This is not a recommendation to buy or sell any security and is not investment advice. Please do your own due diligence).
3. Fed Rate Cuts are Being Priced OUT of the Market
Source: Strategas. Through year to date 2024.
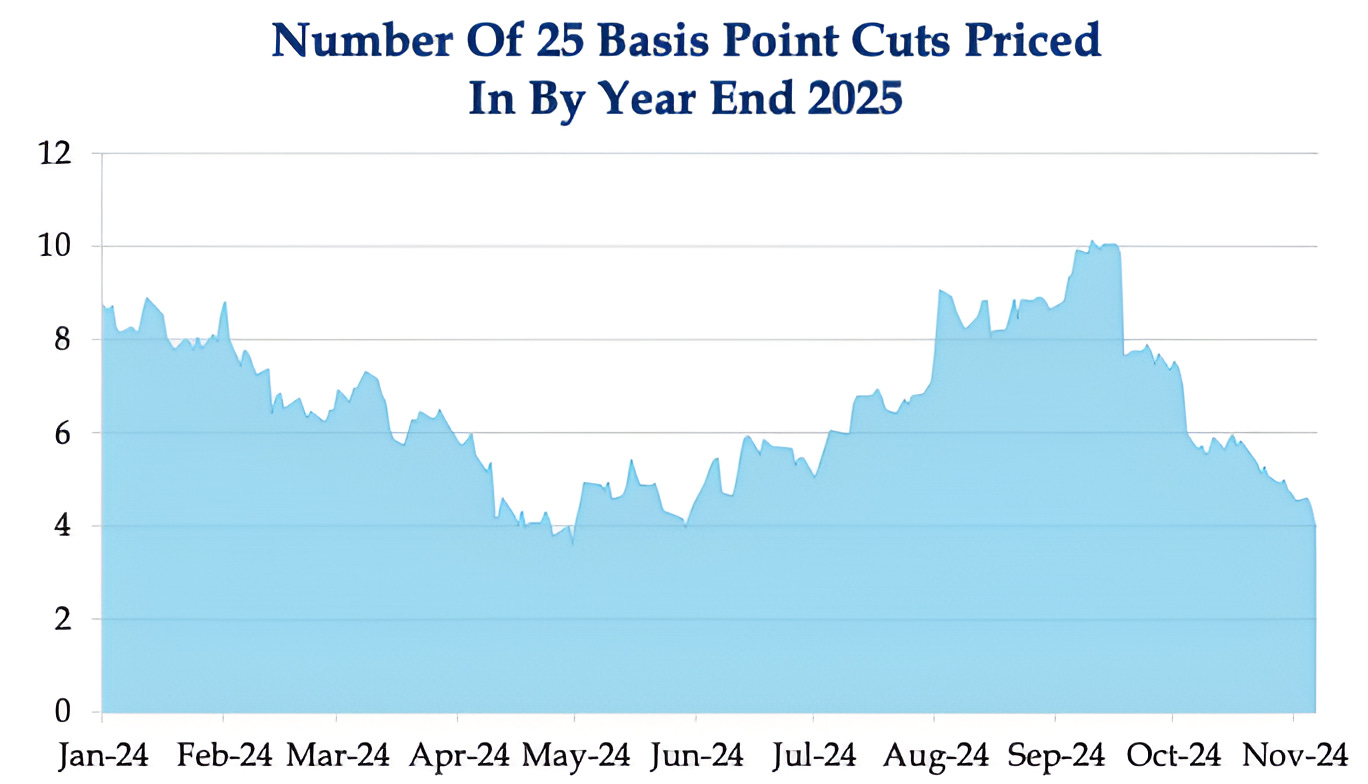
The chart above shows the number of 0.25% Fed rate cuts expected by year-end 2025 that are being priced-in by the market.
In addition to today’s cut, the market is currently expecting three other 0.25% Fed rate cuts between now and year-end 2025.
Since the last Fed meeting (when the Fed cut 0.5%), economic surprises in the US have been positive and this has reduced the number of rate cuts the market is expecting.
Additionally, the election outcome and the pro-growth policies expected with a Trump administration had a large impact on the interest rate complex.
In our view, there has been an inconsistency with the 13% average S&P 500 quarterly earnings growth expectation over the next five quarters and the belief in a significant easing cycle.
For equities, the knowledge that the Fed is ready to cut may be more important than the cuts themselves.
In other words, knowing the Fed “put” exists may reduce the need to use it.
(Past performance is not indicative of future results. This is not a recommendation to buy or sell any security and is not investment advice. Please do your own due diligence).
4. The Challenge for the New Administration
Source: Apollo Chief Economist. Through year-to-date 2024.
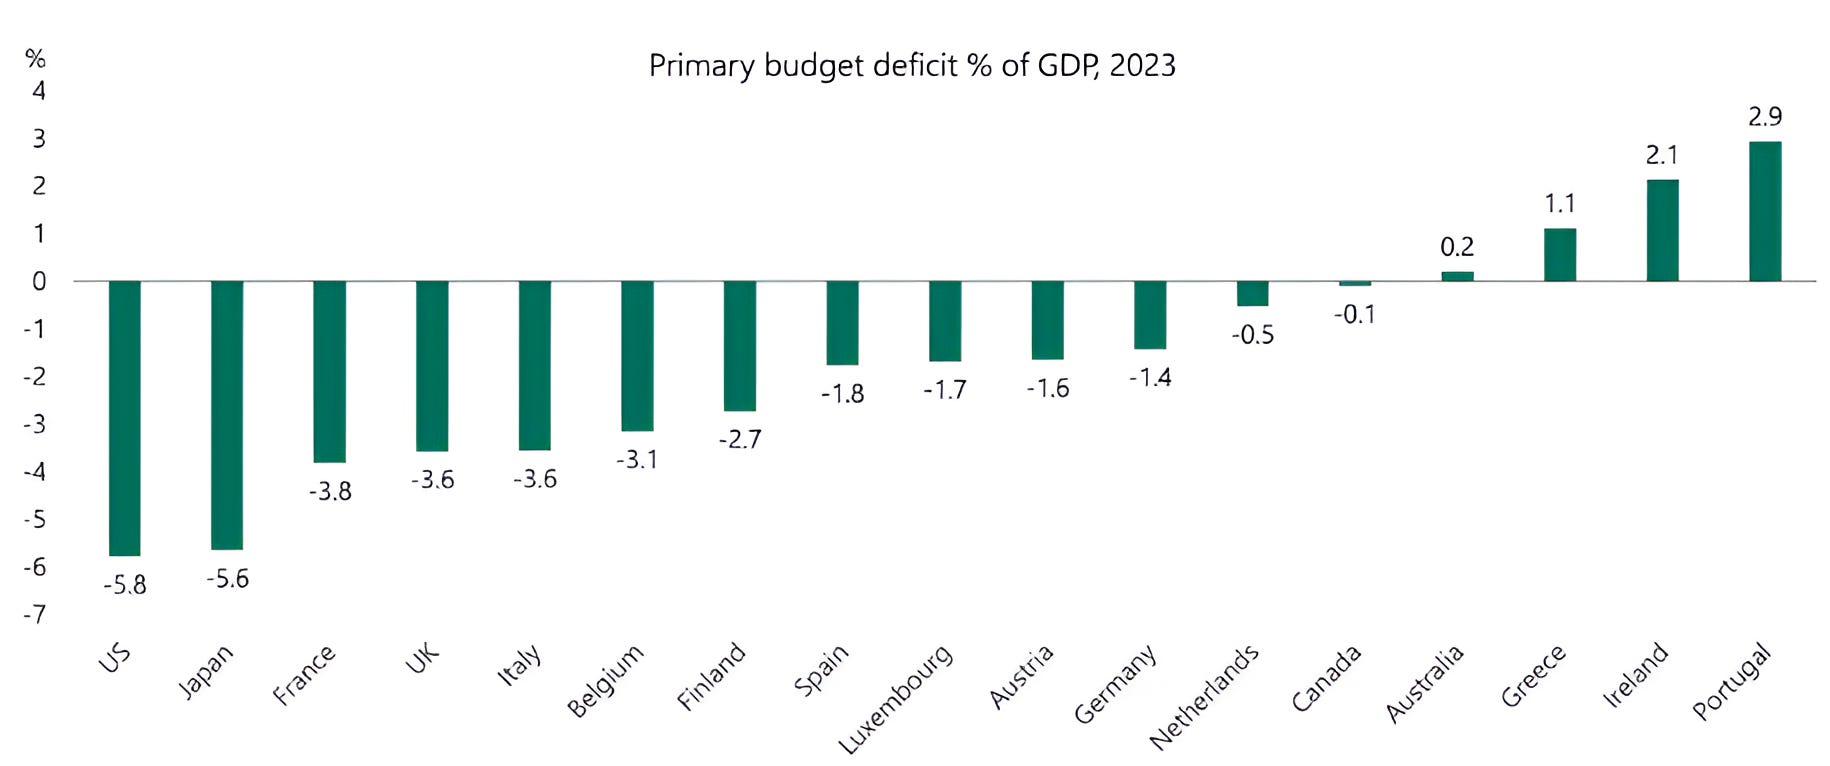
The chart above shows the Primary Budget Deficit as a Percent of GDP of the US, Japan, Canada and several European countries.
The US is has the worst on Primary Budget Deficit of all countries shown.
As a reminder, the Primary Budget Deficit is the budget deficit before including interest expense.
However, as we have highlighted, the US interest expense is a growing concern and the budget deficit becomes a greater challenge when considering the interest on US debt.
As we highlighted in Chart 4 here:
“In addition to the borrowing requirements to finance the deficit, the US government will need to refinance 54% of US debt currently outstanding over the next three years.
This means that the US will need to borrow over $20 trillion over the next three years.”
Because the prevailing interest rates all along the Treasury curve are higher than the average yield of the outstanding debt, the interest expense would be likely to grow even if the US had a balanced budget.
We continue to expect the related issues of debt, deficit, interest rate and interest expense to impact the policy priorities of the next administration and the markets.
(Past performance is not indicative of future results. This is not a recommendation to buy or sell any security and is not investment advice. Please do your own due diligence).
5. The Fed is Cutting at an All-Time High!
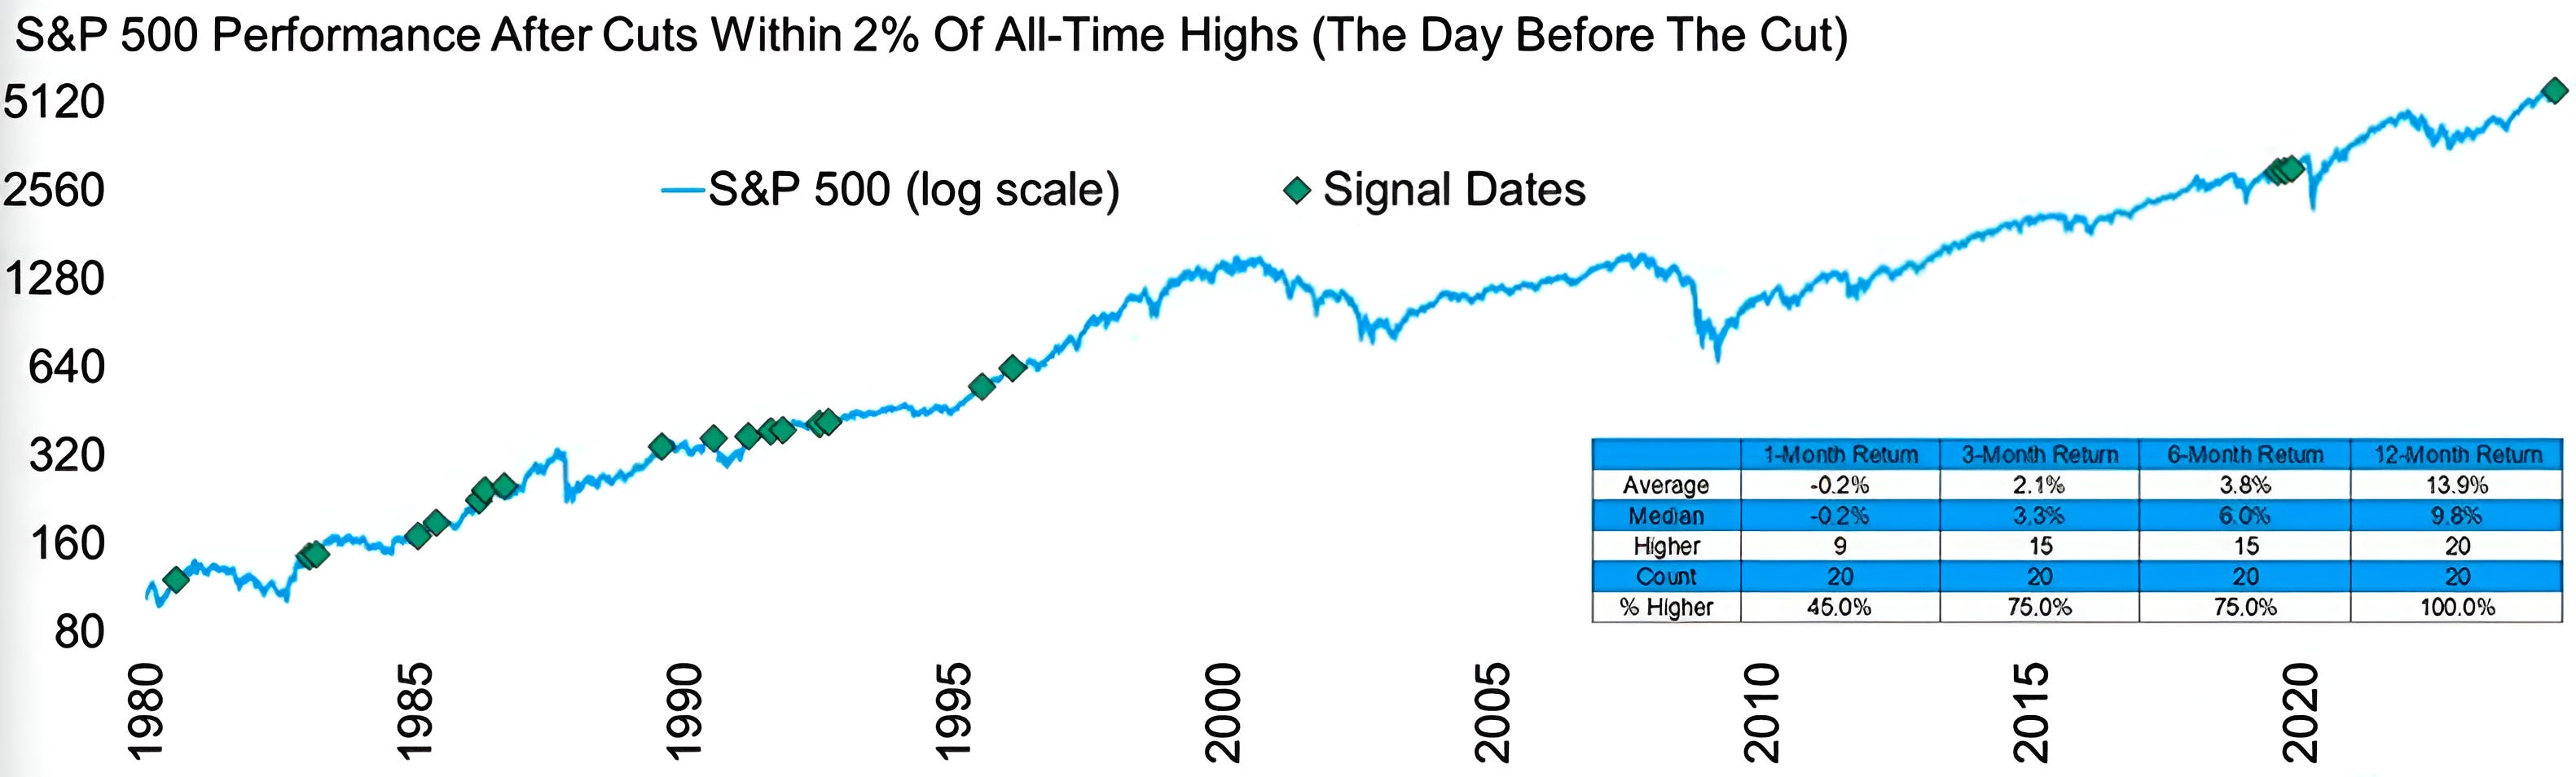
Source: Carson Investment Research / Ryan Detrick. Through year-to-date 2024.
The chart above shows the subsequent equity market performance of the 20 previous times that the Fed has cut rates within 2% of an all-time S&P 500 high.
Although one-month returns on average have been slightly negative (-0.2%), one year later, the S&P 500 has been up 100% of the time with a median return of nearly 10%.
(Past performance is not indicative of future results. This is not a recommendation to buy or sell any security, please do your own research).