


Bring the Noise!
What comes after the election? When the dust settles will there be a renewed focus on the economy and fundamentals? Don't forget there's a Fed decision this week. Let's dig in...
It’s election day in the US and it seems unlikely that we will wake up tomorrow and know who has won.
That said, I recently read a story about a trading firm that invested $300 million to receive the 2016 investment results 10 minutes ahead of the press and Wall Street competitors. Even with the information, they lost money.
This is a nice way of saying that even if I knew the election results, it would be difficult to predict the equity market response.
Luckily for us, Goldman Sachs is not quite as modest as I am and published an election-outcome equity framework:
Trump w/ Republican Sweep = 25% probability; S&P +3%
Trump w/ Divided Government = 30% probability; S&P +1.5%
Harris w/ Democratic Sweep = 5% probability; S&P -3%
Harris w/ Divided Government = 40% probability; S&P -1.5%.
Bring the Noise!
From the New Yorker:

1. A Date with 5620 in the S&P 500?
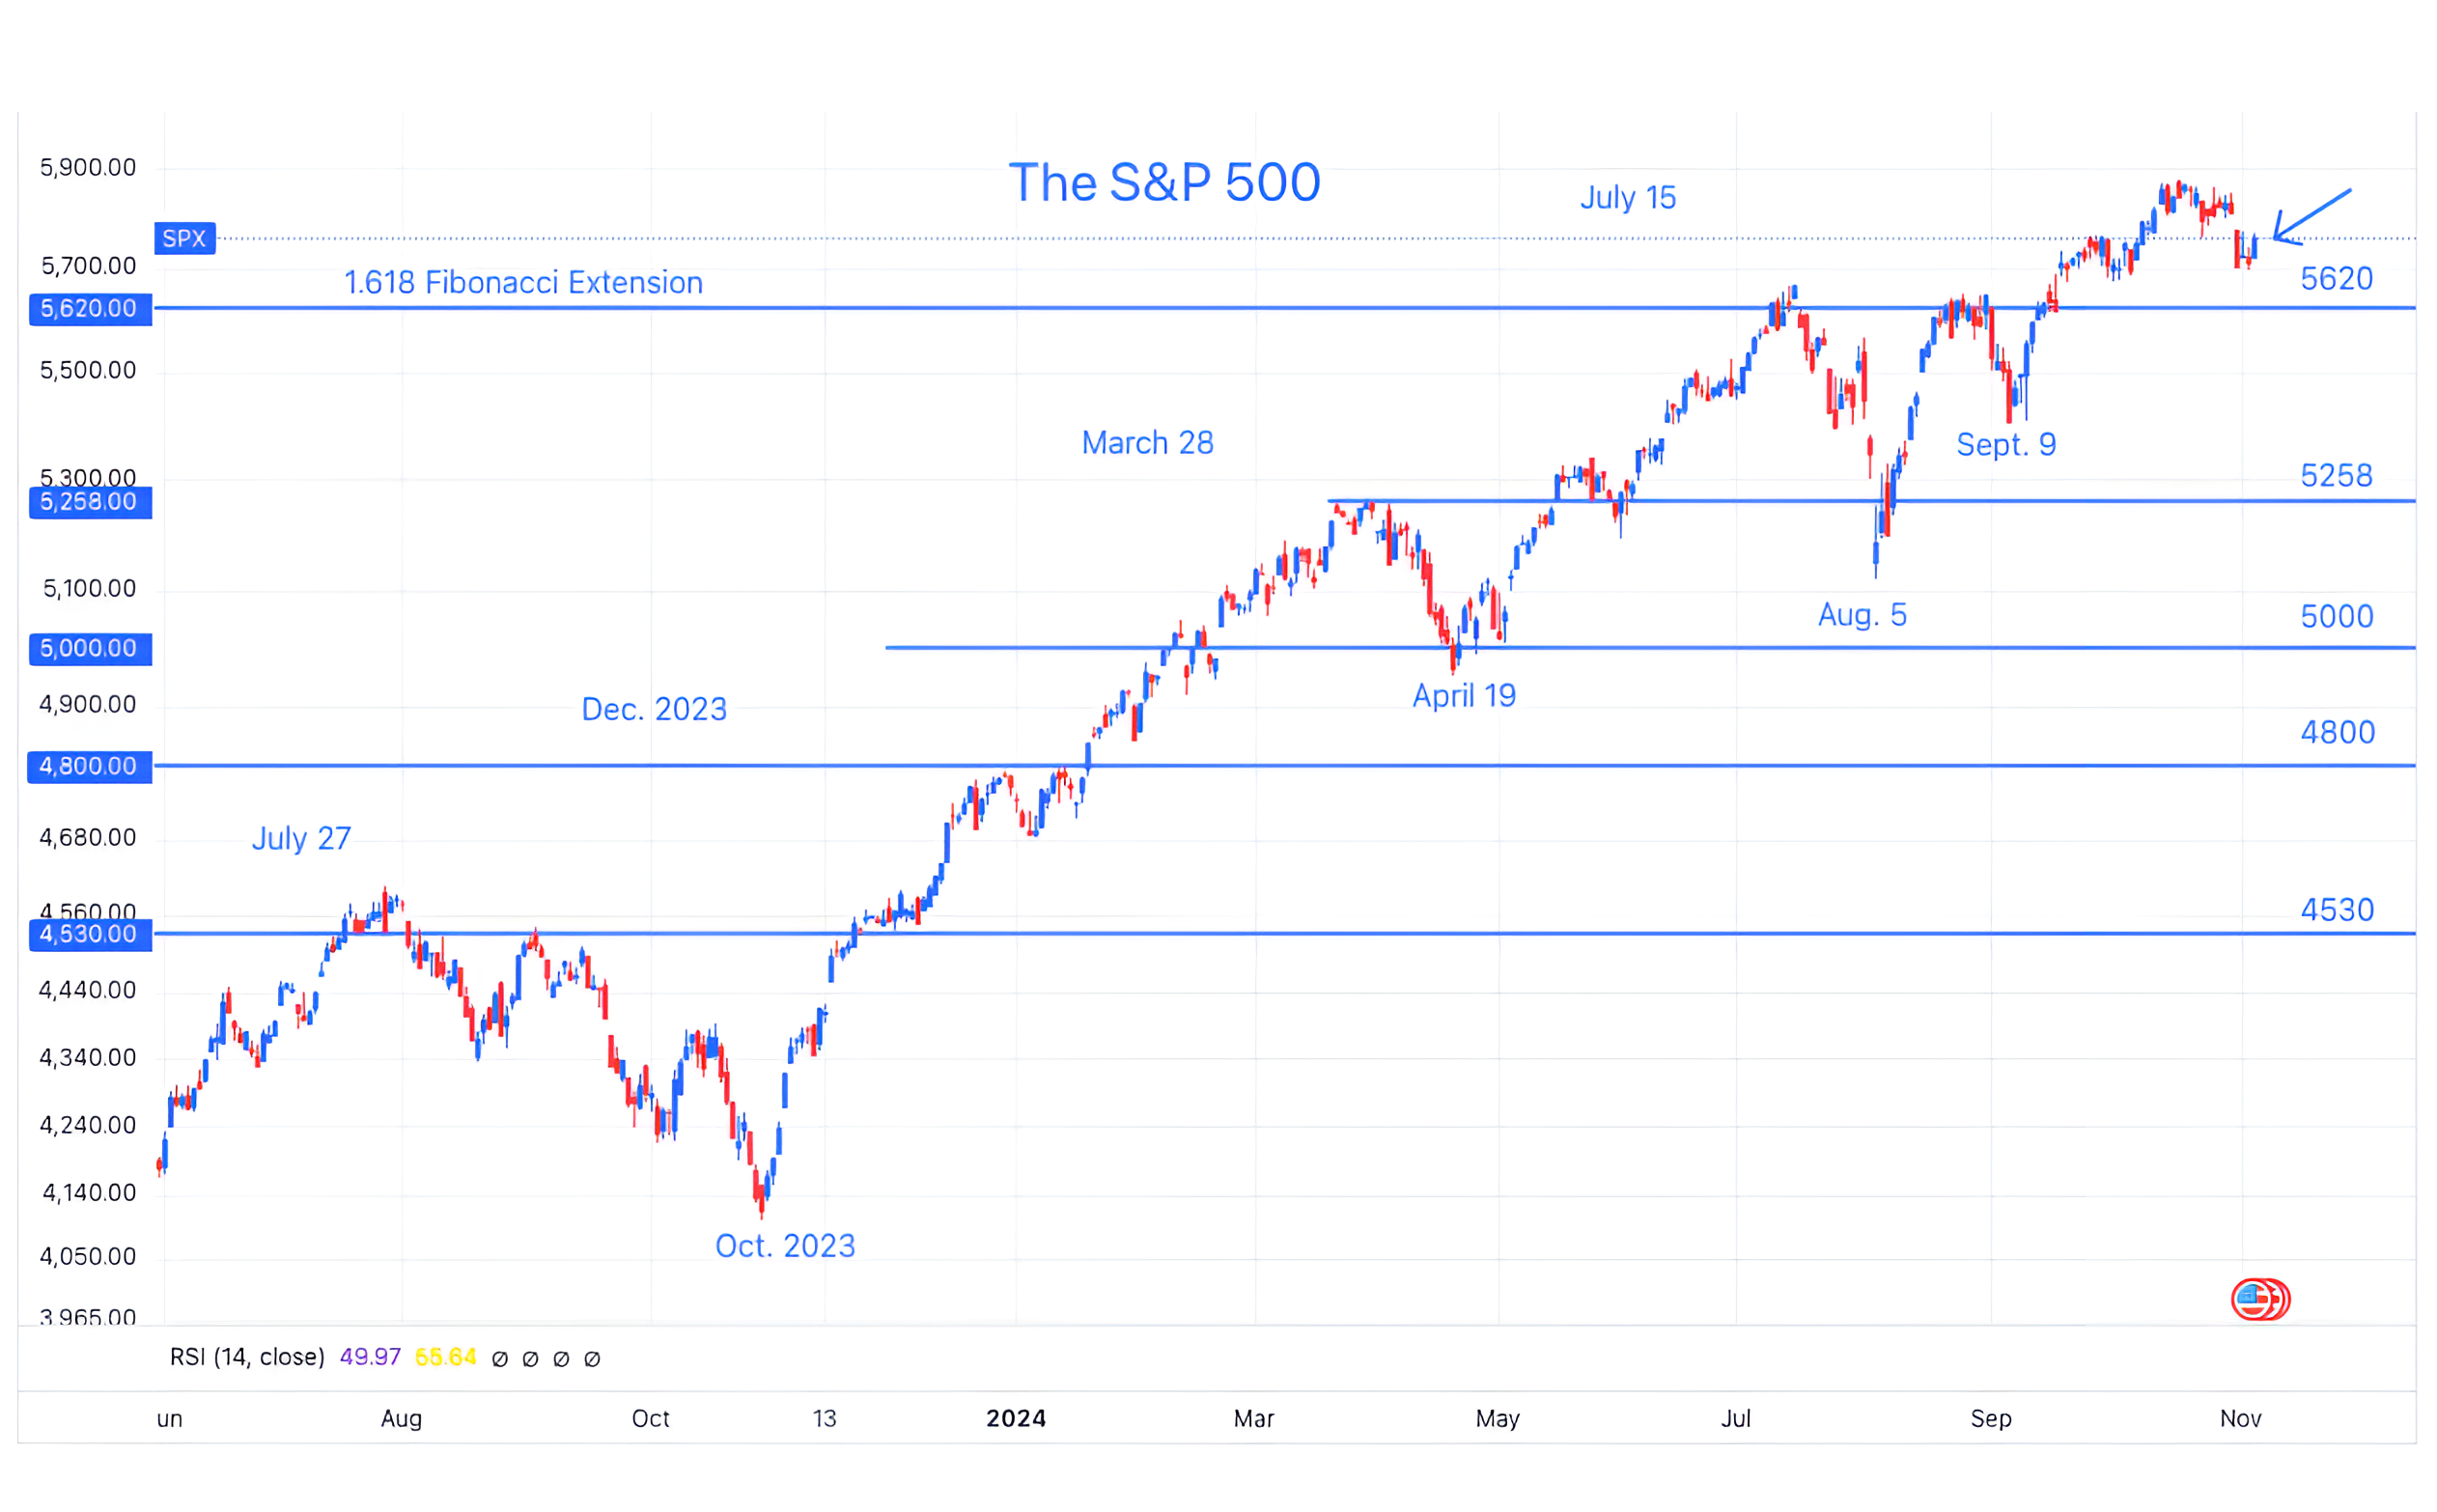
Source: Trading View. Through year-to-date 2024.
The chart above shows the S&P 500.
We last showed this chart two weeks ago (here), and, at the time, we characterized it as “picture perfect.”
At the time, the S&P 500 chart had the key characteristics that we look for in a chart:
after a strong move up from early September, the S&P 500 was moving sideways and “consolidating” its gains;
there were (and are) a series of higher highs and higher lows; and
the price has contended with and exceeded key levels (previous all time highs and Fibonacci levels).
Since we last showed the chart of the S&P 500, we have been highlighting those indexes with more questionable charts - the Nasdaq 100 (here); Russell 2000 (here); and the Dow Industrials Index (here and here).
The question we have been asking is whether a) the inability of the Nasdaq 100 and Russell 2000 to clear important resistance levels and b) the Dow Industrials retesting and seemingly failing at a critical support would begin to weigh on the S&P 500.
While the answer has been yes - the S&P 500 which looked picture perfect, has actually gapped down - the magnitude of the move lower has been less than we would have expected.
Now that an “island” (see the arrow area) has been created in the chart, we view the post-election equity market response as binary.
The S&P 500 will either rally higher like a beachball that has been held under water or collapse under the prospect of a policy agenda that has not been fully priced in.
We have consistently followed the charts and been patient during this period of questionable fundamental and macro foundation and this will continue to be our strategy.
If there is further weakness in the S&P 500 and our inter-market signals, we will re-evaluate our fully-invested stance.
(This is not a recommendation to buy or sell any security and is not investment advice. Past performance is not indicative of future results. Please do your own research and due diligence).
2. Equities Have Ignored Treasury Yields, For Now

Source: Trading View. Through year-to-date 2024.
The chart above is a close-up of the path of 10-Year US Treasury yields over the last two+ years.
We showed a very long-term 10-Year US Treasury yield chart three weeks ago (here).
There are four points we want to make about 10-Year US Treasury yields.
Based on supply demand and the US government fiscal deficit, we see 10-Year US Treasury Yields trending higher over time.
As we noted in chart 4 here there is $20 trillion of US debt that needs to refinanced over the next three years in addition to any spending priorities.
Looking at the long-term chart (here), the downtrend in yields (the Treasury bull market) that began in 1983 is over. We are in a new regime.
Over the past two years, major highs in 10-Year US Treasury yields (October 2022, October 2023 and April 2024) have coincided with lows in the S&P 500.
By contradistinction, over the same two year period, moves higher in 10-Year US Treasury Yields have often been associated with S&P 500 volatility. However, the level in yields at which the S&P 500 has reacted to moves higher in 10-Year Treasury yields has changed:
In 2022, the S&P 500 began to move down when 10-Year US Treasury Yields moved through the 1.60% level.
In 2023, the S&P 500 sold-off in July when yields moved above 4.05%.
In March 2024, the S&P 500 became sensitive to yields when they moved above their October 2022 level at 4.34%.
With yields back at 4.34%, we will see if a move higher becomes meaningful for equity markets, but given the rapid move from 3.60% to 4.34%, we’re watching.
(Past performance is not indicative of further results. This is not a recommendation to buy or sell any security and is not investment advice. Please do your own due diligence).
3. What’s Happening with Earnings Season?

Source: FactSet. Through year to date 2024.
The chart above shows the S&P 500 bottom-up quarterly earnings estimates as of the July 8 (the beginning of Q3) and last November 1.
For some time, we have been focused on Q4 2024 and full year 2025 earnings and earnings growth estimates. (See here; here; here; chart 3 here; chart 3 here; charts 2, 3 and 4 here; chart 3 here; and chart 3 here).
Even though Q3 earnings are being reported as “better than expected,” expectations were revised down throughout the 3rd quarter and hit a low of $60.07 on October 18, shortly after the quarter ended.
In other words, companies consistently lowered the bar and have now exceeded it.
We see a similar reduction in expectations occurring across each quarter through the end of 2025.
Because expectations for Q3 were so low at the end of the quarter (in early October), despite the reduction in earnings for each of the next five quarters, as the calendar has rolled, “next 12 months earnings” has increased.
To further clarify the point above, on October 4, next 12 months S&P 500 earnings expectations, which at the time included estimates for Q3 2024, were $256.23.
Today, because the calendar has moved one quarter forward, next 12 months S&P 500 earnings expectations now include Q3 2025 rather than Q3 2024 and are $264.05.
In other words, despite continuing downward revisions, next 12 months earnings expectations have moved up 3% simply because we have moved the calendar one quarter forward.
It is notable to us (and we have been stating this all year) that a disproportionate portion of S&P 500 earnings expectations and growth are in those quarters that are the furthest out with and with the least visibility (Q3 and Q4 2025 S&P 500 earnings growth is estimated to be 13.7% and 16.7%, respectively).
By the time those quarters arrive and reflect reality, investors will be focused on earnings estimates for Q3 and Q4 2026.
That said, we continue to question the 12.4% earnings growth estimate for Q4 2024 as well as the 13.6% quarterly average earnings growth in 2025.
As the S&P 500 is trading at 22x next 12 months earnings and 21x 2025 earnings, from a fundamental perspective, we view it as fragile.
(Past performance is not indicative of future results. This is not a recommendation to buy or sell any security and is not investment advice. Please do your own due diligence).
4. Trend Matters

Source: Strategas. Through year-to-date 2024.
The chart above shows the S&P 500 forward performance vs. the underlying market trend coming into US Presidential election days.
This year, the S&P 500 has been in an uptrend, which historically, has been associated with positive returns three and six months after the election.
(Past performance is not indicative of future results. This is not a recommendation to buy or sell any security and is not investment advice. Please do your own due diligence).
5. Europe: Failure to Launch
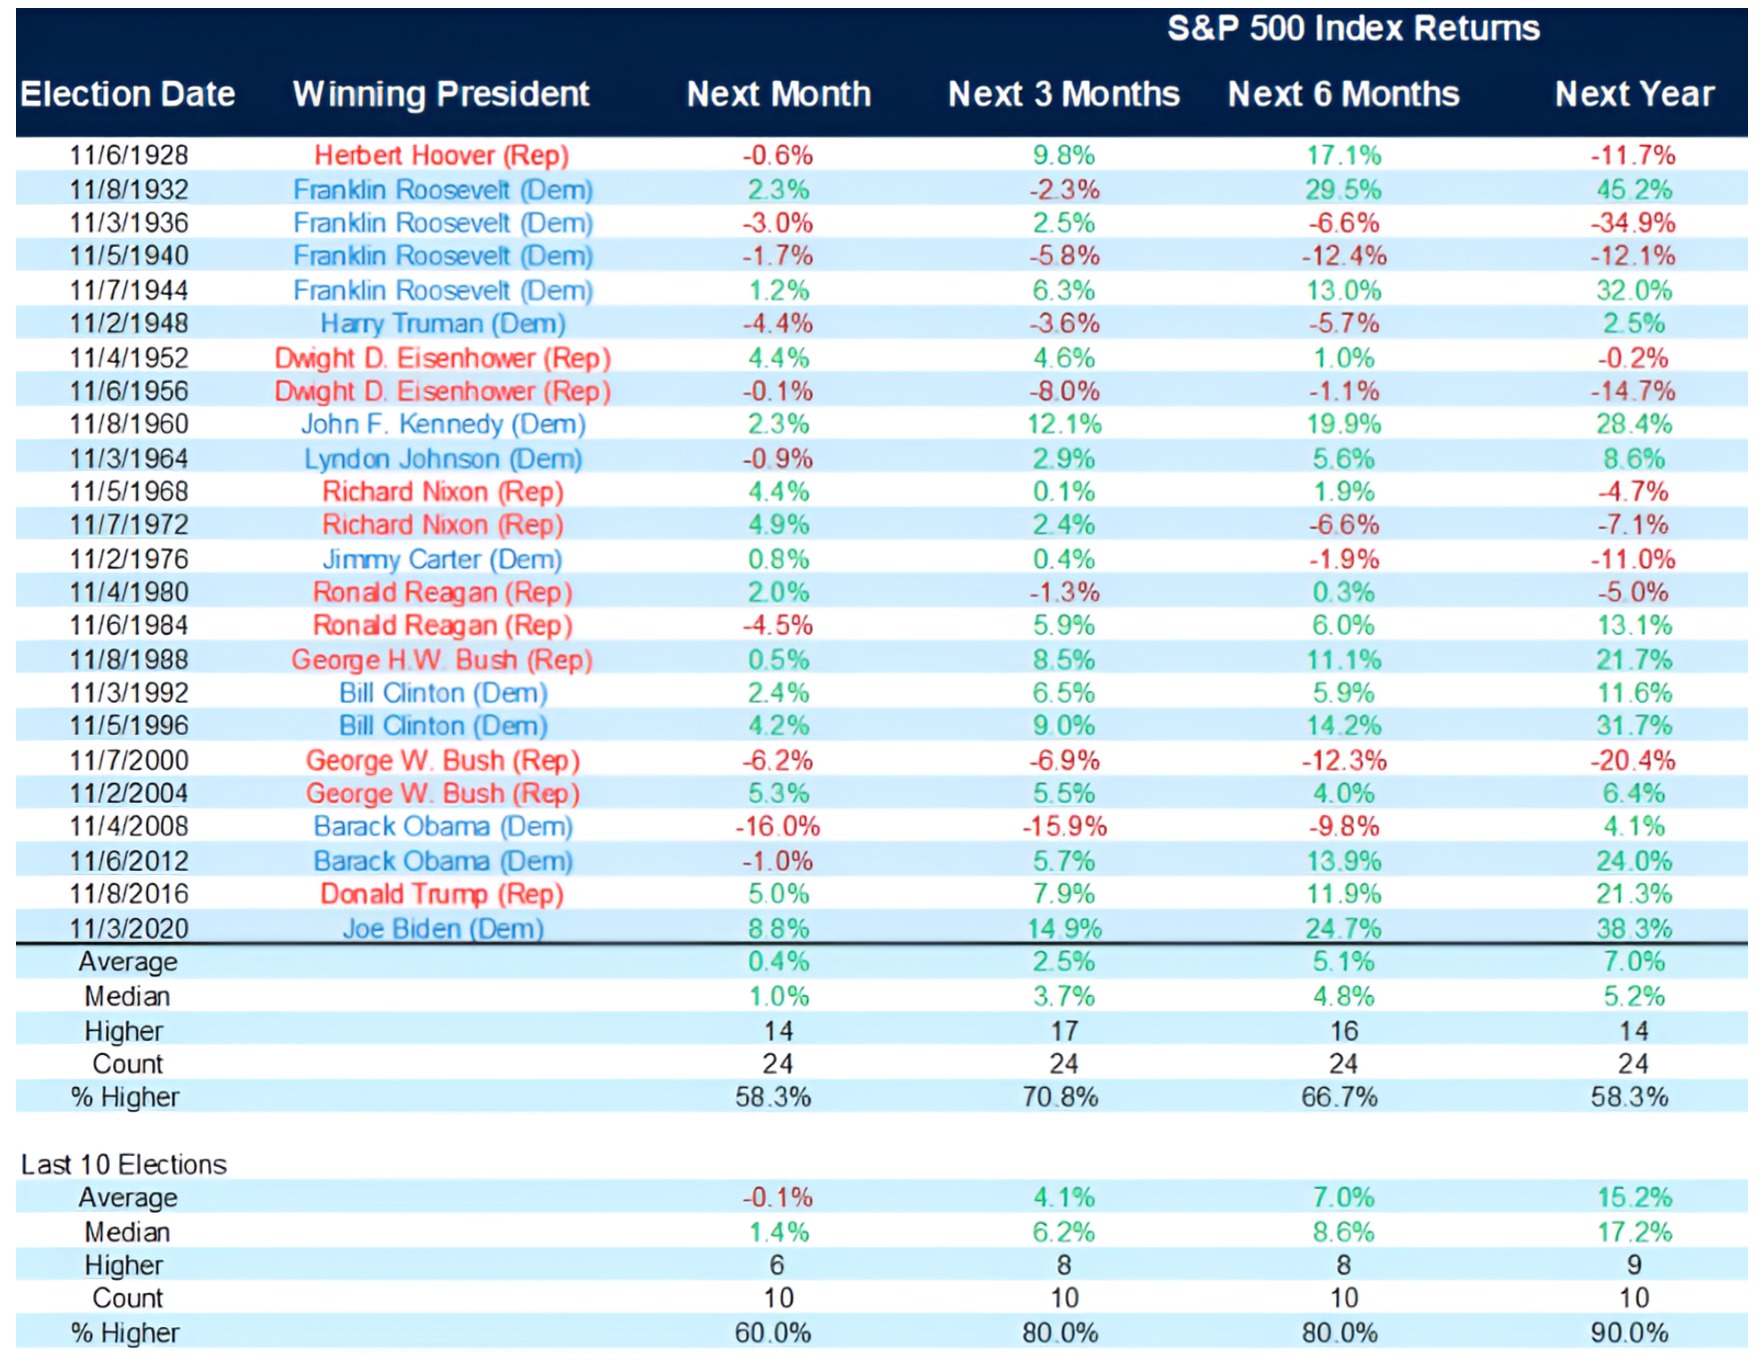
Source: Carson Investment Research / Ryan Detrick. Through year-to-date 2024.
The chart above shows the performance of the S&P 500 after all US Presidential elections since 1928.
The most notable aspect of this chart (in my opinion) is that:
the average one year performance of the S&P 500 subsequent to all US Presidential elections since 1928 has been 7.0% with 58.3% positive;
while the average one year performance of the S&P 500 subsequent to the last 10 US Presidential elections has been 15% with 9 out of 10 having positive returns.
In other words, from 1928 to 1980, the S&P 500 only experienced positive returns one year after the US Presidential election 36% of the time.
Since 1984, the S&P 500 has had positive returns 1-year after the US Presidential election 90% of the time.
(Past performance is not indicative of future results. This is not a recommendation to buy or sell any security, please do your own research).