


Don't Go Breaking My Heart!
With five of the Mag 7 reporting between today and Thursday and the US Presidential election next Tuesday, hopefully this will bring clarity rather than confusion to equities. Let's dig in...
On the eve of the US Presidential election, this week 148 S&P 500 companies are reporting earnings making it the most important week of Q3 earnings season.
In addition to five of the Magnificent 7, Visa; Eli Lilly (the maker of Mounjaro, the Ozempic competitor); Caterpillar, Exxon and Chevron will report among others (schedule below).
Frequent readers know that since the beginning of the year we have questioned Q4 2024 and 2025 earnings estimates and growth (see chart 2 here; chart 3 here; here; here; here; here; chart 3 here; chart 3 here; charts 2, 3 and 4 here; chart 3 here; and chart 3 here).
Q3 S&P 500 earnings are currently expected to grow 2.6% with nearly all of that growth coming from the Magnificent 7.
In terms of the election, some parts of the market have already begun to price in a Trump victory as the sectors that outperformed in late 2016 and 2017 (such as Financials) have once again been leading the market higher.
Normally, the volatility occurs before the election, and the market rallies as an unknown becomes a known. This year, there was little pre-election volatility.
Could a delay in results or a Harris victory lead to a sell-off?
Our bias continues to be towards a year-end rally.
Don’t go breaking my heart!

1. The Key Battle We’ve Been Watching in the Nasdaq 100
Source: Trading View. Through year-to-date 2024.
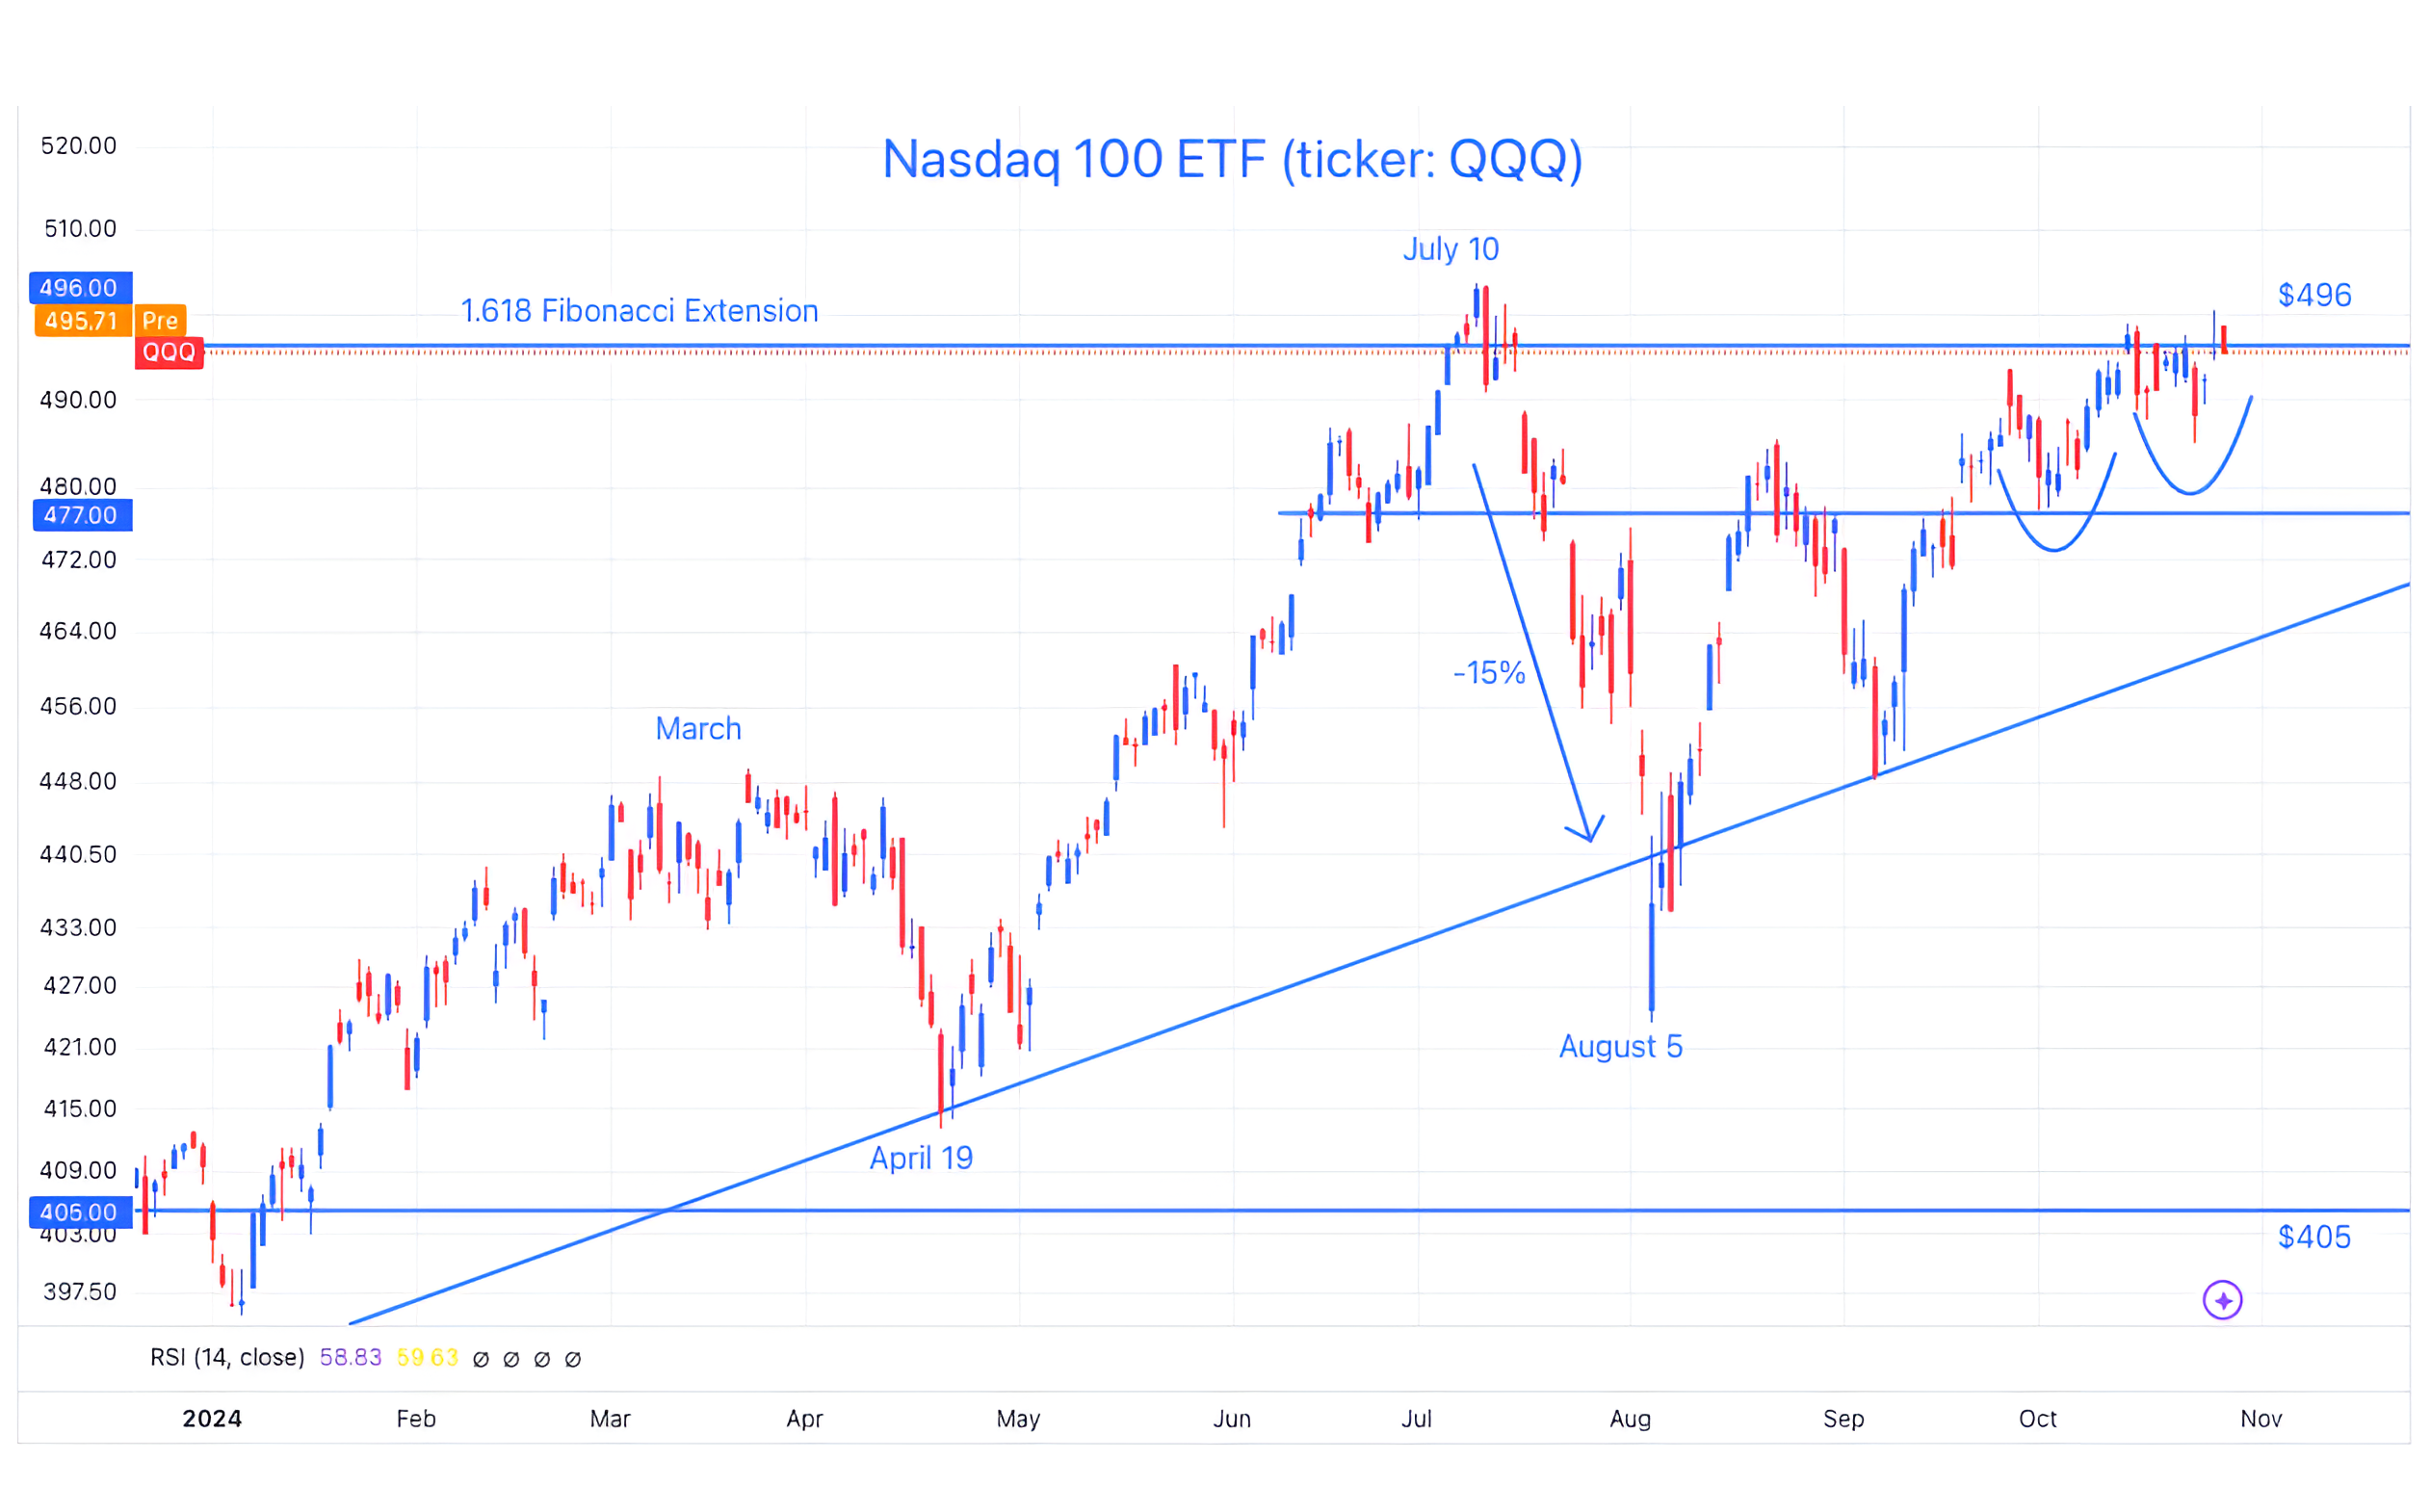
The chart above shows the Nasdaq 100 ETF (ticker: QQQ).
While we have continued to characterize the charts of the S&P 500 and Dow Jones Industrials as constructive and bullish, the chart of the Nasdaq 100 remains in purgatory.
A week and a half ago (here), we noted that the Nasdaq 100 ETF was once again battling the $496 level that we identified on July 1 (here).
As noted above, from a fundamental perspective, this week, Microsoft, Meta, Google, Apple and Amazon report earnings.
Although each faces its own dynamics and is focused on different verticals within the technology and communications ecosystem, these five companies represent 23% of the S&P 500 and 32% (nearly 1/3) of the Nasdaq 100.
As we wrote a week ago (here):
“While the S&P 500 overall is expected to grow earnings 2% in Q3, the Magnificent 7 - Google, Amazon, Meta, Microsoft, Nvidia, Apple and Tesla - are expected to grow earnings 18% during this period.
The “other 493” (companies in the S&P 500) are expected to grow earnings 0.1% during Q3. (FactSet).”
In addition, the five companies that are reporting represent the majority of AI spending (chart 3 here).
By the end of the week we will have a solid grasp on the index earnings outlook and AI guidance.
As the Nasdaq 100 ETF continues to battle the $462 level - these earnings will likely dictate the direction of the next meaningful move.
From a technical perspective (simply looking at the chart), it looks as if a bullish “cup and handle” (the two light blue arcs on the right side of the chart) has formed and the next move is higher (target of about $510).
From a historical analog perspective, we showed in chart 5 here that two weeks after the Nasdaq 100 had not experienced consecutive down days over a six week period, the Index has been positive 75% of the time.
Our bias going into this period is that the Nasdaq 100 will resolve higher.
(This is not a recommendation to buy or sell any security and is not investment advice. Past performance is not indicative of future results. Please do your own research and due diligence).
2. Do iPhones Still Matter to Apple?

Source: Trading View. Through year-to-date 2024.
The chart above shows the price of Apple shares (ticker: AAPL). This is not a recommendation to buy or sell Apple.
Apple represents 7% of the S&P 500 and 9% of the Nasdaq 100.
Yesterday, Amkor, the second largest advanced semiconductor assembly and test company concerning, reported earnings and announced guidance.
Amkor announced that its revenue would drop 11% from Q3 to Q4, specifically because of its communications division.
Apple is Amkor's largest customer.
On their conference call, Amkor’s management team said that the Q4 shortfall is "Mainly due to a premium smartphone maker." "Specifically, by a phone build plan that deviates from normal seasonality."
If this is correct, the iPhone 16, may not be doing as well as Apple had hoped.
Amkor’s shares were down 18% overnight and are now down 5%, however, Apple shares have barely moved on this news.
In fact, when we look at Apple shares, they have achieved both of their measured targets based on symmetry (after trading sideways and moving above the top of the range, the new price objective becomes the top of the range, plus the width of the range) and shares looks like they want to move higher.
This could be because with Apple’s installed base of phones, iPads, computers, watches, it has become less reliant on the iPhone upgrade cycle and more reliant on services - cloud subscriptions, app store purchases, Apple pay, Apple TV, Radio, News etc.
Apple’s services business continues to grow along with the Apple ecosystem and has very high margins.
We will see what Apple has to say on Thursday, and while phones still matter to Apple, it may be that they are becoming less relevant.
(Past performance is not indicative of further results. This is not a recommendation to buy or sell any security and is not investment advice. Please do your own due diligence).
3. Earnings and Rate Cutting Cycles

Source: Strategas. Through year to date 2024.
The chart above shows the change in S&P 500 earnings during previous Fed easing cycles.
In general, as the Fed has cut rates, S&P earnings growth has been moderate poor.
Currently, over the next five quarters, while the Fed is expected to ease, analysts are expecting the S&P 500 to increase earnings 21%.
To put this in perspective, the growth in earnings would be the best S&P 500 earnings growth over the past ten years outside of the covid recovery and the Trump tax cut.
There is something incongruous about market expectations for six more Fed rate cuts in the next year at the same time S&P 500 operating earnings are expected to grow by over 10% in 2025.
While we have continued to highlight our concerns with earnings expectations (see chart 2 here; chart 3 here; here; here; here; here; chart 3 here; chart 3 here; charts 2, 3 and 4 here; chart 3 here; and chart 3 here), we also would not be surprised - either due to strength of the economy or inflation - for the Fed to be more constrained in their easing cycle than the market is currently expecting.
That being said, even if 2025 earnings disappoint or the Fed eases less than currently expected, the market may have a limited reaction as investors begin to look to a brighter 2026 and feel confident that the Fed “put” is always there if volatility arises.
In other words, as we have asked, if earnings fall short of expectations (in line with our view) will it matter, will investors care?
(Past performance is not indicative of future results. This is not a recommendation to buy or sell any security and is not investment advice. Please do your own due diligence).
4. Valuation and Returns
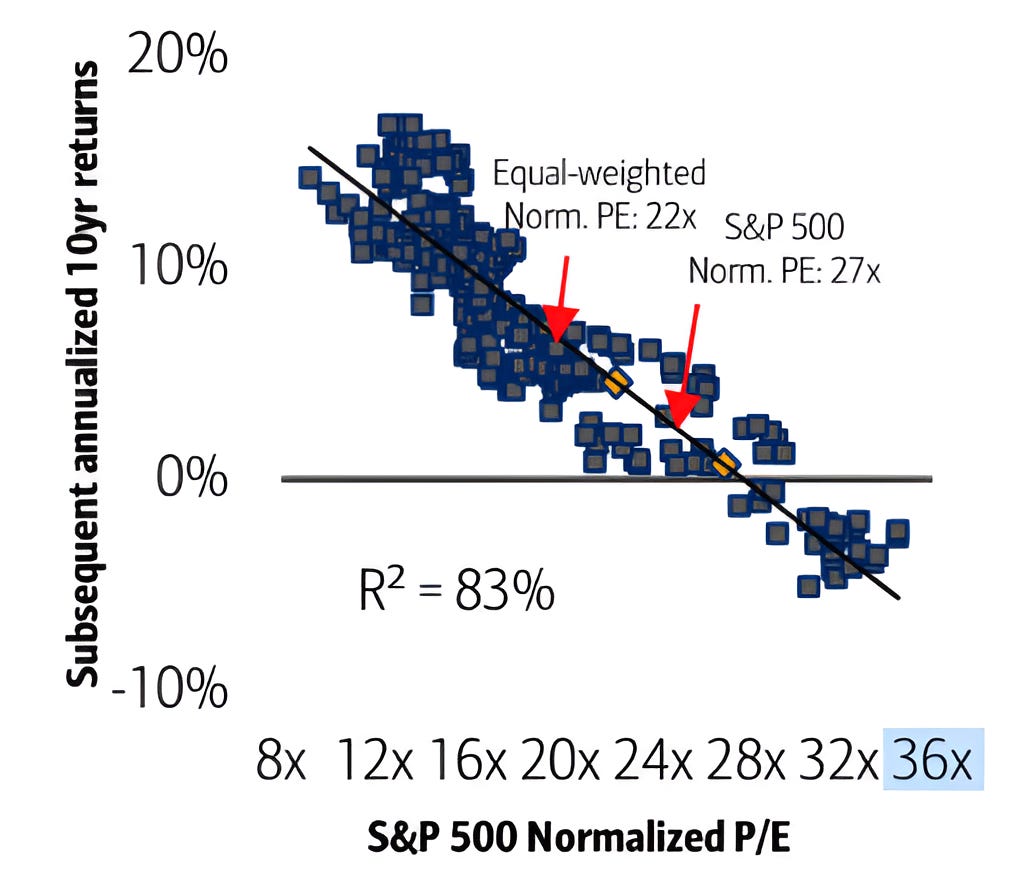
Source: Bank of America. Through year-to-date 2024.
The chart above from Bank of America shows the S&P 500 Normalized PE* and the subsequent 10-year S&P 500 annualized returns.
Based on its measure of Normalized PE, Bank of America estimates the S&P 500 will have a 1-2% annualized return over the next decade, while the Equal Weight S&P 500 will achieve 4-5% annualized returns over the same period.
We recently showed a similar chart from Apollo (here) that presented the relationship the S&P 500 forward PE ratio and subsequent 3-year returns.
However, that analysis, which reached very similar conclusions (2.6% annual return in each of the next three years) only had an r-squared of 21%. The chart above has an r-squared of 83%.
In the Apollo write-up, we highlighted that Goldman Sachs had also recently done a study using the cyclically adjusted price to earnings (CAPE) ratio to project prospective S&P 500 returns.
Goldman’s conclusion was that the S&P 500 would return 3% per year over the next 10 years while the Equal Weight S&P 500 would return 7% a year over the same period.
As we noted when showing the Apollo chart, annualized returns over long periods can occur in many different ways (up then down, down then up, sideways etc.) and we don’t want to prematurely over-react.
That said, the next five to ten years are likely to be characterized by moderate S&P 500 returns. We believe stock picking and sector selection should be able to outperform during this time.
*I am not sure of the official definition of “Normalized PE.” I typically would not present it, however, the conclusions are consistent with the other analyses we’ve highlighted and it is interesting to see three respected research teams studying similar relationships and reaching the same conclusions.
(Past performance is not indicative of future results. This is not a recommendation to buy or sell any security and is not investment advice. Please do your own due diligence).
5. What Happens When It Would Have Been Better to Buy in May?

Source: Carson Investment Research / Ryan Detrick. Through year-to-date 2024.
The chart above shows the performance of the “best six months of the year,” (November through April) when the “sell in May” period (May through October) has been up more than 10%.
Surprisingly (at least to me), since 1954, the “sell in May” period has only been up more than 10% eleven times prior to this year (16% of the time).
When the “sell in May” period has been up more than 10%, the subsequent “best six months of the year” have been up on average 13% (not annualized).
Two weeks ago (here), I considered whether seasonality this year had reversed in, what I called, “Bizarro” fashion.
Looking at a chart of the average path of the S&P 500 during US Presidential election years, I noted that this year the S&P 500 has bottomed at times when the S&P 500 has typically peaked, and had peaked at times when during average during Presidential election years the S&P 500 had bottomed.
As an example, on average, in the two months leading up to a US Presidential election, the S&P 500 has moved lower. This year, the move over the past two months has been higher.
With that in mind, we questioned whether the post-election “relief” rally which is typical (year-end rally’s are common in general), would in 2024 (Bizarro) fashion, be a sell-off instead (or at least soft).
It’s not difficult to come up with a scenario of a contested election and look back to the Bush / Gore election controversy that coincided with the year-end sell-off in 2000 as an analog. However, that period, was already weak due to Q3 earnings misses associated with the dot-com bubble.
All of that said, the chart above may provide an opposite, but simpler view: strength begets strength.
Our bias through the end of the year continues to be higher.
(As a side note, the two other US Presidential election years on the chart above were 1980 and 2020).
(Past performance is not indicative of future results. This is not a recommendation to buy or sell any security, please do your own research).