


One Thing Leads to Another...
With the Nasdaq 100 and Russell 1000 Value both at key levels, the reaction to earnings and revisions to earnings growth should dictate near-term equity moves. Let's dig in...
It always amazes me how major indexes find themselves at important levels just as critical news, economic data or earnings are set to be released.
Regardless of my amazement - here we are again.
The Nasdaq 100, which is a more growth oriented index, and the Russell 1000 Value are both at the underside of critical levels that we’ve identified.
Will earnings be the fuel that fires these indexes to the next rung higher in their journey or will the reception to earnings, after the recent run up, be a buy the rumor, sell the news event?
While we don’t know the answer to that, we have fallen back on the strategy that we have highlighted at different point throughout this year: remain invested, but, if appropriate, tactically add puts and put spreads.
As this is a relatively near-term view, from a longer-term perspective, we want to continue to articulate and highlight our concern with respect to US equities in the second half of December and through at least the first half of 2025.
We have been noting this since the beginning of June (here) and increased the probability in September here.
There are a number of macro imbalances related to our themes of Liquidity (see here, here, here, here, here, here, here, chart 4 here and here) and Fiscal Dominance(see here; here; in chart 5 here; in the introduction here; chart 2 here; and chart 2 here) that are increasingly concerning. I will try to address these in the future.
One thing leads to another…
1. The Nasdaq 100: The Battle Continues!
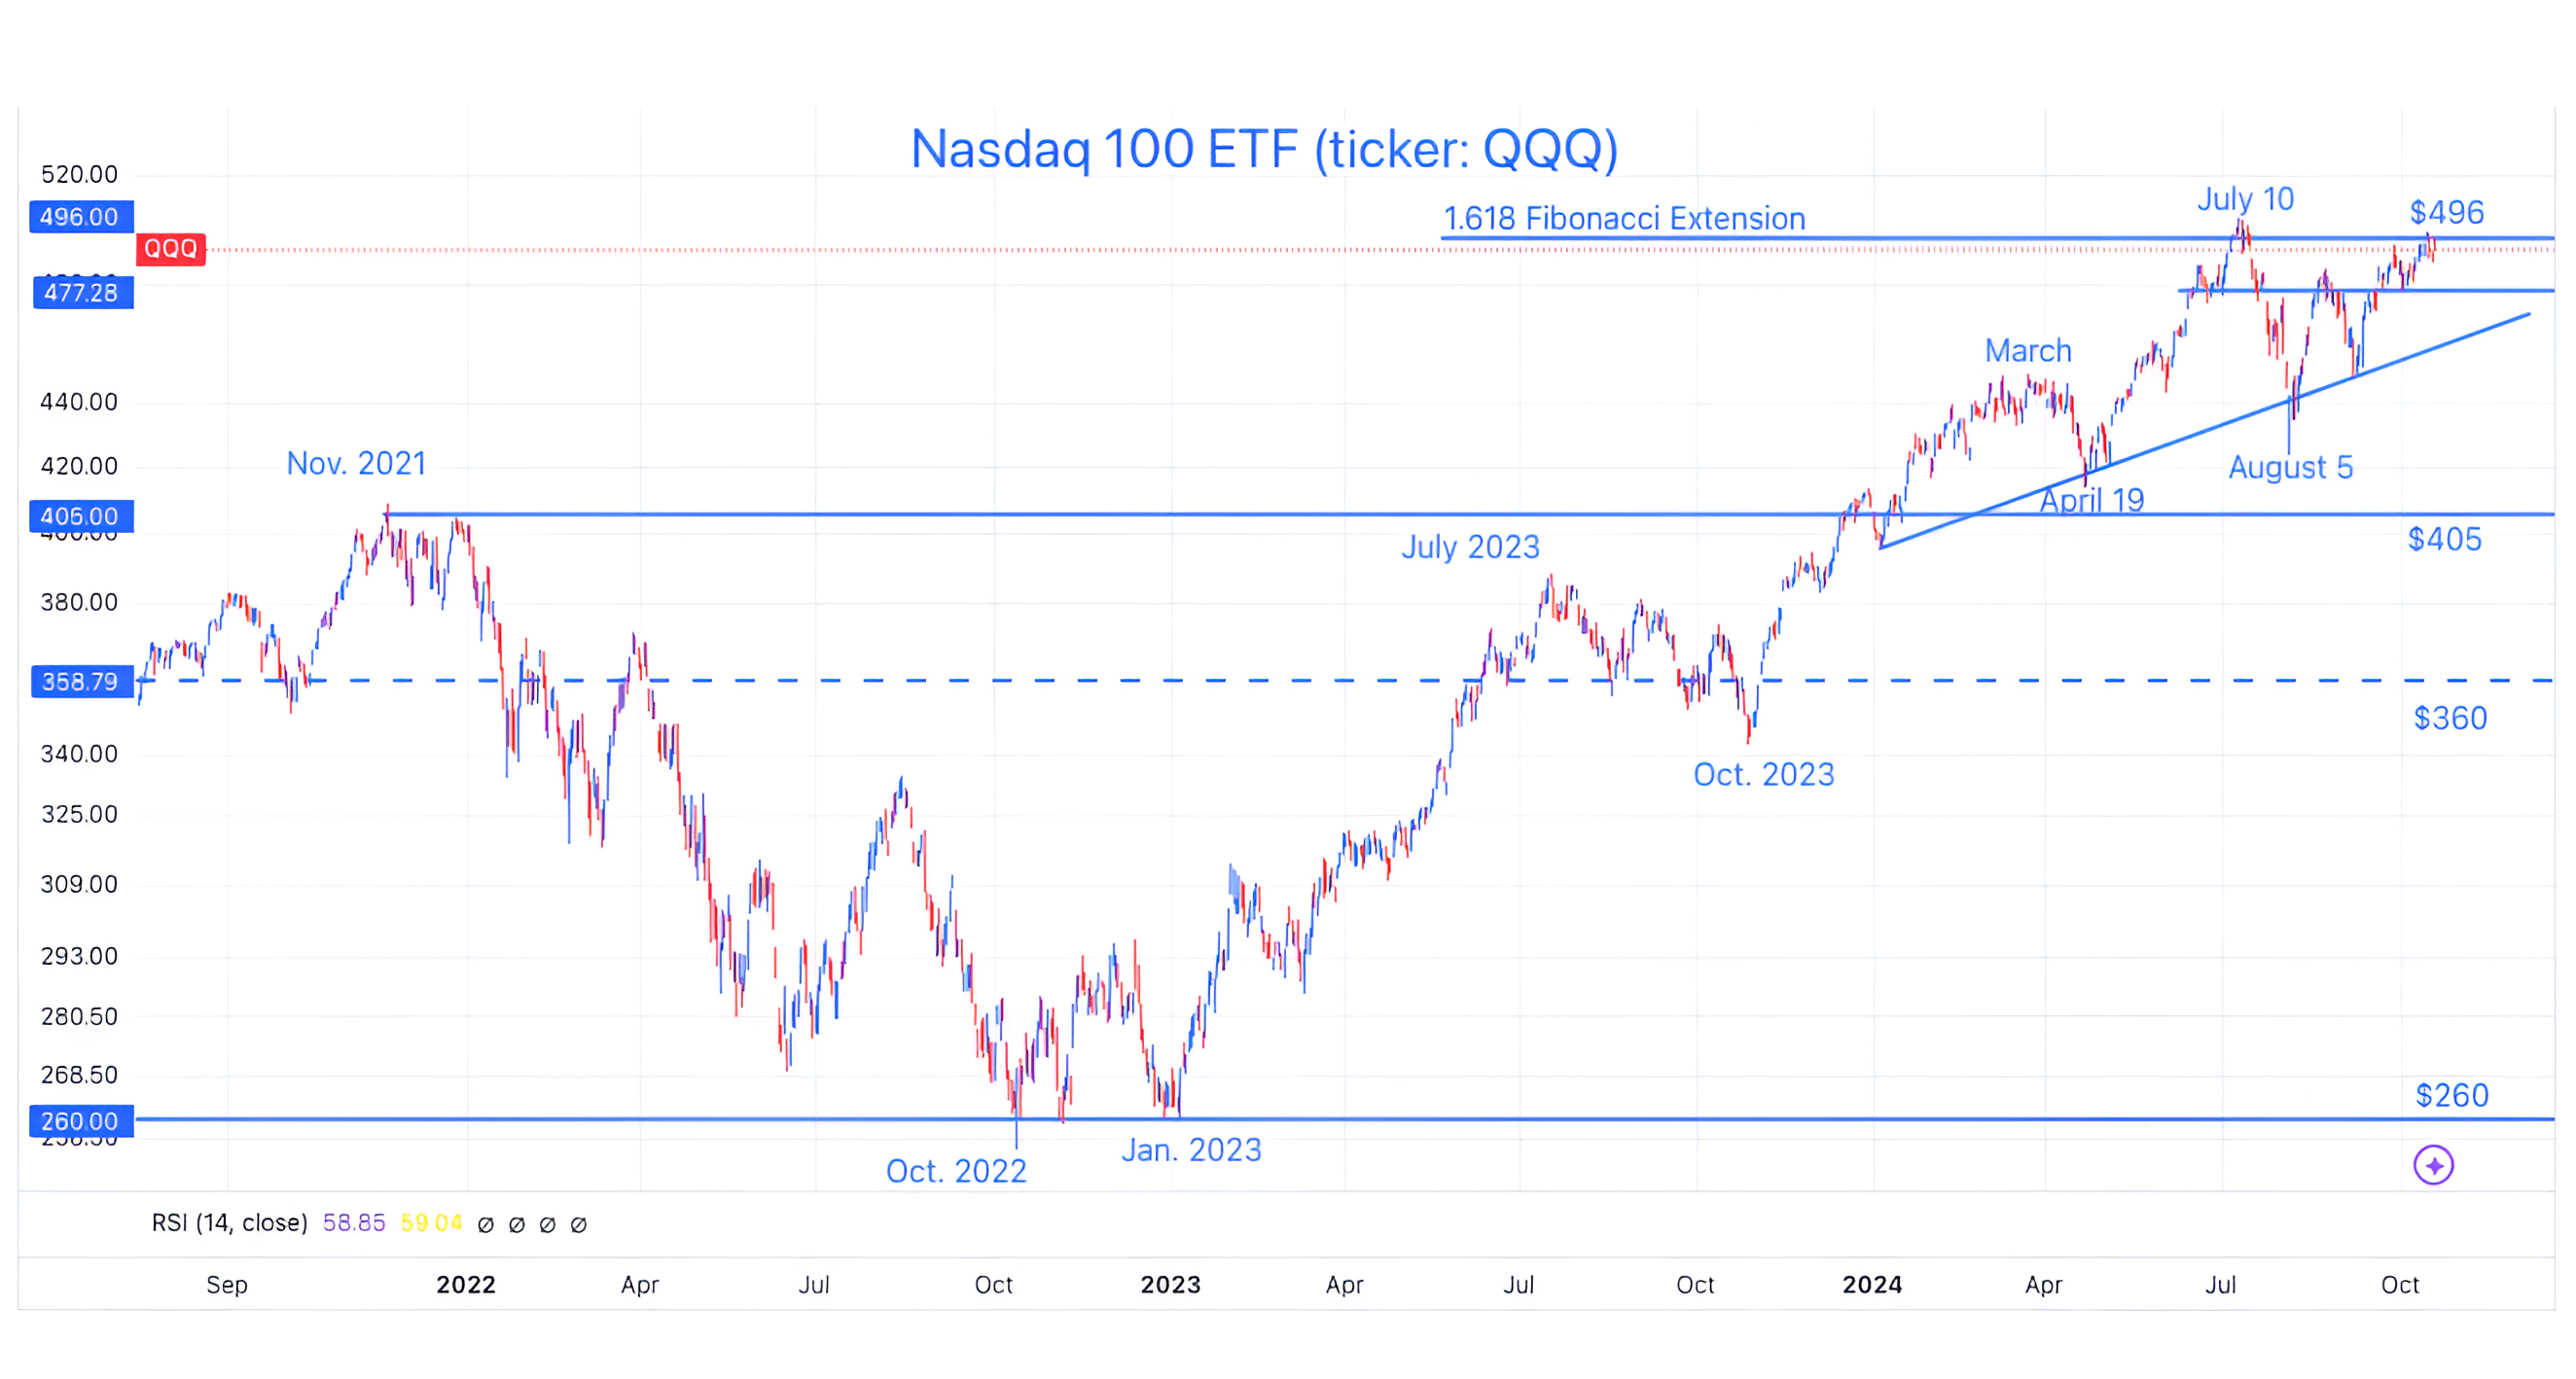
Source: Trading View. Through year-to-date 2024.
The chart above shows the Nasdaq 100 ETF (ticker: QQQ).
On, Tuesday (here), we characterized the chart of the S&P 500 as picture perfect.
In fact, when we look at the Dow Jones Industrials Index or the Equal Weight S&P 500 (chart 2 here), they also look very constructive.
However, where there continue to be questions are in the chart of the Nasdaq 100 (above) and the Russell 1000 Value (chart 2, below).
The Nasdaq 100 is still below its July peak.
All this week, the index has been battling with the $496 level that we identified on July 1 (here).
At the time, we wrote:
“The Nasdaq 100 ETF is nearing our target of $496 which is 3.5% higher than last Friday’s closing level.
Similar to our S&P 500 target, our Nasdaq 100 target reflects the 1.618 Fibonacci extension of the November 2021 to October 2022 sell-off.
Could the Nasdaq 100 move a little above our target?
Absolutely, but our expectation is that there will be a pause and at least a minimal retracement from around that zip code.”
Although the Nasdaq 100 traded slightly above our July 1 target, as we expected, it retraced and, three and half months later, the battle for the north continues.
It is interesting to consider that when we wrote the commentary above on July 1, Q2 earnings season was two weeks away. Our view, at that time, was that the move above the $496 area would be “largely dependent on the sustainability of earnings, earnings growth and expectations.”
Despite the better than expected Q2 earnings season, the Nasdaq 100 has gone nowhere since July 1.
In fact, the initial reaction to Q2 earnings was negative.
With Q3 earnings season upon us, our view is once again that the ability of the Nasdaq 100 to surpass the $496 area will be largely dependent on the sustainability of earnings, earnings growth and expectations remains.
The $496 area on the Nasdaq 100 ETF (around 20,300 on the index) continues to be the battle we are watching.
(This is not a recommendation to buy or sell any security and is not investment advice. Past performance is not indicative of future results. Please do your own research and due diligence).
2. Russell 1000 Value: Ready for a Pause?

Source: Trading View. Through year-to-date 2024.
The chart above shows the Russell 1000 Value ETF (ticker: IWD).
Although we have never presented a formal target for the Russell 1000 Value ETF, similar to the S&P 500 and Nasdaq 100, we view the 1.618 Fibonacci extension of the January 2022 to October 2022 sell-off as a key level.
If this view is correct (and we believe it is), the Russell 1000 Value, after having climbed 11% in 10 weeks, will at least pause around this level.
As the Nasdaq 100, which is mainly a growth index, has gone nowhere in three months, while the S&P 500 has moved steadily beyond its July high, the out-performer since July (and the driver of the S&P 500’s move higher) has been value (financials, utilities, healthcare, industrials, energy).
Given our view that a pause in Value shares is likely, for the S&P 500 to continue its ascent, investors will need to rotate back towards Growth sectors and the Nasdaq 100.
If both the Russell 1000 Value and the Nasdaq 100 are rejected at their respective 1.618 Fibonacci extensions, this will obviously lead to a correction in the S&P 500.
One point that I wanted to highlight in the chart above is that the Russell 1000 Value ETF has had two textbook “retests” this year.
On the chart the retests are circled in green - one occurred in late January and the other mid-April.
As a reminder, a “retest” occurs when a price has moved through a key level, revisits the key level from the other side and either bounces (if price has moved higher) or drops (if price has moved lower). Retests in our view help “confirm” trends and new trading ranges.
If the Russell 1000 Value were to move above $193.50, we would look for a “retest” to confirm the move.
(Past performance is not indicative of further results. This is not a recommendation to buy or sell any security and is not investment advice. Please do your own due diligence).
3. I’m Still Confused About Earnings / Earning Growth
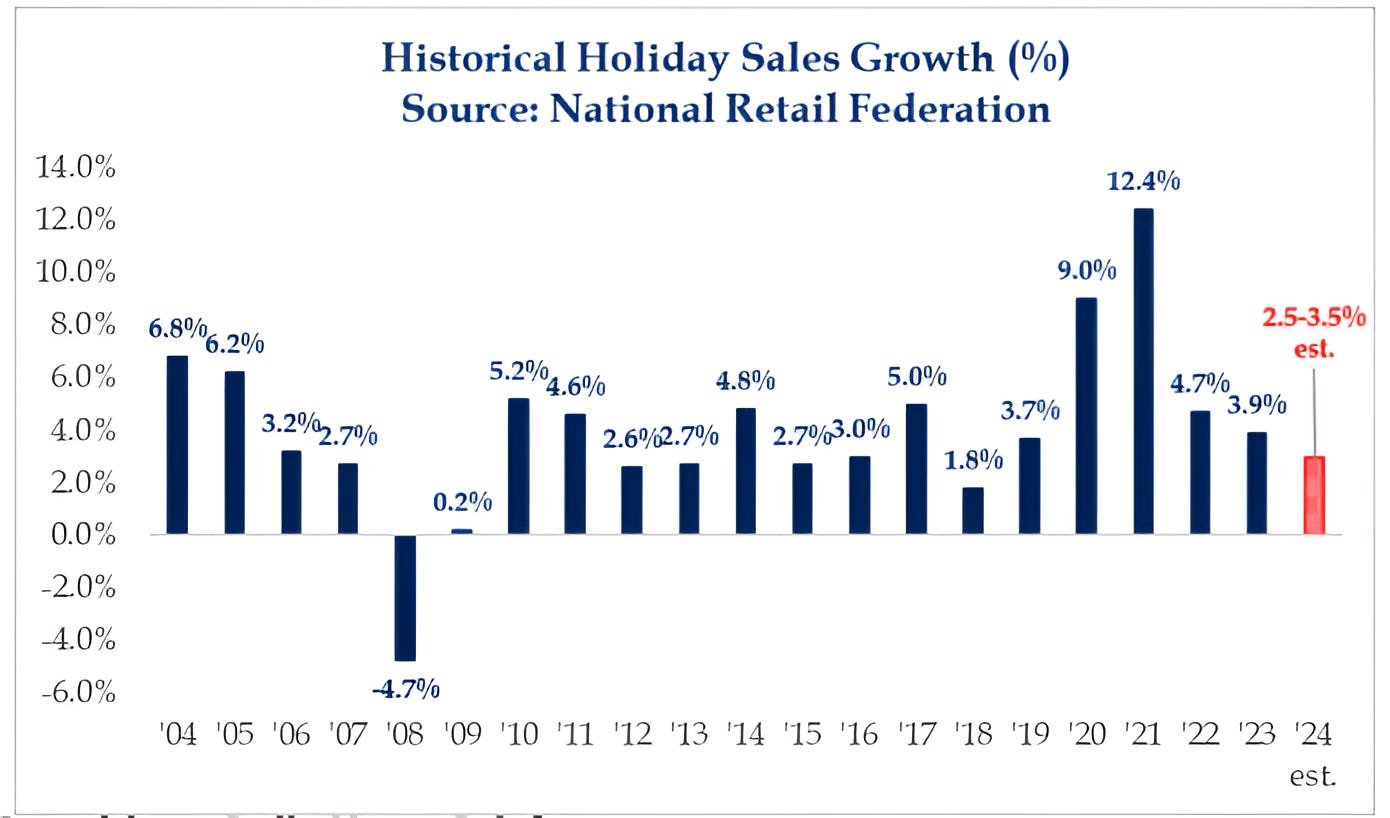
Source: Strategas. Through June 2024.
The chart above shows historical US Holiday (Christmas) Sales Growth with the 2024 estimate included.
2024 is estimated to have the lowest Holiday sales growth since 2018.
Although we live in a nominal world, on an inflation adjusted basis, essentially, no sales growth is expected this Christmas.
Last weekend, I received one of those news pop-ups on my iPhone with the headline: “Halloween is Crunch Time for Troubled Retailers.”
The detail was that, “US spending for the holiday will drop by 5% to $11.6 billion this year, according to the National Retail Federation.” (Bloomberg)
For some time, we have been focused on Q4 2024 and full year 2025 earnings growth estimates. (See here; here; here; chart 3 here; chart 3 here; charts 2, 3 and 4 here; chart 3 here; and chart 3 here).
As a reminder, S&P 500 earnings are expected to grow 14% during Q4 and 14% on average in 2025.
While I recognize that negative Halloween sales growth and the slowest Holiday season in six years do not correlate directly with S&P 500 earnings, I continue to question where the best S&P 500 earnings growth of the last 10 years - outside of the stimulus fueled covid recovery and the Trump tax cut - is going to come from.
If our view is correct, Q4 and 2025 earnings expectations will continue come down pushing PE higher (all else is equal) from already extreme levels (see chart 3 here).
[As an aside, I recognize that there was a positive retail sales report this morning as the Commerce Department said that retail sales increased 0.4% in September slightly better than the 0.3% gain that had been forecast. However, we are thinking about Q4 and 2025 earnings and earnings growth here, September is Q3.]
(Past performance is not indicative of future results. This is not a recommendation to buy or sell any security and is not investment advice. Please do your own due diligence).
4. The Dollar

Source: Trading View. September 2024.
The chart above shows the US Dollar index (DXY).
We last showed the US Dollar in July (here) when it was weakening and we cited it as a tailwind for equities.
In general, moves in the US Dollar have been inverse to equity market performance.
In other words, US Dollar strength has often foreshadowed equity weakness and vice versa.
Since September 30, the Dollar has moved higher 13 of 14 “trading” days.
Despite the inverse relationship, US equities have ignored the October Dollar strength.
In our view, once the Dollar breaches a certain level (similar to the 10-Year US Treasury yield), equities will begin to pay attention.
Unfortunately, we don’t know exactly what that level is.
As the Dollar reaches the $104 level, in our view, it is likely to pause - as this has been an important area in the past.
We will continue to watch the Dollar - with further strength, at some point, equity markets will as well.
(Past performance is not indicative of future results. This is not a recommendation to buy or sell any security and is not investment advice. Please do your own due diligence).
5. Beware Year 3 of the Bull
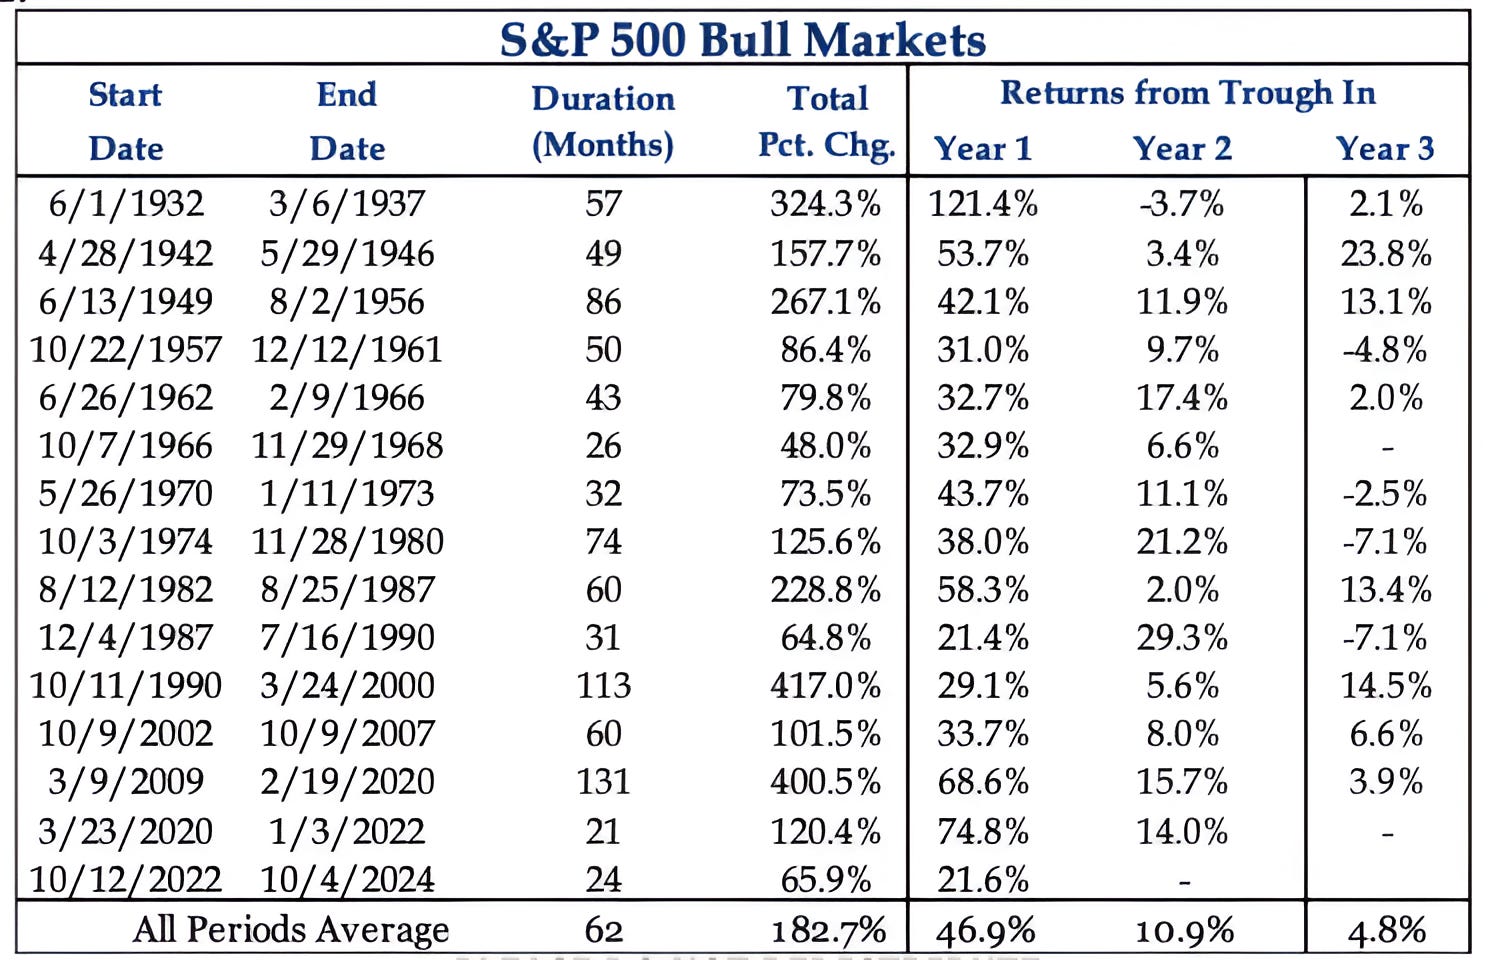
Source: Strategas. Through year-to-date 2024.
Since June 1932, there have been 15 “bull markets” in the US as defined by sustained periods when the S&P 500 appreciated by more than 20%.
The end of each of those bull markets occurred when the S&P 500 fell by more than 20%.
The chart above captures the trough to peak returns of each of these 12 bull markets and shows the returns per year (not calendar years) of those periods.
On average, the previous 14 bull markets have lasted around five years (62 months).
The current bull market (number 15) turned two last Friday and we wanted to begin to consider how year 3 has looked in previous bulls.
The post-covid bull market that began in March 2020 (bottom) and ended in January 2022 (top) was the shortest of the previous 14 bull markets. It ended just before it turned two (as represented by the “-” in the year three column). One other bull market ended in year three.
The average year 3 return of the remaining 12 bull markets has been 4.8%.
However, incorporating the year 3 sell-offs from the 1966 and 2020 bull markets into the calculation would drag down the average of the total sample.
8 out of the 14 (57%) previous bull markets have exhibited positive performance in year three.
Our view that there is an above average probability of significant equity volatility as we move into to 2025 has been well documented.
At the beginning of June (here), we wrote:
“We see the possibility (10-15% likelihood) of a 30% sell-off that would see the S&P 500 bottom around 4000-4200 in 2025 from a peak of 5500-5800 in 2024.”
We increased our view of the likelihood of a significant sell-off to 20-30% in early September here.
The chart above is consistent with those views - that said, we do not want to preemptively sell.
Instead, we will wait for the signal from the charts (this is why I show them) and we show charts and present our framework to be prepared and to have a plan.
(Past performance is not indicative of future results. This is not a recommendation to buy or sell any security, please do your own research).