


Fight the Power!
With the US election two weeks away, earnings season upon us and the government spending at a torrid pace, we try to parse out the market signal from noise. Let's dig in...
For those of us that grew up during a certain era and spend more time in the comments sections of on-line posts than on the posts themselves, the vitriol of the current period is eerily reminiscent of the late 1980s and early 1990s.
It is interesting to consider that the US economy in the late 1980 and early 1990s (before the 1992 recession) was somewhat similar to today’s in that it was growing, but it certainly wasn’t great for every one.
Crack cocaine and AIDS had scarred a generation and race relations, leading up to and in the wake of the Rodney King verdict (that acquitted police officers of beating a black man despite video evidence to the contrary) were poor.
President Bush (the first one) was forced to raise taxes after famously saying he wouldn’t do so (“read my lips”) and an unlikely, outsider, Bill Clinton became President after a third party candidate Ross Perot captured votes for those that were looking for significant change.
One movie, “Do the Right Thing,” captured the zeitgeist of the time and it’s powerful soundtrack from Public Enemy embodied the anger and frustration of the moment.
It is rare to have the economy growing, the S&P 500 at all-time highs, unemployment so low, few people happy, and everyone, on both sides, voting for change, but here we are.
Fight the Power!

1. Checking in on the Small Caps

Source: Trading View. Through year-to-date 2024.
The chart above shows the Russell 2000 Small Cap ETF (ticker: IWM).
Last Thursday, we highlighted the fact that when we look at the S&P 500, the Dow Jones Industrials Index or the Equal Weight S&P 500 (chart 2 here), each looks very constructive, but there continue to be questions in the charts of the Nasdaq 100 and the Russell 1000 Value (charts 1 and 2 here).
We can add the Russell 2000 to the questions list as the index is battling its 2021 ceiling and is not yet back to its 2021 peak.
A thoughtful client said to me that a combination of a Trump victory and lower interest rates should be bullish for Small Caps.
Small Caps were up nearly 50% during the first year of Trump term one and outperformed large caps in that period.
As Small Caps are considered to be more sensitive to the domestic economy than large caps, a rate cut should in theory should be supportive.
That said, given the technical (rather than fundamental) nature of this market, for the time being, I would rather allocate to the constructive charts - the S&P 500, the Equal Weight S&P 500 and the Dow Industrials than the challenged chart of the Russell 2000
If I were going to fight a previous ceiling level in an index, currently, I would focus more on the Nasdaq 100 than the Russell 2000.
(This is not a recommendation to buy or sell any security and is not investment advice. Past performance is not indicative of future results. Please do your own research and due diligence).
2. Earnings Have Done What We Expected. Will it Matter to the Market?
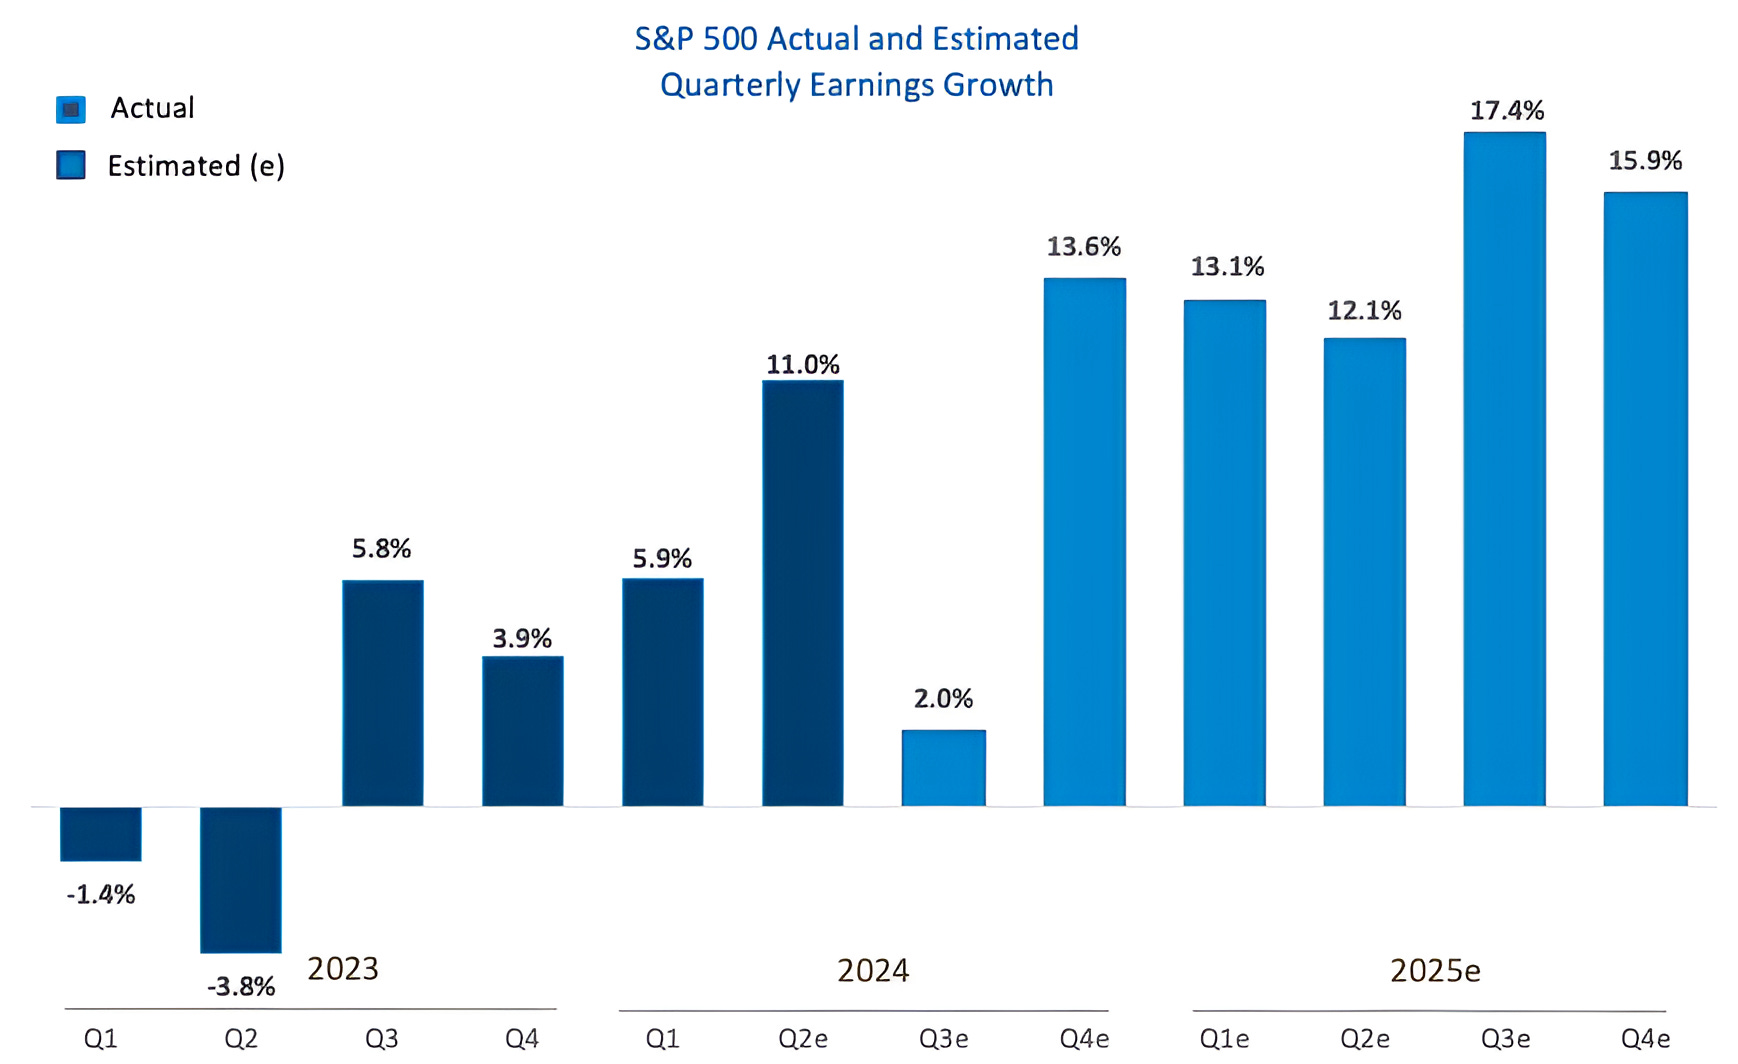
Source: FactSet and Luminos Advisors. Through year-to-date 2024.
The chart above shows the Historical (dark blue) and Projected (light blue) S&P 500 quarterly earnings growth.
We have highlighted our concern that S&P 500 earnings projections are too high several times including last Thursday (chart 3 here) as well here; here; here; chart 3 here; chart 3 here; charts 2, 3 and 4 here; chart 3 here; and chart 3 here.
Over the past two weeks (from October 4 to October 18), a period that includes the beginning of Q3 earnings season, the estimate for Q3 earnings has decreased.
Since October 4, analysts have lowered their Q3 earnings estimates nearly 1% from $60.63 to $60.07. (FactSet). (It was even higher when we showed the chart of quarterly S&P 500 earnings estimates - not growth - on October 1 here).
The current expectations, as can be seen on the chart above, is that Q3 S&P 500 earnings will grow 2%.
While the S&P 500 overall is expected to grow earning 2% in Q3, the Magnificent 7 - Google, Amazon, Meta, Microsoft, Nvidia, Apple and Tesla - are expected to grow earnings 18% during this period.
The “other 493” (companies in the S&P 500) are expected to grow earnings 0.1% during Q3. (FactSet).
However, as can be seen on the chart, despite the weak modest earnings growth during Q3 and essentially no earnings growth from 90% of the S&P 500, analysts are expecting the next five quarters of earnings to be some of the strongest - outside of the pandemic and the Trump corporate tax cut - of the last 10 years.
With the S&P 500 trading at 22x next 12 months earnings (Q4 2024 through Q3 2025), we consider the valuation to be demanding.
While valuation is not a catalyst, disappointing earnings (depending on how disappointing) can be.
We continue to question where the earnings and earnings growth will come from over the next five quarters and if the market will care.
(Past performance is not indicative of further results. This is not a recommendation to buy or sell any security and is not investment advice. Please do your own due diligence).
3. High Valuation Correlated With Lower Long-Term Returns
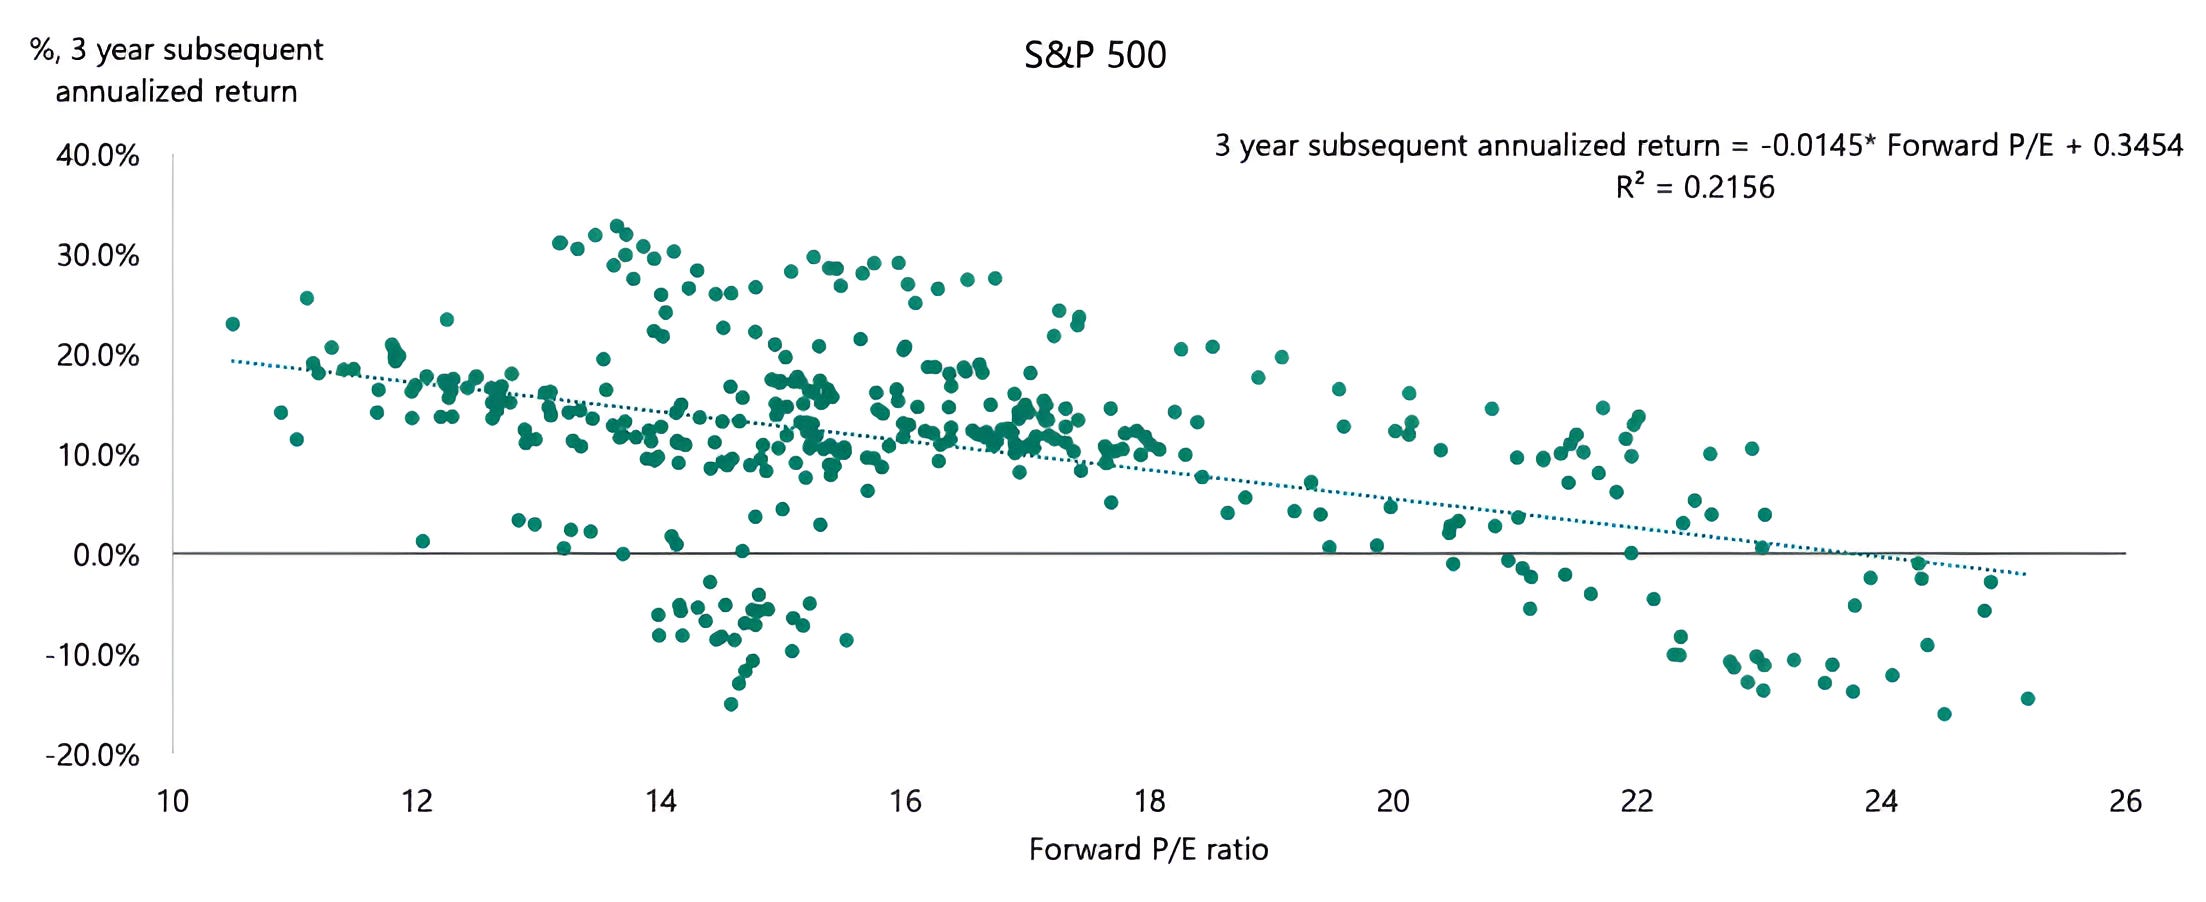
Source: Apollo Chief Economist. Through June 2024.
The chart above shows the negative correlation between the forward price / earnings ratio of the S&P 500 and its 3-year subsequent annualized returns.
Based on 22x next 12 months earnings (Q4 2024 through Q3 2025), the model with an r-squared of 21% suggests a 2.6% annual return in each of the next three years.
Goldman recently did a well publicized study using the cyclically adjusted price to earnings (CAPE) ratio to conclude that the S&P 500 would return 3% per year over the next 10 years.
The good news was they were also able to conclude that the Equal Weight S&P 500 will return 7% a year over the same period.
My all-star former analyst, Andrew Zhang, did an analysis on several valuation measures (price to sales, price to cash flow and price to earnings) over different time periods (1, 3, 5 and 10-years) and found that, regardless of valuation methodology, returns over 3, 5 and 10 years were negatively correlated with starting valuations and the fit with the model increased to five years and flattened thereafter.
There is little correlation with valuation levels and near-term returns.
Finally, it is important to remember that returns don’t occur in a straight line.
In other words, the path of the 2.6% return expectation could be an immediate sell-off followed by a climb; an extreme climb followed by a sell-off; a choppy three years; or a combination of all.
As an example, in chart 1, above, it’s easy to see that the Russell 2000 Small Cap Index has returned 0% in three years.
However, over the past year (October 2023 to October 2024), the Russell 2000 is up nearly 40%.
What this means to us is that “buy and hold” as a strategy and may be challenging over the next three years and possibly longer.
In our view, active management will be the key to future portfolio outperformance.
(Past performance is not indicative of future results. This is not a recommendation to buy or sell any security and is not investment advice. Please do your own due diligence).
4. This Will Be a Problem at Some Point
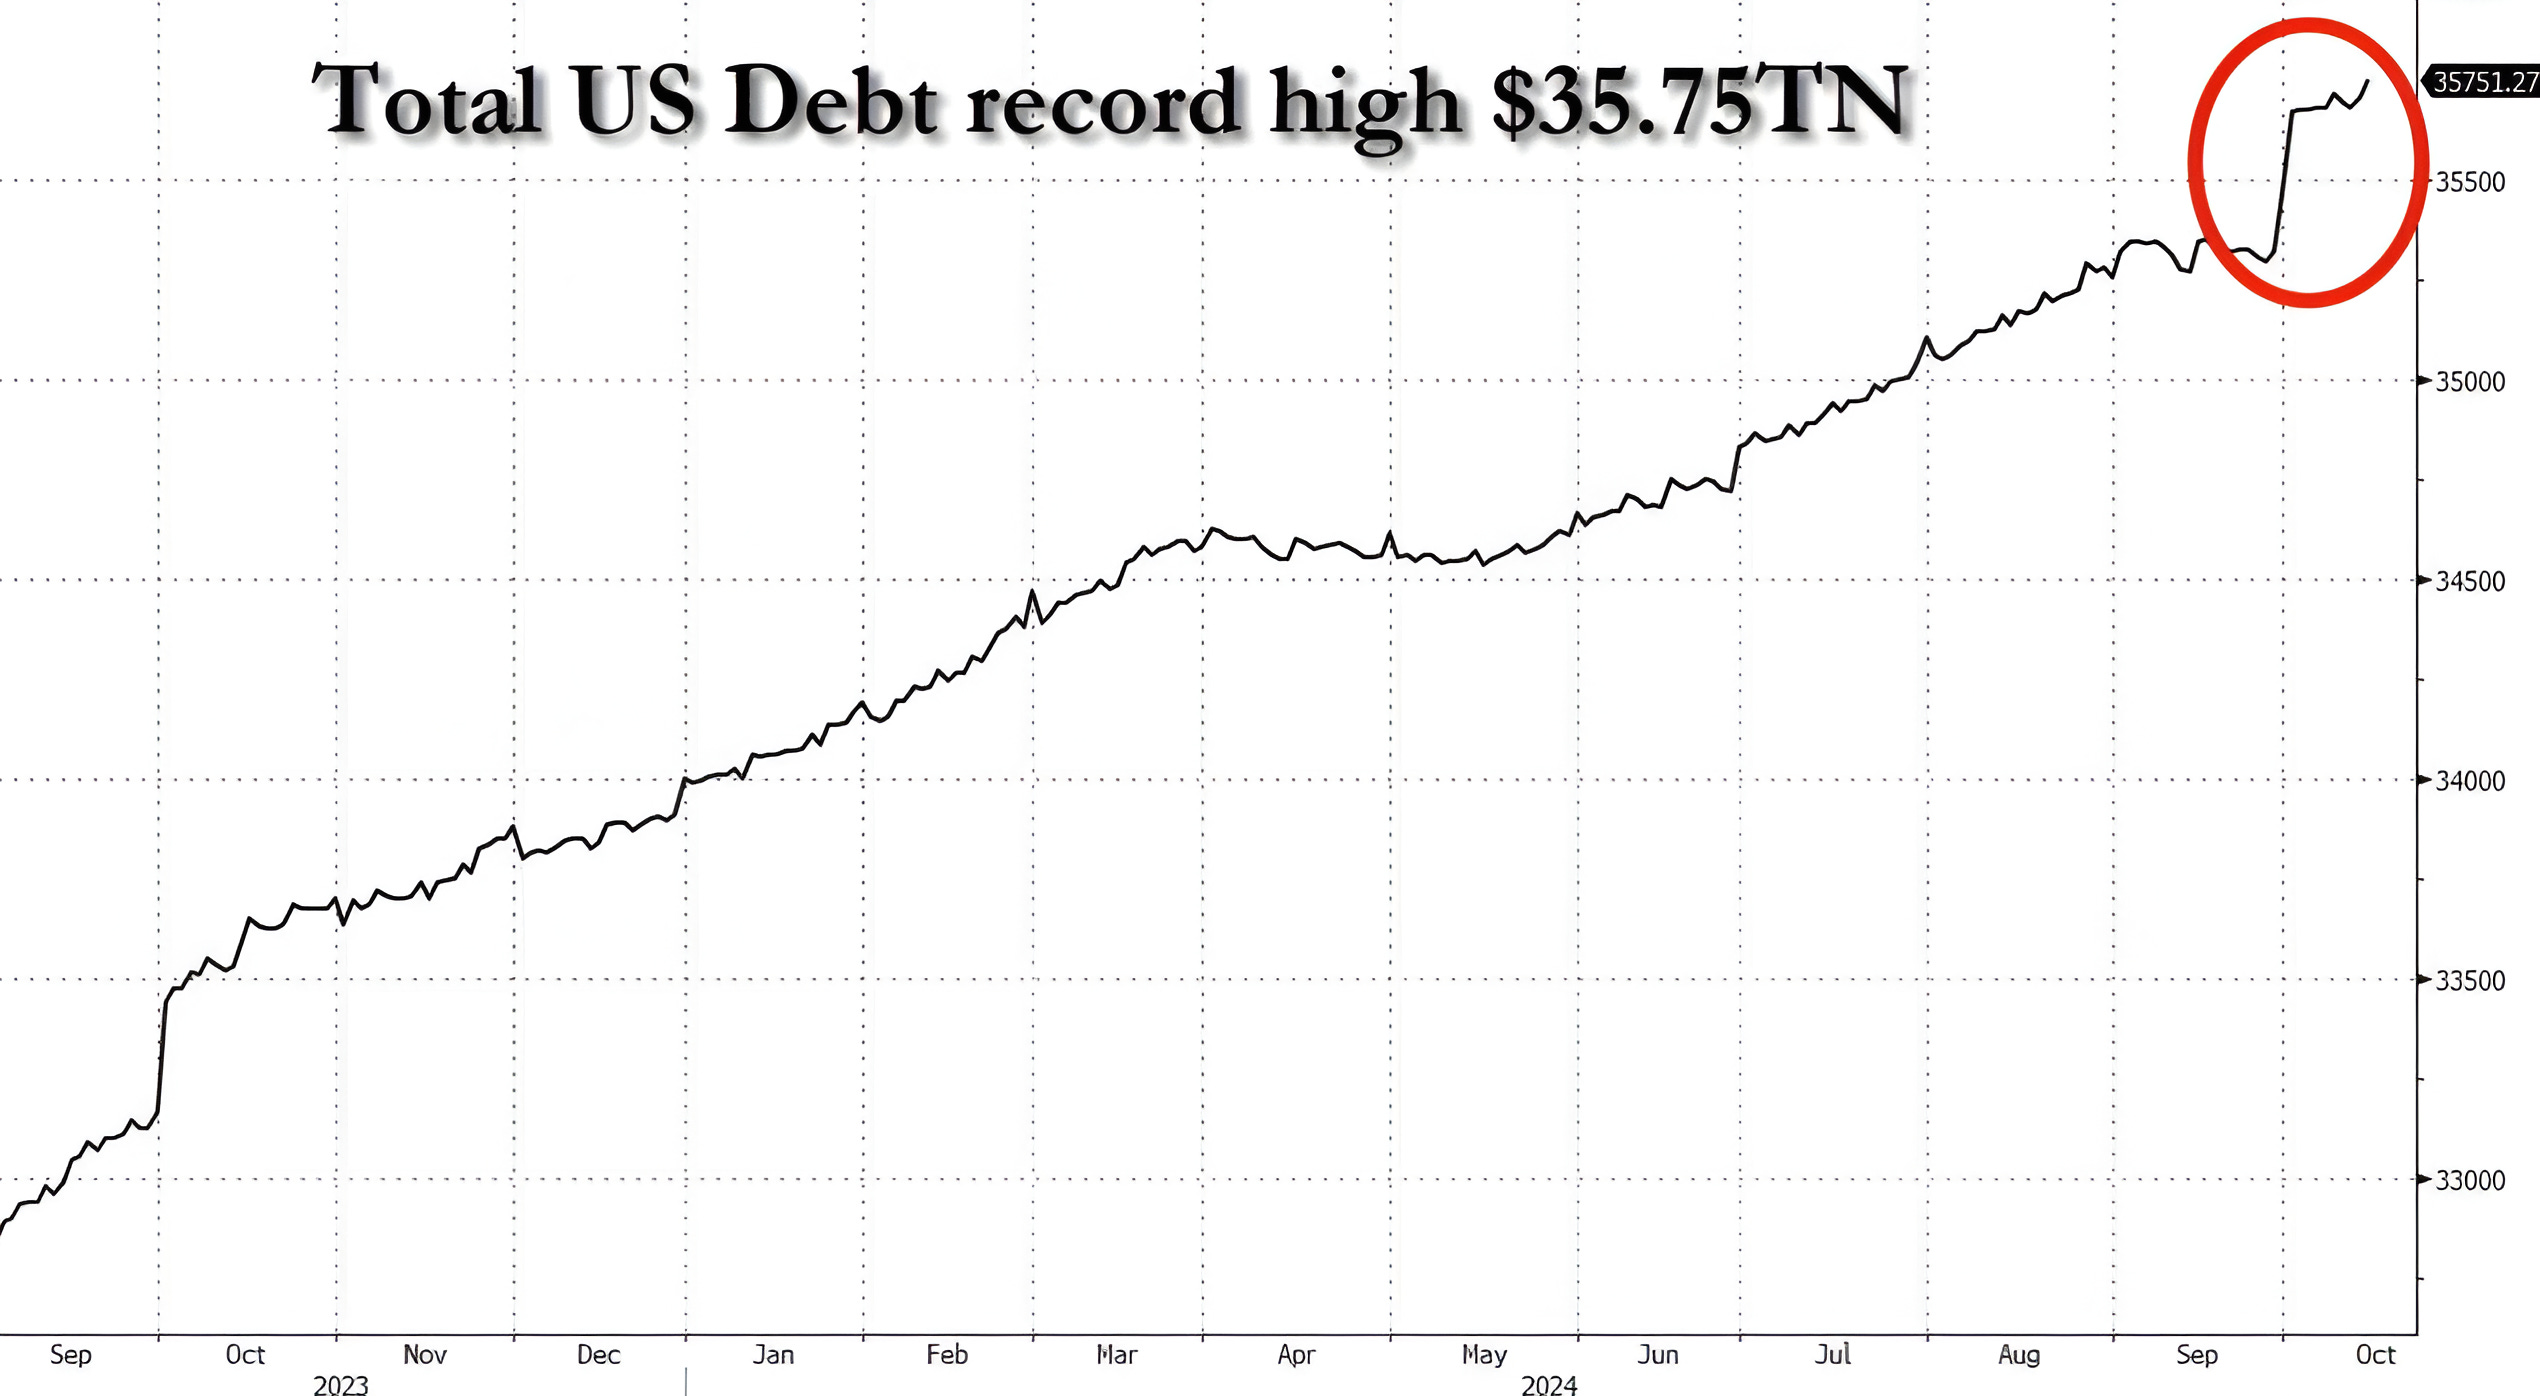
Source: Bloomberg. Through year-to-date 2024.
The chart above shows the dollar value of US debt outstanding.
Last Thursday we wrote:
“We want to continue to articulate and highlight our concern with respect to US equities in the second half of December and through at least the first half of 2025.
We have been noting this since the beginning of June (here) and increased the probability in September here.
There are a number of macro imbalances related to our themes of Liquidity (see here, here, here, here, here, here, here, chart 4 here and here) and Fiscal Dominance (see here; here; in chart 5 here; in the introduction here; chart 2 here; and chart 2 here) that are increasingly concerning. I will try to address these in the future.”
The chart above and the chart below (chart 5) is the start of my trying to address these themes.
First of all, while the absolute value of US debt outstanding - nearly $36 trillion - is hard to reconcile, the $500 billion added over the last month is nearly impossible to understand.
With an election coming and having studied political science and economics at University, it is easy to come up with conspiracy theories as to why the government might want to increase spending.
However, rather than consider motives, it is more constructive to consider what may be next.
In our view, the debt outstanding will likely become a greater focus of the electorate, politicians and most importantly the bond market.
Let’s consider the potential buyers of US Treasuries:
China - the second largest holder of US debt given the not in a position to buy;
Japan - the largest holder - may not be adding to its holdings;
With oil prices low and US production high, there are fewer US dollars going to petro states to buy US Treasuries; and
US banks have already increased Treasury holdings to meet stricter capital requirements.
Perhaps the buyers of Treasuries will be pension funds and insurance companies.
The challenge is the “bond vigilantes.”
These are the traders that require higher yields given the debt outstanding and likely future deficits.
Stan Druckenmiller, a person I often cite and, in my opinion, one of the greatest traders / investors ever, has apparently bet 20% of his personal portfolio that the market will require higher long-term bond yields.
There are three ways out of a debt cycle like this:
Austerity: the government can cut spending. This will
crashslow the economy and will not be popular.Increase taxes: this too would be challenging for the economy if not done in a thoughtful way and likely will not be popular.
Inflation: pay for 2024 dollars with less valuable 2028 (as an example dollars).
My view is that the politicians will try to inflate their way out - this would be consistent with our view that inflation, after exceeding 6%, comes in waves.
However, this is not a simple policy would likely be accompanied by higher 10-Year Treasury yields.
Treasury Secretary Yellen said today that a “Fiscal deficit reduction is required over the coming years.”
In other words, she is looking for the next administration to clean up this mess.
This, in our view, along with the associated higher long-term Treasury Yields, could be the pin that pricks the valuation bubble.
As we wrote here:
In our view, if investors (bond vigilantes) become concerned about the amount of US debt outstanding (over $35 trillion), they may begin to require higher long-term Treasury yields (above 4.30%?) to compensate them for the risk.
In our view, it is possible that the Fed, as a part of its easing cycle could once again expand its balance sheet (QE).
In this scenario, the Fed would once again be buying Treasuries, reducing their yield, stimulating the economy and sending equities higher.
Essentially, the path could include a sell-off (the first half of 2025?) as higher yields raise investor concerns and this sell-off would be followed by QE to lower yields and equities would rally.
(Past performance is not indicative of future results. This is not a recommendation to buy or sell any security and is not investment advice. Please do your own due diligence).
5. Is this the Impact of Fiscal Dominance or Noise?
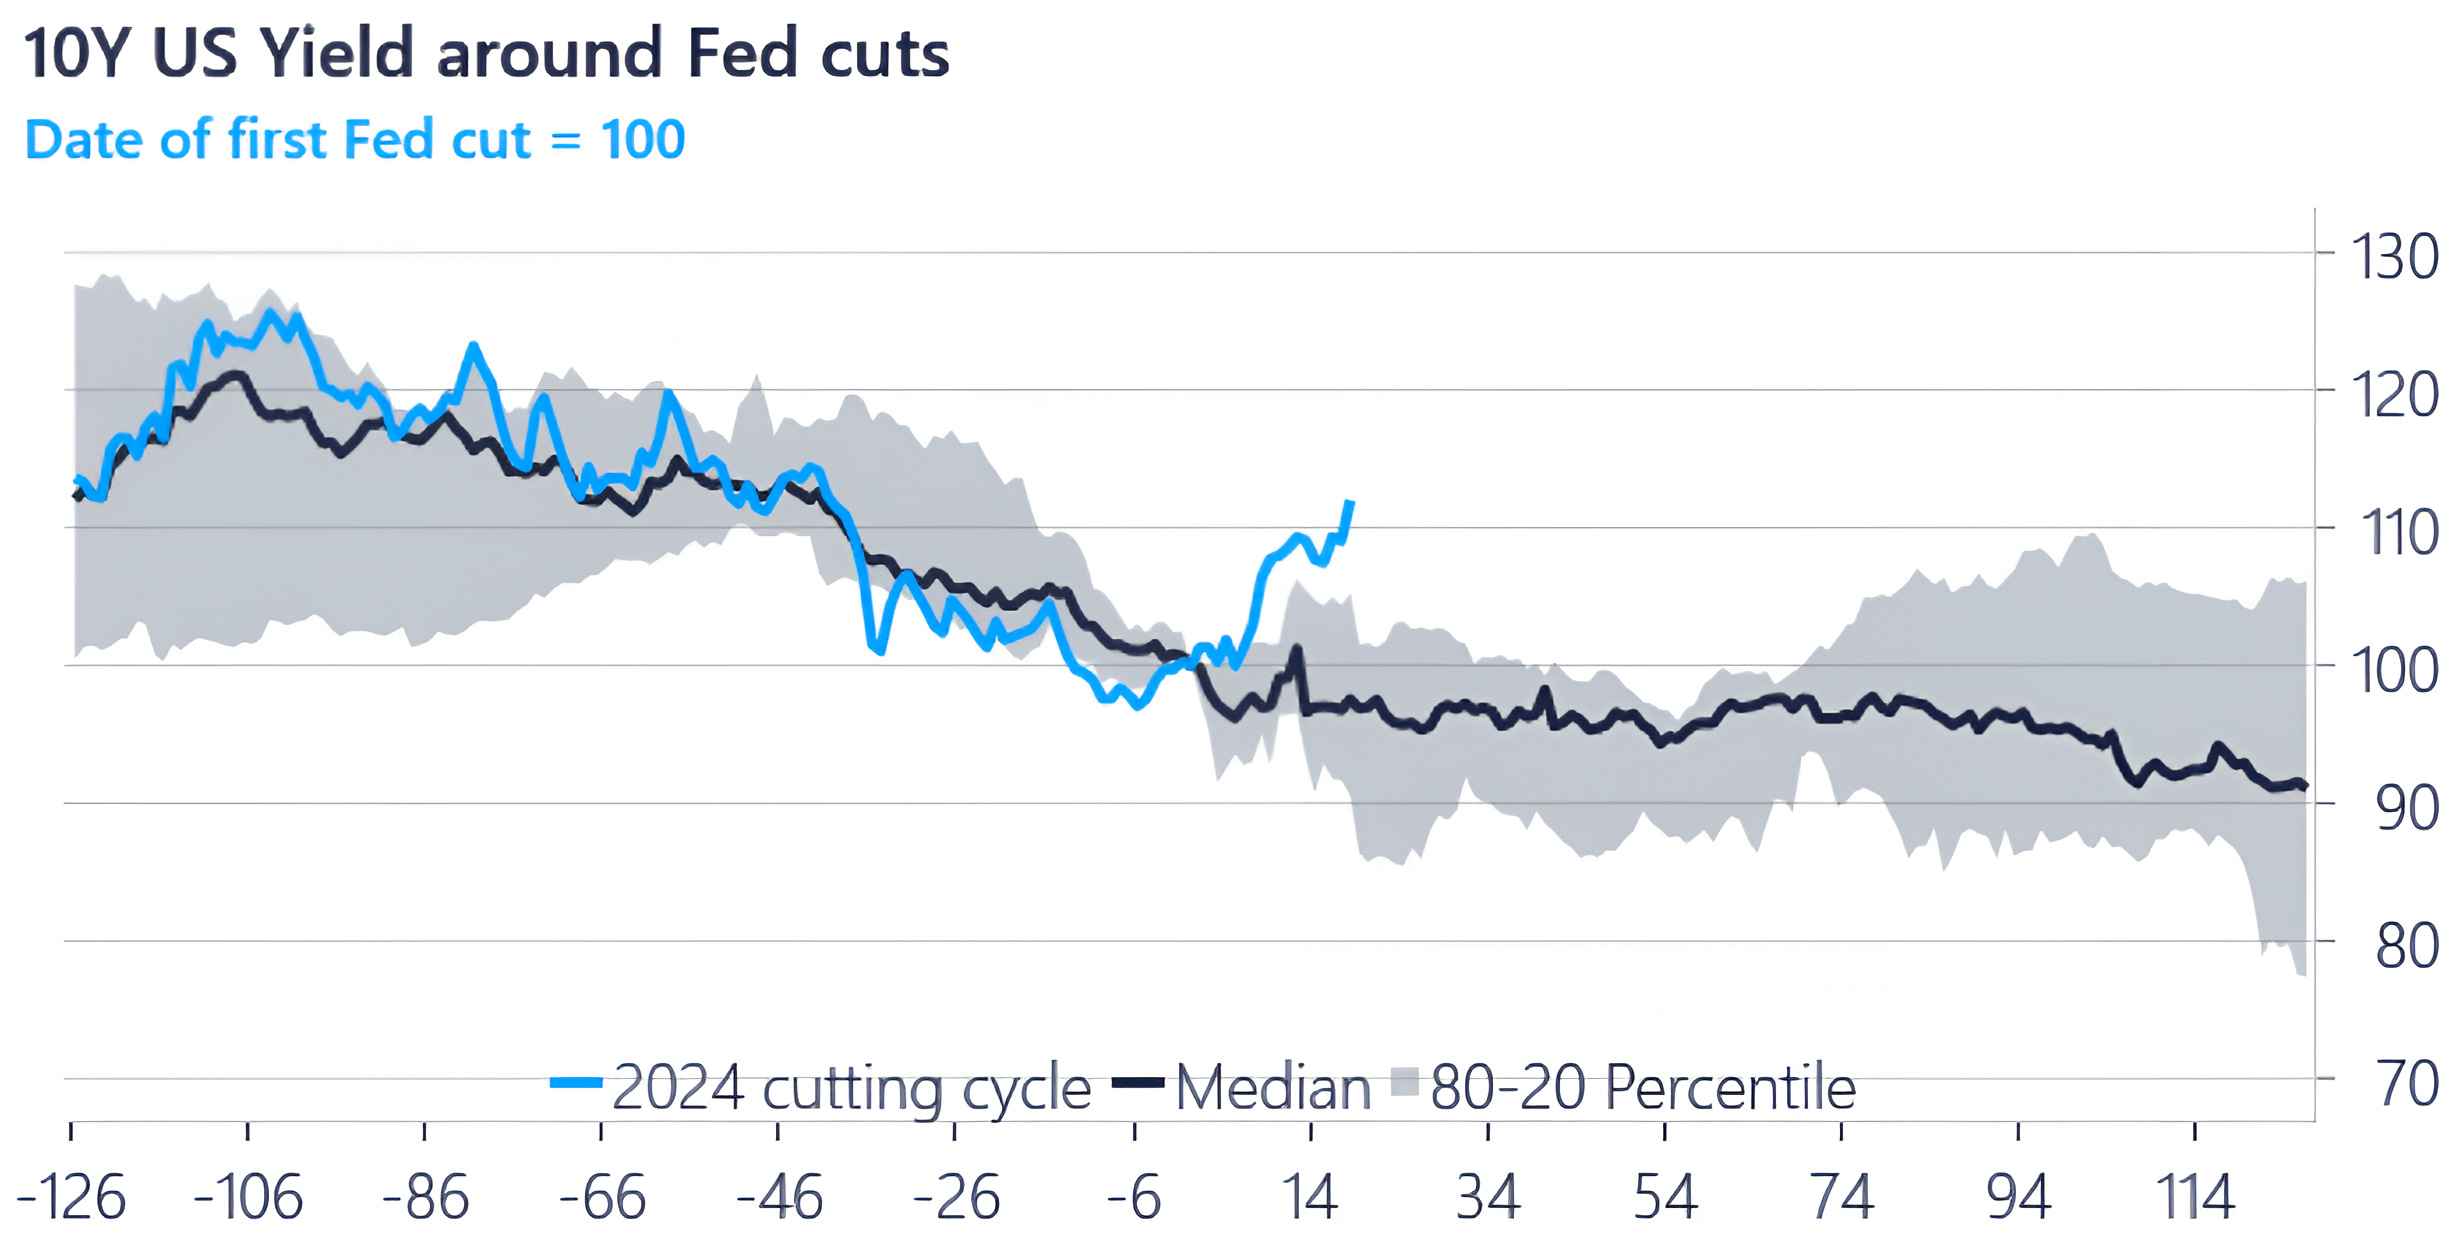
Source: Steno Research and Macrobond. Through year-to-date 2024.
The chart above shows the median path of the 10-Year US Treasury yields (black line); the 20-80% range of prior moves (grey area); and the current path (light blue) around Fed cuts.
As we wrote here:
“Fiscal dominance is an economic condition that arises when debts and deficits are so high that monetary policy loses traction.
In a fiscal dominance regime, the central bank is forced to lower rates to help fund the government deficits.
Given the debt outstanding, continuing growing budget deficits and fiscal dominance, there is a risk that “bond vigilantes” force longer-maturity Treasury security yields higher and demand discipline in the form of higher taxes and / or spending cuts on the Federal government.”
I don’t think the current move is the start of the true Fiscal Dominance regime.
I expect 10-Year Treasury yields to moderate post the election.
I do however, think that the current move higher could be a “shot across the bow.”
Meaning that if the Fed cuts in November and December as expected, the reaction to the December cut could be a more sustainable move higher in longer-term yields as the concept of Fiscal Dominance takes hold.
Rather than making this a prediction, I would consider this something to watch for that would need to be confirmed by price (charts).
(Past performance is not indicative of future results. This is not a recommendation to buy or sell any security, please do your own research).