


Domo Arigato, Mr. Roboto
Despite the down-drift in equities, the Nasdaq has not suffered back-to-back down days in 32 sessions. Is this bullish signal the result of hyper-scaler spending on AI? Let's dig in...
Over the past week, I have had multiple calls with Venture Capitalists - both large and small, early stage and late stage - and there is little doubt that the AI boom is in full swing.
This is not a new theme for us as we have highlighted Nvidia several times starting in February here and more recently analysts reaction to Nvidia’s Q2 earnings in late August chart 3 here. Furthermore, we have been tracking hyper-scaler cap-ex (chart 2 here; chart 2 here; and chart 3 below) as well as peripheral AI beneficiaries (charts 3 and 4 here and chart 4 below).
In our view, over the next five to ten years, similar to the mobile technology boom, there will be several companies that become household names that are unknown today.
Institutions, endowments, pensions and individuals are funding the Venture Capitalists and the next generation of AI companies as the hyper-scalers are currently funding the infrastructure.
Despite inconsistent economic data, outsized US government debt, questionable large cap US earnings growth expectations and our concerns of a meaningful sell-off in the first half of 2025, we see AI - from infrastructure to the application layer - as a durable investment theme for long-term investors.
That said, as we saw in the early stages of the internet boom and the mobile technology revolution, these thematic cycles can be accompanied by significant public market volatility.
In other words, just because there is a long-term opportunity, it doesn’t mean stocks or valuations will move up in a straight line.
Thank you very mucho, Mr. Robato.

Mr. Roboto, Styx
1. The Dow Industrials…

Source: Trading View. Through year-to-date 2024.
The chart above shows the Dow Industrials Index.
While the Dow Industrials Index is no longer the key US benchmark, in our view, it is still relevant and can provide clues about the underlying strength and trend of the broader market.
We have continued to note that the Dow Jones Industrials, the S&P 500 and the Equal Weight S&P 500 (chart 2 here) are the strongest of the major US indexes. Each looks very constructive, however, we would consider the Dow Industrials the most fragile of the group.
Why?
For each of these indexes (and for the Nasdaq 100), we have highlighted the 1.618 Fibonacci extension of the January to October 2022 sell-off as a key level.
While each has surpassed this key level, with the equity pullback over the past week, each index is heading back down towards this level and the Dow Industrials is now the closest to revisiting from the north.
We have written about the idea of a retest.
As a reminder, a successful “retest” occurs when a price has moved through a key level, revisits the key level from the other side and either bounces (if price has moved higher) or drops (if price has moved lower). Retests in our view help “confirm” trends and new trading ranges.
While the Dow Industrials experienced congestion at 42,000 - the 1.618 Fibonacci extension of its January to October 2022 sell-off, since the Index moved above this level, it has not come back down to revisit or retest.
In our view, if the Dow Industrials does come back down towards 42,000, its reaction - either a bounce or a drop through - will be a barometer for what may be in store for the S&P 500.
(This is not a recommendation to buy or sell any security and is not investment advice. Past performance is not indicative of future results. Please do your own research and due diligence).
2. Is this a Change in Trend with Technology Relative to the S&P 500 or Just a Pause in Outperformance?
Source: Trading View. Through year-to-date 2024.
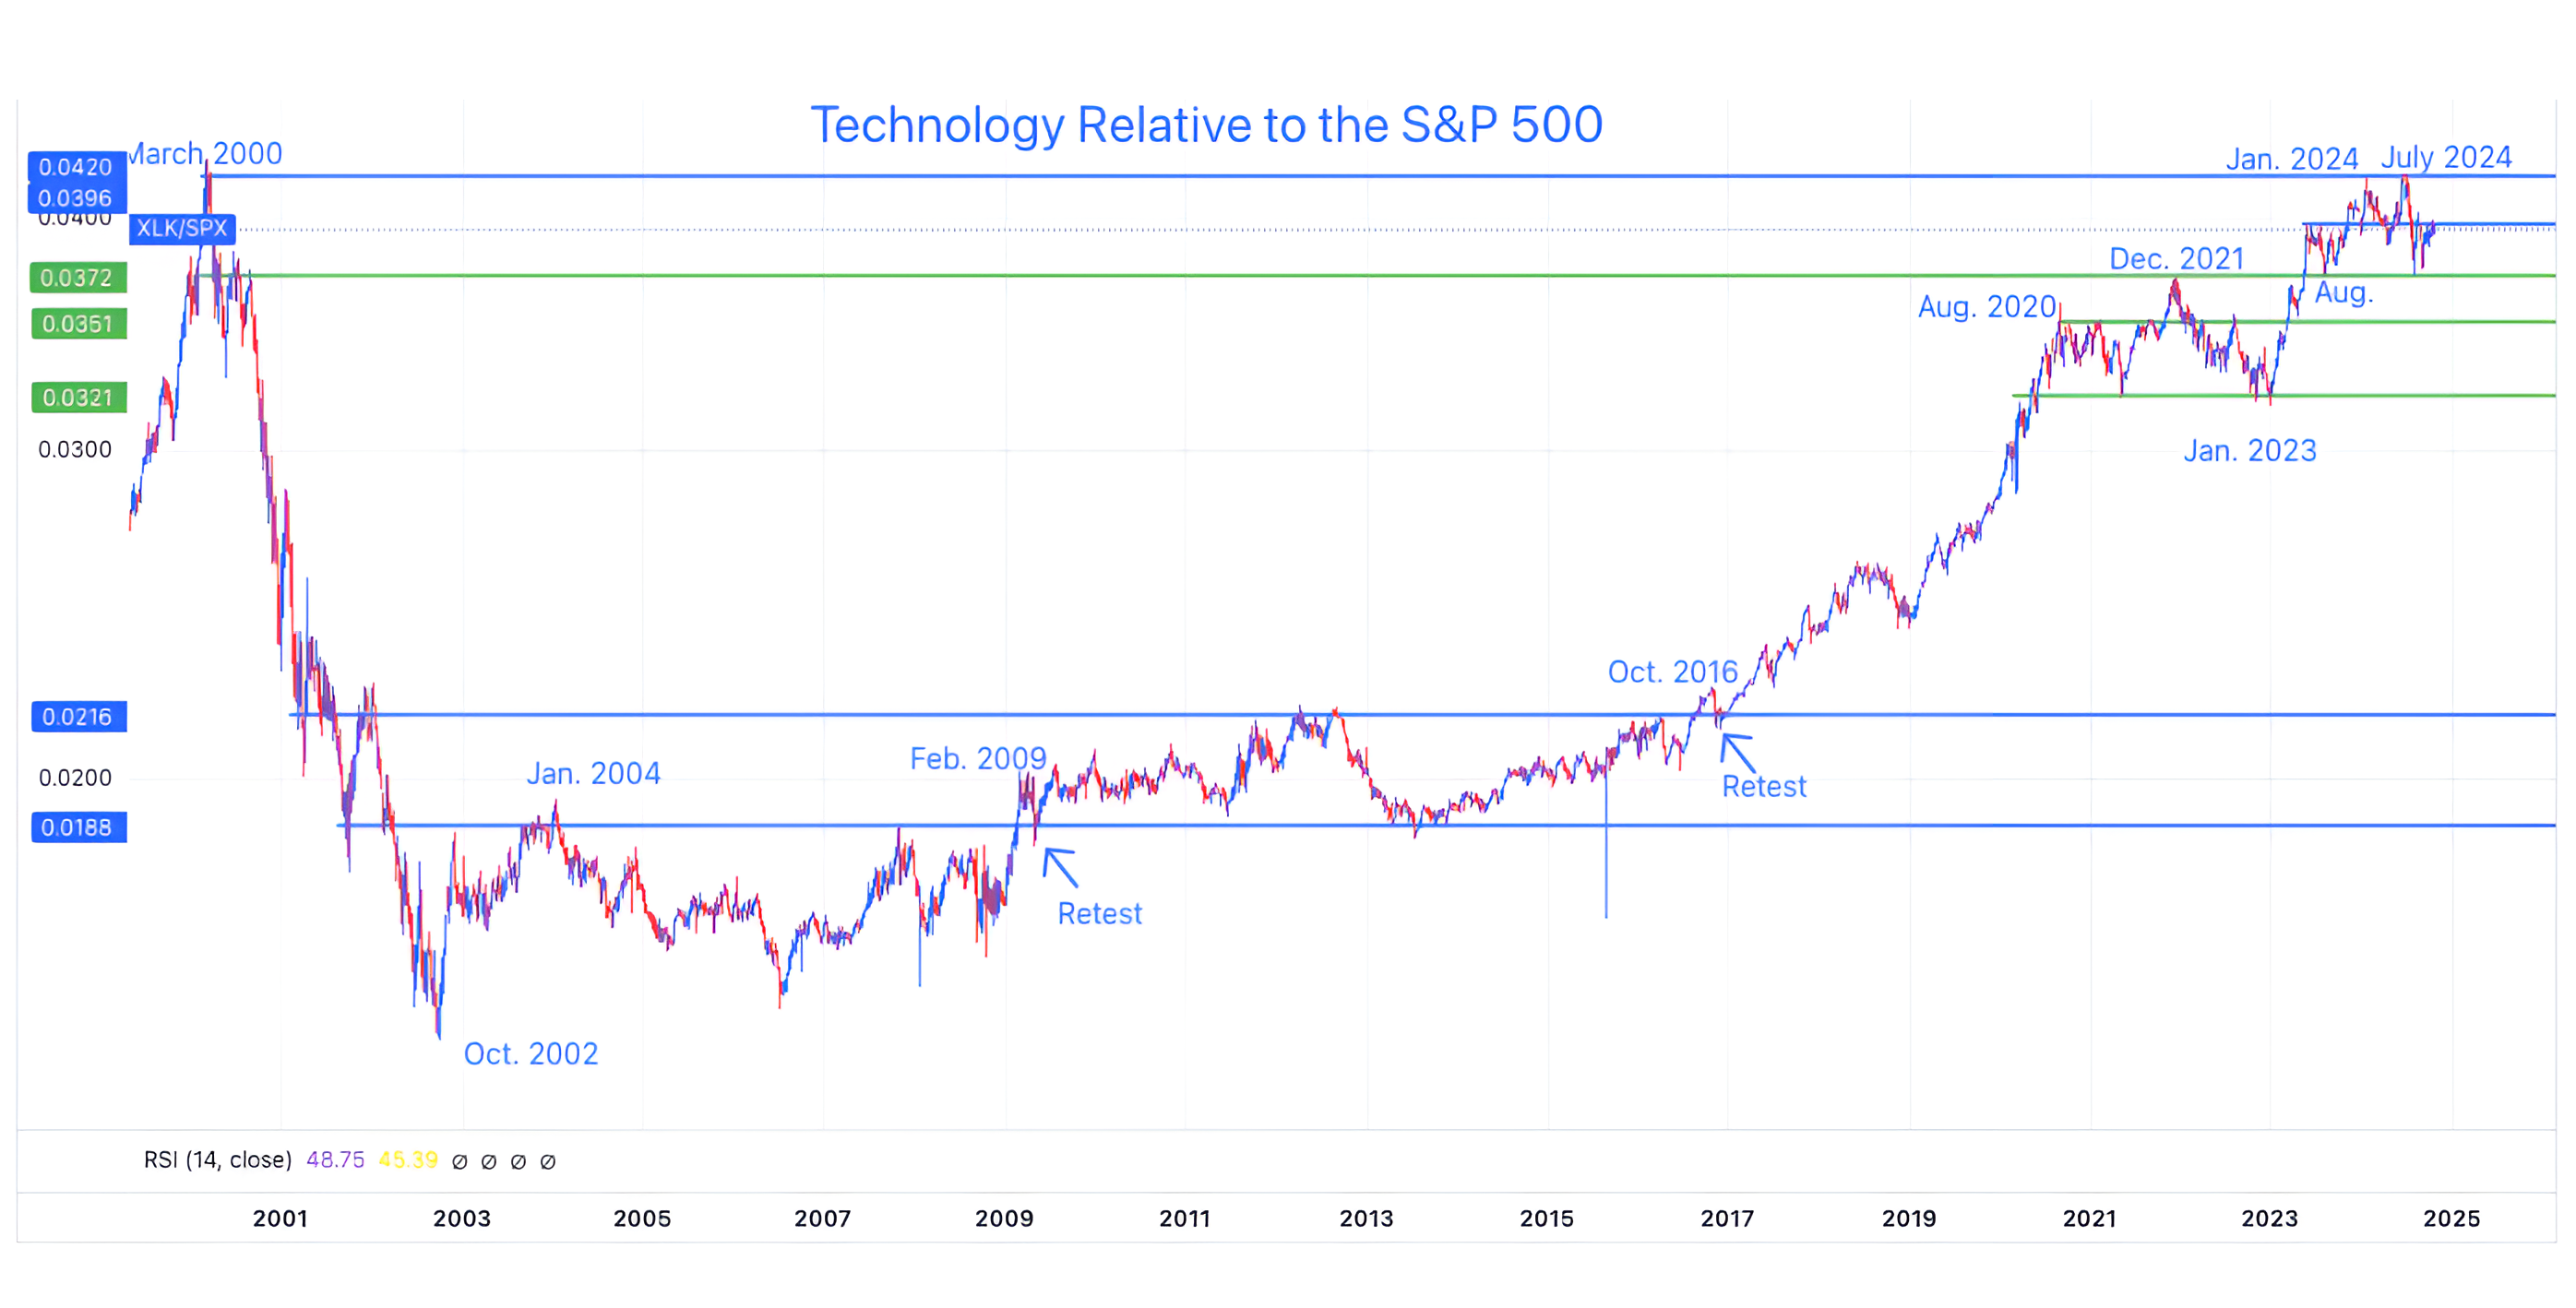
The chart above shows the Technology Sector ETF (ticker: XLK) relative to the S&P 500 since 1999.
When the chart is moving higher, the Technology sector is outperforming the overall S&P 500 and when it’s moving lower, the opposite is true.
From March 2000 to October 2002, as the dot-com bubble burst, Technology dramatically outperformed the S&P 500.
For the next seven years, until the Financial Crisis, Technology traded in line with the market. For investors that attempted to chase the 2002 to 2004 outperformance, it was a painful experience.
For the seven years post the Financial crisis - from 2009 to 2016, Technology, once again, traded in line with the market.
This type of slow, uneven recovery over a long period of time is typical after a bubble / crash - the relative chart of financials since 2009 looks worse and has not recovered at all yet.
From 2016 to December 2021, Technology outperformed.
However, in retrospect, it is clear that from 2020 to 2023, Technology was trading sideways relative to the S&P 500 and digesting its 2016 to 2021 gains.
In June 2023, Technology moved to the next rung higher relative to the S&P 500. In August, it fell back to its December 2021 peak, retested the level and bounced.
In our view, this confirmed the new range and set Technology up to revisit its March 2000 relative high.
The Technology sector has now visited its March 2000 relative high two times.
At this point, we see the scenario as binary:
if Technology falls below its December 2021 relative high, we want to be underweight / cautious; and
if Technology can move higher once again and by pass its March 2000 relative high, we want to be long.
The outcome will likely depend on whether the investment in AI begins to pay off or if investors lose patience with the extreme cap ex spending without a clear path to a return. (See charts 3 and 4, below).
Based on what we’re seeing, we favor outperformance (a break above the March 2000 relative high) to underperformance (a fall below the December 2021 relative high) 70 to 30.
(Past performance is not indicative of further results. This is not a recommendation to buy or sell any security and is not investment advice. Please do your own due diligence).
3. The Straw that Stirs the Drink…for Now
Source: Goldman Sachs. Through year to date 2024.
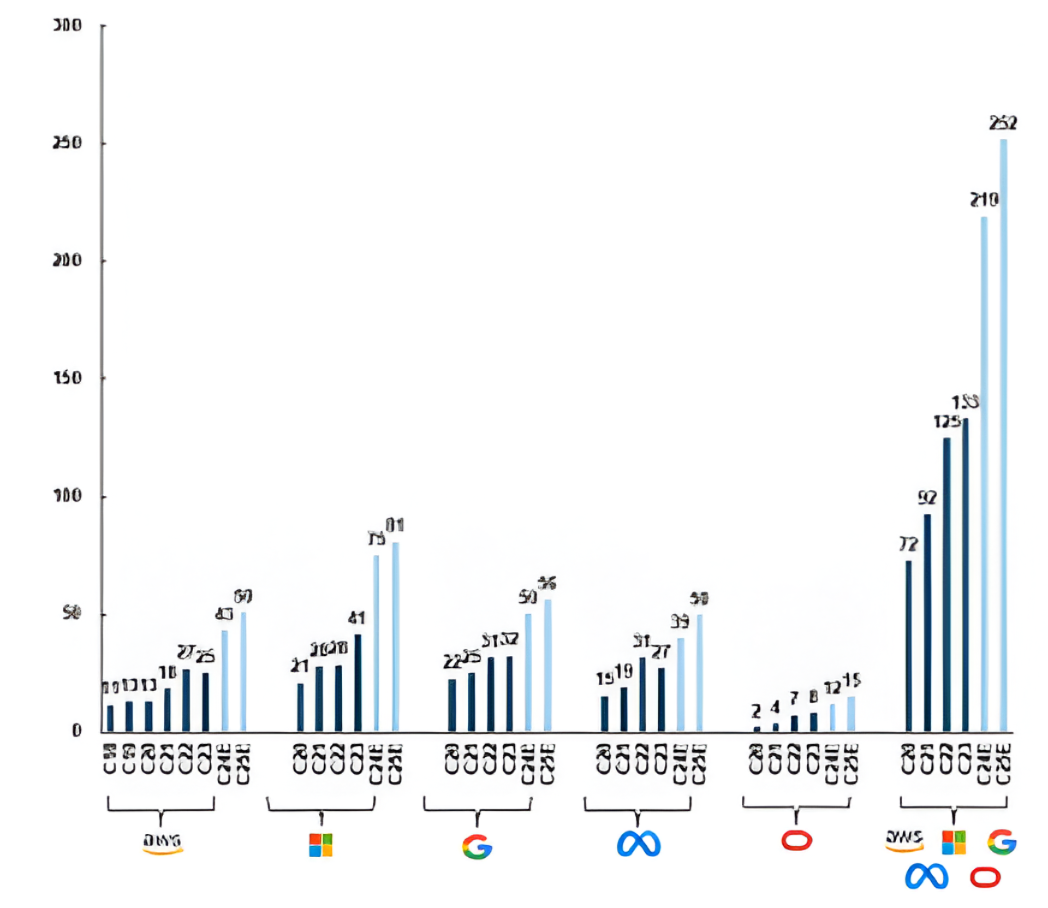
The chart above shows US hyper-scaler capital expenditures (“cap ex”) in calendar years 2020-2023 (dark blue) and Goldman Sachs estimates for 2024 and 2025.
The US hyper-scalers are from left to right: Amazon; Microsoft; Alphabet (Google); Meta (Facebook); and Oracle.
The chart essentially shows the money (in $ billions) that these five companies are dedicating to AI infrastructure.
This is an update of the hyper-scaler cap ex charts that we’ve shown in the past (chart 2 here and chart 2 here).
Hyper-scaler cap ex is set to nearly double from $133 billion in 2023 to $252 billion in 2025.
Goldman Sachs estimates that Microsoft alone will allocate $81 billion to AI cap ex in 2025. Not only is this a ridiculous significant amount, it is much more than the other hyper-scalers are spending.
To some, the AI cap ex boom seem like an arms race. However, the challenge is that it is currently an arms race without a clear destination. (If we build it, they will come).
As we have said in the past, there is no “killer app” for AI (yet). (We discuss opportunities in chart 4 below).
However, what the hyper-scalers may be betting on is owning the next significant platform.
Each current platform vertical has a dominant player: AI hardware, Nvidia; Smartphones, Apple; e-commerce and cloud, Amazon; internet, Google; social networks, Facebook; and software-as-a-service (SAAS), Microsoft. Valuations for each of these companies is in the $2-$3 trillion range.
This means that these companies are spending with the hope to be the Microsoft Windows, Amazon Cloud Services, Google search, Facebook or iOS that underlies and supports whatever “killer AI apps” that are eventually developed.
All of that said, there is a risk, and we do not have to look to far back to see it.
In 2020 and 2021, Facebook (at the time) made a large investment in the metaverse with the belief that virtual and augmented reality (VR / AR) would be the next dominant platform (after desk tops and smart phones).
After a name change and significant investment, investors began to question when and how the metaverse would become profitable and deliver a return on investment.
Facebook / Meta shares dropped and the company announced that 2023 would be the year of efficiency as the company cut expenses and reduced its investment in the metaverse.
If no “killer app” or revenue driver becomes visible, at some point, investors may lose patience (once again) with exorbitant capital expenditures and little return.
(Past performance is not indicative of future results. This is not a recommendation to buy or sell any security and is not investment advice. Please do your own due diligence).
4. AI Datacenter Value Chain

Source: Felicis. Through year-to-date 2024.
The chart above shows the participants across the AI Datacenter chain.
We have covered some of this before in charts 3 and 4 here but it warrants reiterating.
Some have called AI a revolution on par with the steam engine, automobile, telephone, electricity, desktop computing, the internet and / or mobil.
Within that context, it is important to note that the few if any of the companies that participated in those revolutions saw their stock prices move higher in a straight line.
Revolutions and super cycles are accompanied by disruption and disruption often leads to volatility.
To date, most of the value from the hyper-scaler capex spend has accrued to the semiconductor ecosystem and the data center buildout (number of US data centers is expected to double in the next four years).
Sequoia, the venture capital firm, has written a great white paper on the AI ecosystem (here) and in it they write:
“As the LLM market structure stabilizes, the next frontier is now emerging.
The AI Investment Universe
Infrastructure
This is the domain of hyperscalers. It’s being driven by game theoretic behavior, not microeconomics. Terrible place for venture capitalists to be.
Models
This is the domain of hyperscalers and financial investors. Hyperscalers are trading balance sheets for income statements, investing money that’s just going to round-trip back to their cloud businesses in the form of compute revenue. Financial investors are skewed by the “wowed by science” bias. These models are super cool and these teams are incredibly impressive. Microeconomics be damned!
Developer tools and infrastructure software
Less interesting for strategics and more interesting for venture capitalists. ~15 companies with $1Bn+ of revenue were created at this layer during the cloud transition, and we suspect the same could be true with AI.
Apps
The most interesting layer for venture capital. ~20 application layer companies with $1Bn+ in revenue were created during the cloud transition, another ~20 were created during the mobile transition, and we suspect the same will be true here.”
Because we are not limited to public or private markets, we see compelling opportunities across the AI value chain from public infrastructure companies to venture capital and venture backed software and apps.
Nearly every day, we are meeting with compelling venture capital companies that are emphasizing different AI verticals (industrial AI, clean energy AI, legal AI, etc.). The companies in which they are investing and the ideas they are sharing are truly revolutionary.
(Past performance is not indicative of future results. This is not a recommendation to buy or sell any security and is not investment advice. Please do your own due diligence).
5. The Nasdaq 100 Has Not Had Consecutive Down Days in Six Weeks, What’s Next?
Source: Sentimentrader. Through year-to-date 2024.
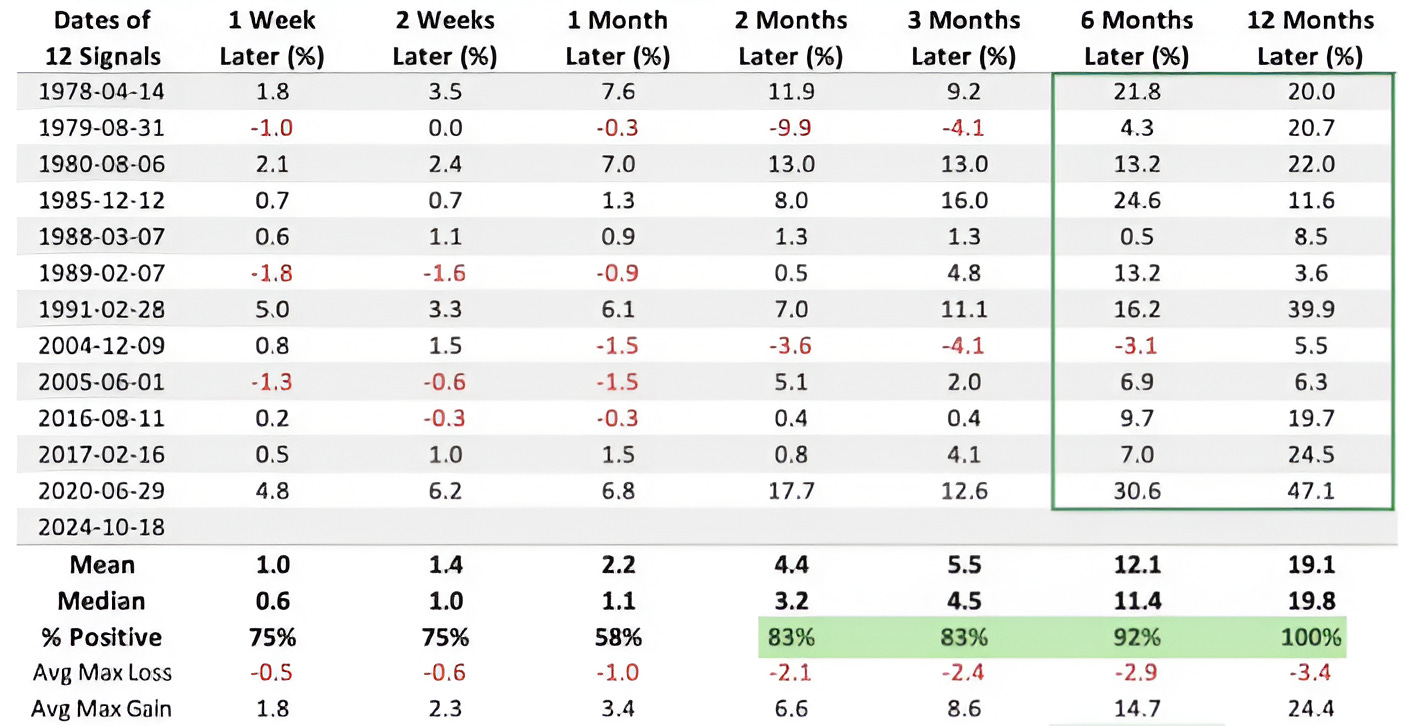
The chart above shows the instances that the Nasdaq 100 has gone 32 sessions without consecutive down days and the subsequent performance of the Index.
First, let us say that we have shown a number of analogs that have historically foreshadowed positive next 12 month returns.
Most of what we have shown has related to the S&P 500 and has had been associated with positive 12 month returns around 80% of the time.
While the table above relates to a somewhat esoteric statistic - consecutive down days over 32 sessions - and is based on the Nasdaq 100 rather than the S&P 500, in the past, it has preceded positive one year returns 100% of the time. (Past performance is not indicative of future results).
Furthermore, the mean and median 1-year returns (on the Nasdaq 100) have been 19.1% and 19.8%, respectively.
In other words, the current condition that the market has developed has consistently preceded attractive one year returns in the past.
Although it is easy to disregard these historical analogs, for many that were bullish at the end of 2022 and beginning of 2023 (and as a reminder that was a rare breed), these analogs provided a bullish narrative when the technicals looked weak, fundamentals remained questionable (negative earnings growth in the first half of 2023) and the Fed remained higher and tighter than most economists expected.
Could AI and AI spending move the Nasdaq 100 (and Technology) up 19% over the next year?
(Past performance is not indicative of future results. This is not a recommendation to buy or sell any security, please do your own research).