


Sympathy for the Devil
With Trump's joint address to congress this evening, we wanted to review some of his policies and where the economy and markets are given the transition from Biden (purgatory? worse?). Let's dig in...

One of our themes for 2025 has been the transition to a new US Presidential administration along with its different style and range of new priorities.
We initially focused on monetary policy and in mid-December, (in the introduction here) wrote:
“Our concern as we enter 2025, is that Treasury Secretary Yellen is handing her responsibilities to Scott Bessent at a complicated time with new policies, questionable US employment and a challenging macro backdrop.”
Last Thursday, we emphasized that both President Trump and Treasury Secretary Bessent have been very explicit they want the economy to wean off fiscal support in favor of non-government growth.
Over the weekend, Treasury Secretary Bessent explicitly stated:
"We're seeing the hangover from the excess spending in the Biden years. In 6 to 12 months, it becomes Trump's economy."
In our view, this was Bessent, likely with Trump’s blessing, saying that anything economic or market volatility that occurs as they implement and transition to the policies that they believe will achieve long-term growth should be attributed to the Biden administration.
What this means is that if the economy falls into a recession now or if equities collapse, President Trump and Treasury Secretary Bessent will attribute this to President Biden.
While we are not expecting a near-term recession, we do believe that at the very least the fiscal austerity measures (DOGE) and the tax increases (tariffs), will lead to slower growth. (chart 2).
Yesterday, the Institute of Supply Management (ISM) released its Manufacturing report. While the survey itself was weak (particularly new orders), in the comments section, respondents consistently mentioned tariff uncertainty as a reason for recent weakness. Simply the uncertainty over tariffs – regardless if they implemented, threatened or implemented and removed – may be an economic headwind.
Our concern has been that when the analyst community begins to integrate this uncertainty and the weak ISM Manufacturing report into their financial models, we may see earnings expectations reduced further. (chart 3).
Before this evening’s joint address to congress, I wanted to provide my thoughts on the Trump / Zelensky (I saw three spellings of his name) meeting. This is not meant to be political, but I wanted to provide my analysis as there may be potential investment implications.
First, in my view, this is all about China. I think that China is Trump’s focus.
Within that context, before the inauguration, Trump spoke of buying Greenland and called Canada the 51st state.
In my view, Trump is viewing the finite amount of global minerals and resources as an area of competition with China. China has been buying mines and rights in Africa and elsewhere for the past 10-15 years.
If this framework is correct, it explains the mineral rights agreement in Ukraine that Trump has negotiated and it may also be a motive for the tariffs on Canada.
In maintaining the view that Trump’s sees China as the main enemy of the US, his goal of establishing a friendlier relationship with Russia may be similar to what President Nixon and Secretary of State Kissinger did in 1972 by forming a relationship with China (photo below).
Secretary of State Kissinger recognized that in the early 1970s there were three great nations and by aligning either two vs. the other one, it would shift the global balance of power.
After three years of war, having lost 500,000 soldiers and depleted their conventional munitions, Russia may be seen by Trump as a limited near-term threat. However, Russia is still the only partner that could shift the balance of power away from China.
If this view is correct, it may have implications for global asset allocation, mineral companies, Chinese technology companies and defense contractors. We’ll see.
Sympathy for the Devil.
(The photo below shows President Nixon on his historic visit to China in 1972. Secretary of State Kissinger is smiling walking behind him).

1. The S&P 500: Out of the Post Election Range

Source: TradingView. Through year-to-date 2025.
The chart above shows the S&P 500 ETF (ticker: SPY) with its 200-day moving average (curved light blue line).
Despite achieving an all-time high just over two weeks ago, the S&P 500 has dropped nearly 7% and fallen out of its “post-election” range.
Whenever we see a price move above or below as level that we consider to be significant, we want to see that line “re-tested” from the other side to see if the new level or range holds.
In other words, what we are looking for now is for the S&P 500 ETF to bounce back to the 585 level (from about 580 currently) and to see how it reacts when it arrives there.
Concurrently, we we will look for other indicators - sectors, indexes or cross market relationships - to “confirm” new trends.
Even if there is a bounce higher, we continue to see upside as constrained.
Why?
Policy Uncertainty. We highlighted this with respect to tariffs in the introduction. This is not political and not a judgement on the policy. In our experience, policy uncertainty often expresses itself in equity markets through multiple compression (lower valuations).
Lower Growth. Given the revisions lower to US GDP growth (see chart 2), we believe the 13% earnings growth expected in the second half of 2025 and the 14% growth projected for 2026 will be reduced (see chart 3).
We do not yet see this as a time to buy back our equity exposure as we see limited (constrained) upside from current levels (we have 15-20% cash in portfolios). That said, we have sold some of our puts and put spreads.
We will continue to watch the market activity, policy, charts and fundamentals to refine our views.
(This is not a recommendation to buy or sell any security and is not investment advice. Past performance is not indicative of future results. Please do your own research and due diligence).
2. GDP Expectations Dropping!
Source: Atlanta Fed. Through year-to-date 2025.
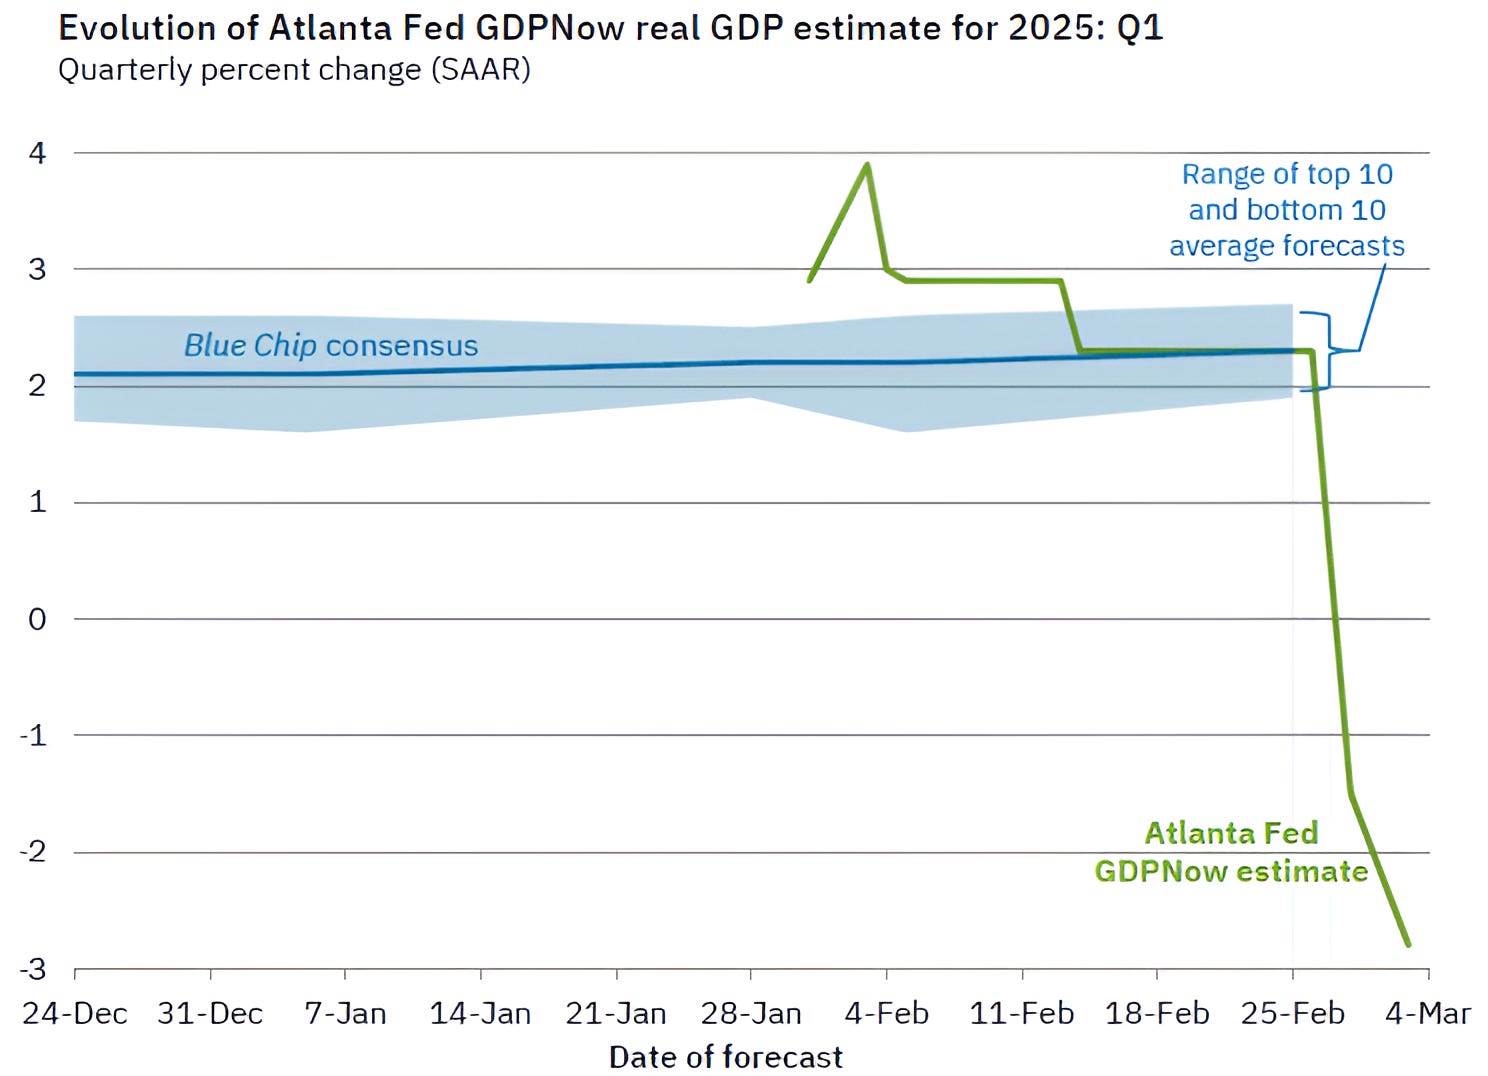
The chart above shows the Atlanta Fed’s GDP “Nowcast” (green line) and the Blue Chip Consensus GDP Forecast for Q1 2025.
A “Nowcast” is a model that integrates each series of economic or other relevant data as its released - here is a link for more information on the methodology of Atlanta Fed’s GDP Nowcast.
After yesterday’s ISM Manufacturing report, the GDP Now estimate of Q1 2025 growth is -2.8%.
For those that didn’t see it, the ISM Manufacturing report showed that new orders declined, employment declined, prices paid increased. Not great.
To be very clear - we do not expect Q1 growth to necessarily be negative. In our view, as new data is released that the GDP Now estimate of Q1 Growth will move higher.
However, this overly negative GDP Now forecast is, at the very least, likely a reflection that growth is slowing.
Furthermore, with the implementation of tariffs and the general uncertainty around policy, we believe it is possible that growth will continue to slow through 2025.
As we wrote in the introduction above and in the introduction last Thursday (here):
“Both President Trump and Treasury Secretary Bessent have been very explicit they want the economy to wean off fiscal support in favor of non-government growth.
At the very least the fiscal austerity measures (DOGE) and the tax increases (tariffs), will likely lead to slower growth.
In a more challenging scenario, the baton handoff from the government to private sector will not be smooth and will lead to economic volatility.”
In our view, this will likely lead to a reduction in S&P 500 earnings estimates (chart 3).
(Past performance is not indicative of further results. This is not a recommendation to buy or sell any security and is not investment advice. Please do your own due diligence).
3. Can 2nd Half US Earnings Remain Resilient?

Source: FactSet; Luminos Advisors. Through year-to-date 2025.
The chart above shows S&P 500 Q4 2024 - Q4 2025 estimated quarterly earnings as of December 31, 2024 and as of February 28, 2025.
First, we need to acknowledge the strength in Q4 earnings.
Was that government spending into the election, the result of Fed cuts earlier in the year or relief from the election?
While we can’t be sure of the factors that drove earnings, we can unequivocally state that Q4’s record (nearly 7% higher than Q3, which was the previous record) S&P 500 earnings were impressive in terms of surprise (as can be seen) as well as their 18% year over year growth.
However, while delivering these record results, companies guided down Q1 by 4% and Q2 by 2%.
2025 S&P 500 earnings have been revised $271 down from $274 (-1%) at the start of the year.
For the most part these revisions occured before some of the uncertainty of the Trump tariffs and DOGE began to impact corporate earnings and outlooks.
In our view, there is a risk that second half 2025 (and potentially 2026) earnings estimates which have both remained resilient will be revised lower.
Although, equity markets have been able to navigate this slow reduction in earnings expectations, any consistent negative earnings surprise may be difficult to withstand given the premium valuation. (To be fair, we’ve been concerned about this for some time).
In addition, as we highlighted when we wrote about Nvidia on Thursday (chart 3 here), if we were to extrapolate Nvidia’s lowered margins and extended credit (accounts receivables days outstanding), there is the risk of an earnings miss from one of the psychological leaders of the two and half year old bull market.
We will continue to watch for further downward revisions and the market reaction should they occur.
(Past performance is not indicative of future results. This is not a recommendation to buy or sell any security and is not investment advice. Please do your own due diligence).
4. Using Growth Shares as an Indicator

Source: TradingView. Through year-to-date 2025.
The chart above shows the Russell 1000 Growth ETF (ticker: IWF) with its 200-day moving average.
Why do we like this?
Very simply it’s has hit all of the markers we’ve been watching and the move from here will be an indicator for the broader market.
The Russell 1000 Growth ETF displayed perfect symmetry. Its 2022 sell-off range was $102, once it broke above that range, it moved higher by $102.
It is now back at its 1.618 Fibonacci extension of the 2022 sell-off.
We’ve highlighted this level across charts and, like many others, the Russell 1000 Growth ETF has not been able avoid its gravitational pull.
Finally, the Russell 1000 Growth ETF has dropped right to its 200-day moving average (which currently coincides with the 1.618 Fibonacci extension level).
We want to see the reaction of the Russell 1000 Growth ETF at the juncture of its 200-day moving average and 1.618 Fibonacci extension level.
In our view, a bounce is likely given the strong support of these two key markers.
At the very least, we would expect a battle at the 1.618 Fibonacci extension level.
And, if the Russell 1000 Growth ETF falls meaningfully below these key levels, this would be a negative for the market overall.
(Past performance is not indicative of future results. This is not a recommendation to buy or sell any security and is not investment advice. Please do your own research and due diligence).
5. Third Year of a Bull Market

Source: Strategas. Through year-to-date 2025.
The chart above shows the typical path of the S&P 500 in the first three years of a bull market.
While year 1 - October 2022 to October 2023 - of the current bull market was below average, the outperformance of year 2 made up for the lackluster initial showing.
Year 3 on average has returned 1% with a wide dispersion (+14.5% to -11.4%) of returns.
The volatile start with to the third year of the current bull market with minimal gains has been consistent with the past.
However, as can be seen, in the past the S&P 500 has taken several different paths in year 3. That being said, it is important to remember that in the current case, year 3 ends in mid-October.
(Past performance is not indicative of future results. This is not a recommendation to buy or sell any security and is not investment advice. Please do your own research and due diligence).