


You've Lost that Loving Feeling...
As we expected, the Fed re-calibrated its likely policy sending a shot across the bow of markets. We see this as foreshadowing more volatility in 2025. Let's dig in...

First, this is the 130th Charting Alpha of 2024 (650 charts!), and we will pause here for the holiday season and pick it up again in early January.
Thank you for reading.
The goal has been to provide some digestible context to market activity, thoughtful insight and the occasional variant view. Hopefully, we’ve achieved that.
Despite what is likely to be a 20%+ up year in the S&P 500, from a market, policy and political perspective, 2024 has been much more complicated than the equity market performance would indicate.
Hopefully, our explanations and thoughts have brought clarity, instigated questions and / or provoked thoughts that have led to better investment decisions.
While we don’t know if Monday represented the top in the Nasdaq 100 and the near-top in the S&P 50 for the current cycle, the concern we expressed on Tuesday (here) with the potential change in the Fed’s posture at a time with:
a) near-record high valuations;
b) investors heavily allocated to equities; and
c) a magazine cover rationalizing why the S&P 500 could achieve its third consecutive 20%+ year;
seems to have been well founded.
For those that didn’t see, the Fed delivered the expected easing, but lowered its expectations of 2025 rate cuts from four to two.
While Goldman Sachs maintained its view of three cuts in 2025, Apollo’s Torsten Slok believes there’s a 40% chance of a rate hike next year.
As a result, US equities had their biggest one-day drop on a Fed announcement day on record.
Looking to next year, we believe that the three biggest themes that we highlighted over the past year will continue to persist in 2025:
Valuation and earnings…I know I’m school and my kids would accuse me of being a fossil, but I still believe fundamentals matter. I’ve highlighted concerns about valuation (too high) and earnings (estimates too high) several times (earnings - chart 4 here; see chart 3 here; chart 3 here; here; here; here; here; chart 3 here; chart 3 here; charts 2, 3 and 4 here; chart 3 here; and chart 3 here; and valuation - see chart 3 here);
Fiscal dominance and the bond vigilantes - higher 10-Year Yields are one of the biggest risks to the equity market as we move to 2025, in the meantime the US Government needs to refinance 1/3 of its $36 trillion debt outstanding next year and Treasury investors may be becoming concerned (Chart 4 here; here; in chart 5 here; in the introduction here; chart 2 here; and chart 2 here);
Liquidity - both traditional and stealth (in our view, it’s what drives markets) (see here, here, here, here, here, here, here, chart 4 here and here).
In terms of liquidity, we have noted throughout this year the coordination between the Fed and Treasury since the early 2023 regional banking crisis and debt ceiling debate.
In the spring of 2023, Treasury Secretary Yellen began tapping non-conventional / stealth easing measures such as accessing the Treasury General Account; using reverse repo agreements; and funding the government using short-term debt to provide liquidity and stabilize the economy.
Combined with the $460 billion+ (total) of capex spending on AI in 2024 and expected in 2025 (see chart 3 here) and robust Fiscal spending, these non traditional stimulus measures, in our view, stoked equity markets higher.
Although Yellen was able to pass the liquidity baton to Fed Chair Powell in September, as we saw yesterday, that may have been short lived.
Our concern as we enter 2025, is that Treasury Secretary Yellen is handing her responsibilities to Scott Bessent at a complicated time with new policies, questionable US employment and a challenging macro backdrop.
While Scott Bessent seems to have been the best suited nominee for the Treasury secretary role, given the fragility of a market that trades at 22x next 12 month earnings, we believe there is risk should any aspect of the transition not go perfectly. (We wrote about this in the introduction here).
As we enter 2025, we have some questions:
In the absence of monetary and potentially fiscal support, can US equities maintain their historically high valuation levels?
Will the 15 year US equity outperformance over global equities (in general) continue?
If there is global growth, will oil prices move higher (see chart 4) - if so would this lead to higher inflation expectations and higher 10-Year Yields?
If 10-Year Yields continue to move higher, will the Fed once again expand its balance sheet in a quantitative easing type move? (We say yes)
In the meantime, equities seem to have “lost that loving feeling - is it gone, gone, gone?”

1. The Equal Weight S&P 500 and the 1.618 Fibonacci Extension: Ouch!

Source: TradingView. Through year-to-date 2024.
The chart above shows the Equal Weight S&P 500 (ticker: RSP).
We last showed this chart just over two weeks ago here.
At the time, we noted that the Equal Weight S&P 500 ETF had it our target at the 1.618 Fibonacci extension of the ETFs 2022 sell-off ($188) and wrote:
“Given the 16% 4-month move higher (from August 6), we would not be surprised to see a pause and possibly a 2-3% move lower as some take profits.”
Since then, the Equal Weight S&P 500 is down over 7%.
Rather than prognosticate direction, we will make three observations:
The 1.618 Fibonacci extension - as un-rigorous as it sounds - is meaningful. This has been a guide for us across indexes since mid-year.
Regardless of the near-term direction, it’s clear it will take time for the “average stock” to climb back to the $188 level and surpass it.
This chart is a reflection of weak holders of stock with little conviction and a lack of buyers. We’ve highlighted the fragility of this market - this chart shows it.
(This is not a recommendation to buy or sell any security and is not investment advice. Past performance is not indicative of future results. Please do your own research and due diligence).
2. Small Caps Have Work to Do in 2025
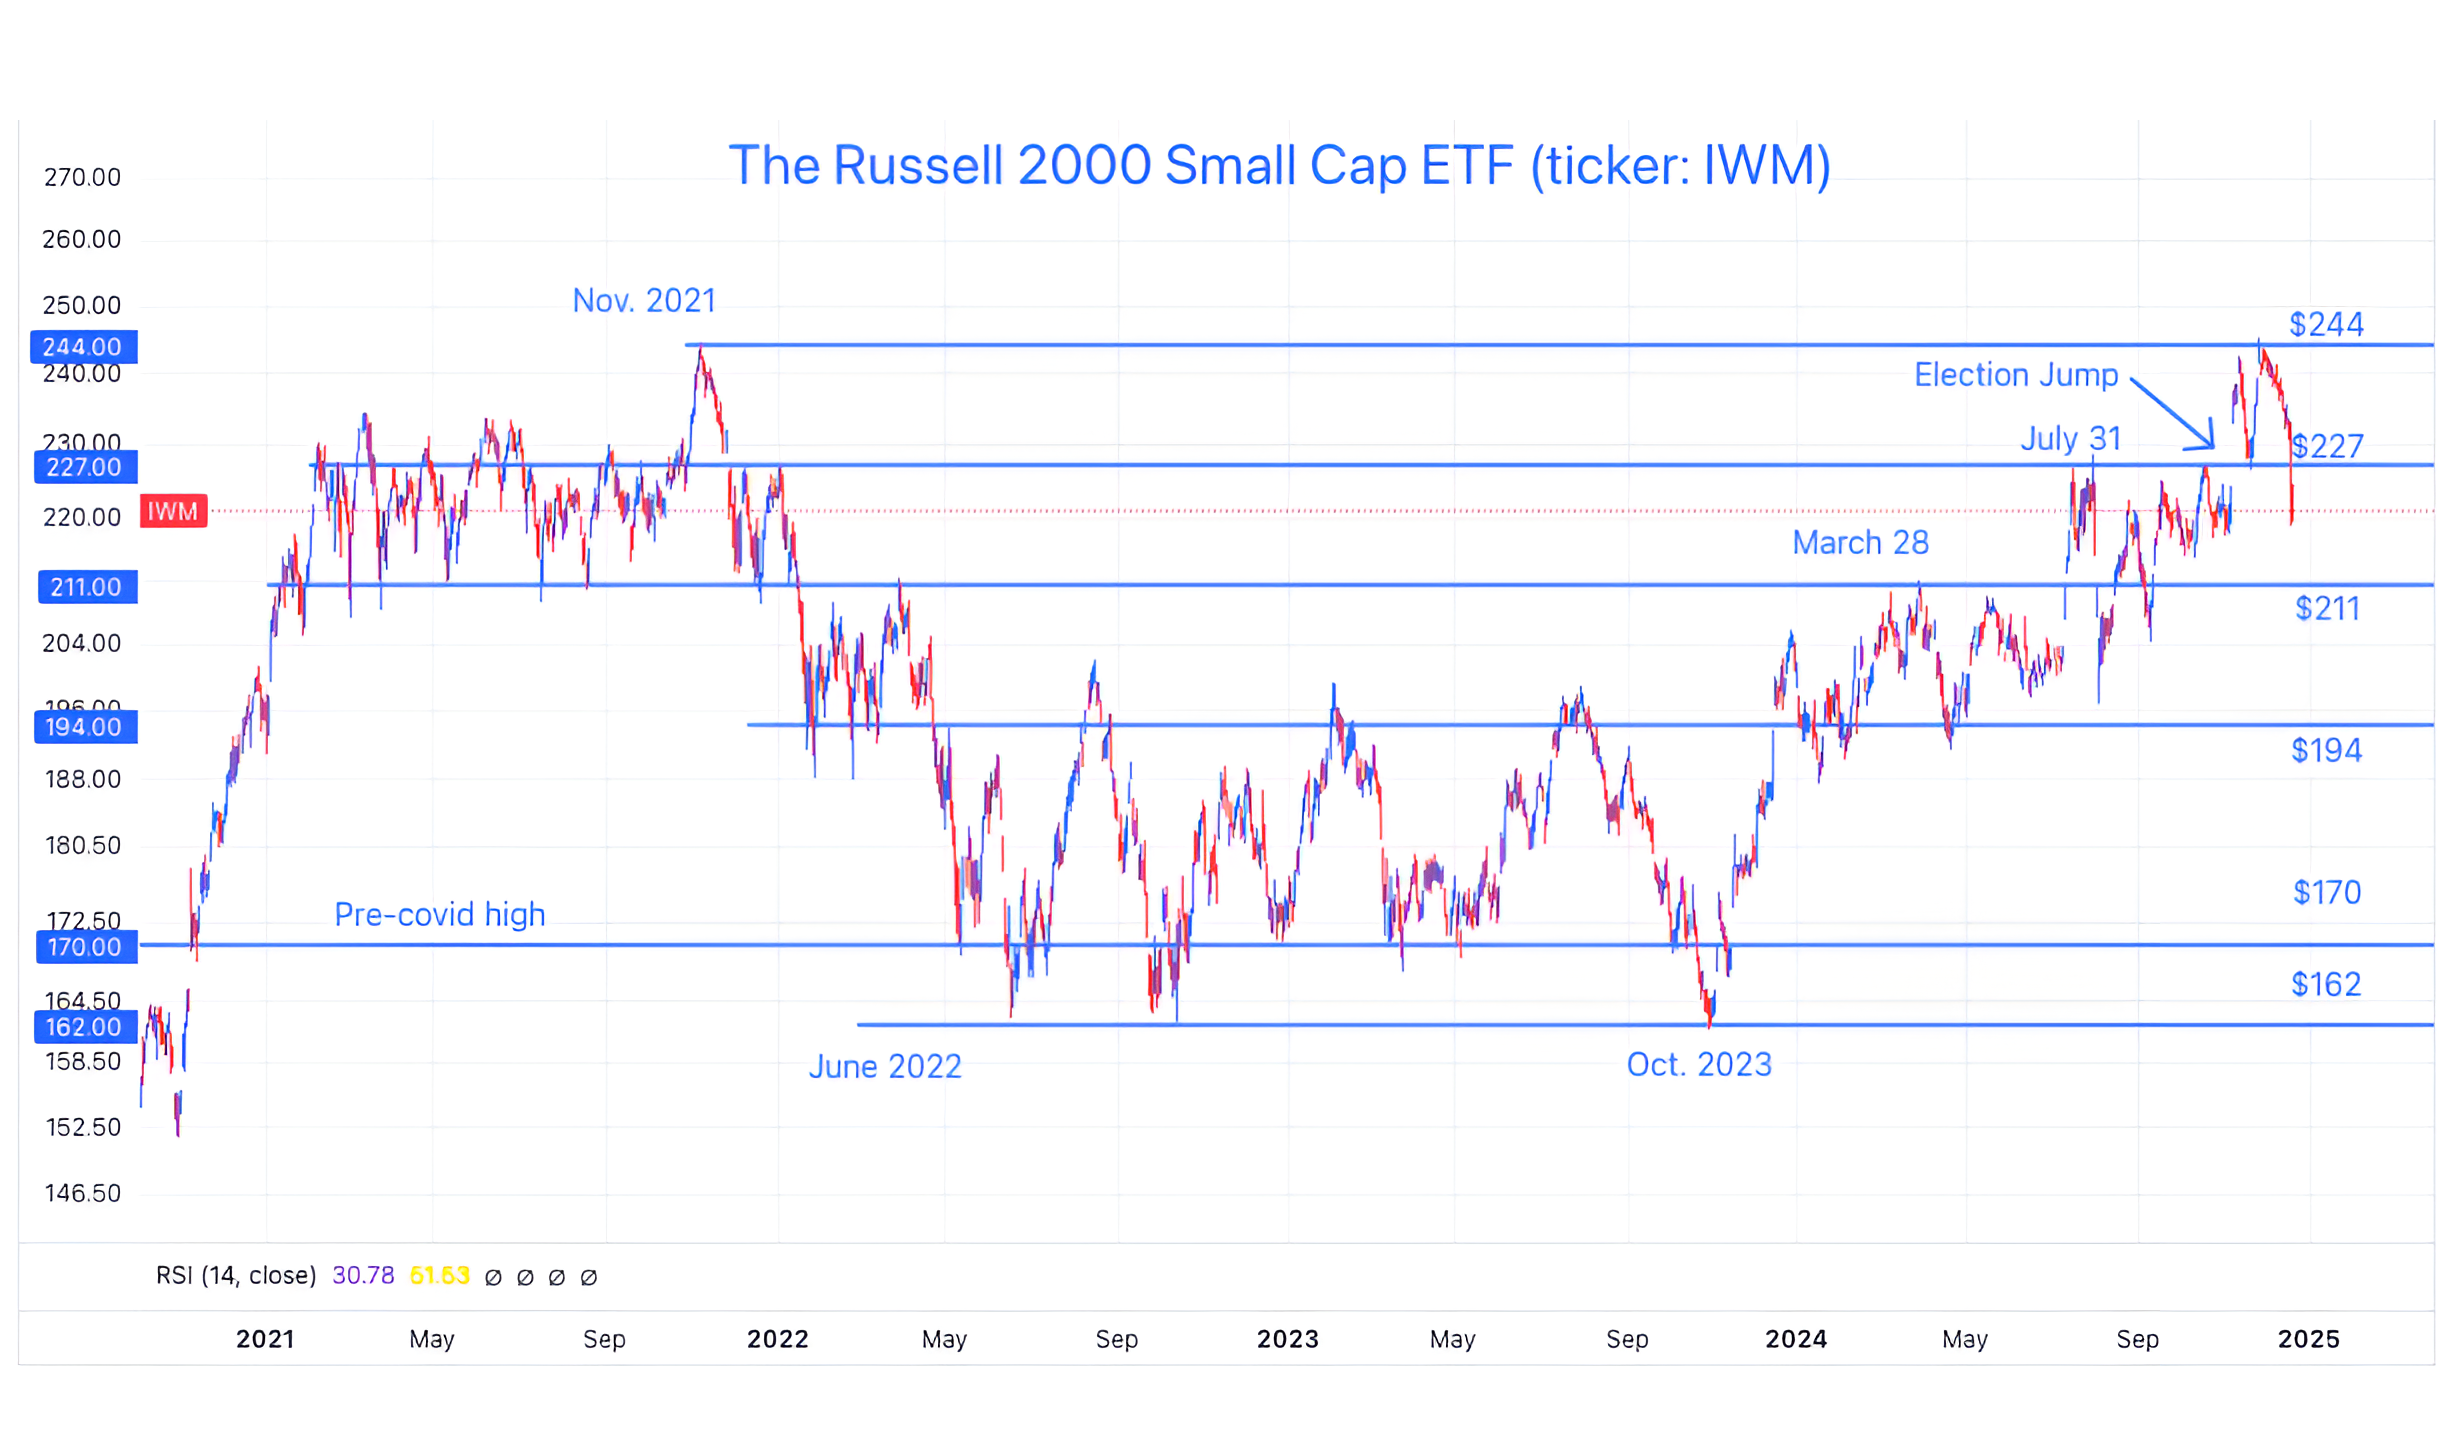
Source: TradingView. Through year-to-date 2024.
The chart above shows the Russell 2000 Small Cap ETF (ticker: IWM).
Small Caps were not able to surpass their 2021 (post-covid) high and have lost all of their post-election gains and then some.
Furthermore, Small Caps are now below their July 31 high and below the level when the Fed began cutting rates.
We always consider the Small Caps as a reflection of the health of the US economy.
While Small Caps can recover, for the time being, their performance may raise questions about the economic outlook.
(Past performance is not indicative of further results. This is not a recommendation to buy or sell any security and is not investment advice. Please do your own due diligence).
3. Keeping an Eye on US Unemployment
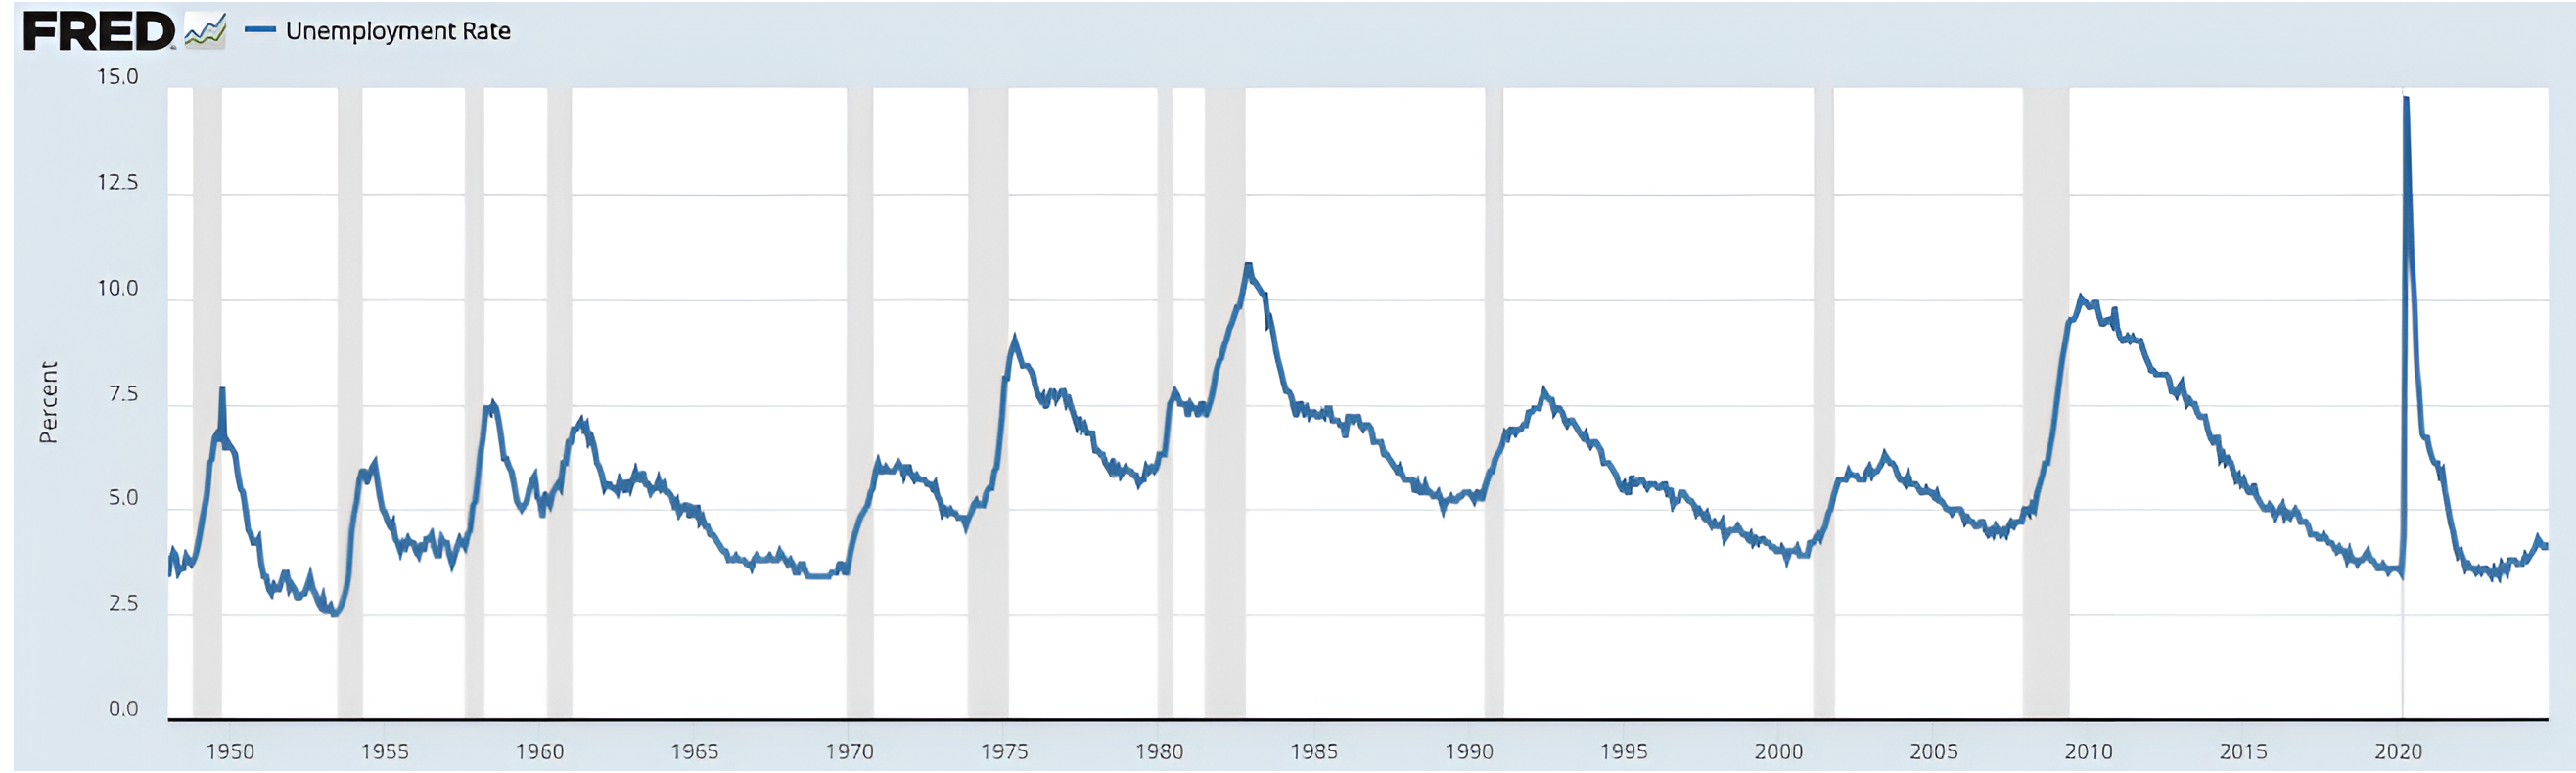
Source: St. Louis Fed, US Bureau of Labor Statistics. Through year to date 2024.
The chart above shows the US unemployment rate.
Although a US recession is not our base case for 2025, after highlighting that it was a part of BCA’s 2025 forecast (chart 3 here), we began to consider it as a possibility.
Looking closely at the chart above, it’s easy to see that increases in the unemployment rate have either preceded or were coincident with all US recessions (grey vertical areas on the chart).
Over the past 20 months (since April 2023) unemployment has been trending higher from 3.4% to 4.2%.
While a recession is not our current base case (~10-15% chance), we will continue to watch unemployment closely.
(Past performance is not indicative of future results. This is not a recommendation to buy or sell any security and is not investment advice. Please do your own due diligence).
4. Watching Oil in 2025

Source: TradingView. Through year-to-date 2024.
The chart above shows the price of West Texas Intermediate Crude Oil ($/barrel).
My first reaction to this chart is that oil has essentially sitting at $68 since early September (the time of the first Fed cut).
As we highlighted on Tuesday, 10-Year Treasury Yields are up over 1% over the same period.
Typically, because oil and inflation (CPI) are often related, we would look at this chart as an early warning sign for inflation expectations that could feed into higher 10-Year Treasury yields.
The point here is that the higher 10-Year Treasury yields are likely not being driven by higher inflation expectations.
This leaves higher growth expectations and term premium (essentially the uncertainty and risk of holding a security for its duration rather than a similar, shorter-maturity instrument) as possible reasons for higher 10-Year yields.
Given US debt outstanding and the re-financing challenge - we believe term premium is likely be the reason for higher 10-Year yields.
Pivoting back to oil, as we look at the chart, we question whether oil prices will a) hold the $68 / barrel level and b) if they do, will they move back up towards $81.
Although the President elect wants to drill, there is a growing concern with the amount of waste water that is being pulled up from underground with oil.
According to the Texas Tribune (here):
“A fracked well in West Texas can produce five times as much wastewater as oil. Every day, fleets of tanker trucks haul hundreds of millions of gallons of this toxic brine to loosely regulated disposal facilities that line the rural highways.”
Waste water and waste water disposal are a growing issue and solutions could raise the cost of production.
If oil prices rise - as we stated above - we might see inflation expectations and 10-Year Yields move higher.
We believe this is something to watch in 2025.
(Past performance is not indicative of future results. This is not a recommendation to buy or sell any security and is not investment advice. Please do your own due diligence).
5. Will US Equities Continue to Outperform?

Source: TradingView. Through year-to-date 2024.
The chart above shows the S&P 500 relative to the MSCI All Country World ex-US from 2009.
In our view, the combination of:
TARP - refinancing the banks and repairing their balance sheets at the end of the financial crisis;
Quantitative Easing; and
Cloud, Mobile Technology, Software as a Service - high growth businesses that could be funded in a low interest rate environment;
has led to the 15-year outperformance of US equities over global equities.
However, during this time, there have been four one-year plus periods of sideways performance.
During these periods there was little relative advantage to holding the S&P 500 vs. a basket of non-US equities.
Notably, there were no significant periods of US equity underperformance.
Essentially, over the past 15 years, US equities have either outperformed or have performed in-line with global equities.
With US equities near the top of their relative range, we would not be surprised to see a period of in-line performance. However, we see no current reason to emphatically sell US equities in favor of non-US.
Have a great holiday season! We will be back in 2025.
(Past performance is not indicative of future results. This is not a recommendation to buy or sell any security and is not investment advice. Please do your own research and due diligence).