


Won't You Take Me to Funky town?
Today, we review the Nasdaq 100 which is looking a little fragile and within tech, we focus on the recent struggle in Semiconductors. Finally, we provide our take on Q3 earnings. Let's dig in...

On Tuesday we wrote:
“Given the velocity of the move north, we would not be surprised to see a pause at the very least and, possibly some profit taking.
While we don’t expect a significant near-term drawdown, we are once again adding puts and put spreads to our portfolios.
From time to time, these puts and put spreads are a drag on performance, but they allow us to remain invested and sleep at night. Furthermore, when they pay off, they cover the profit drag and then some.
For those that have not fully participated in the rally, we do not see this as an optimal time to add.”
Over the past two days, US equities are looking increasingly fragile.
10-Year US Treasury Yields have moved above the 4.34% level that we highlighted as a risk here and the dollar has strengthened to October 2023 levels.
In the past, both increasing 10-Year yields and dollar strength have been associated with equity volatility. However, equities in the current period have remained resilient.
Should we see this rejection of inter-market relationships as a reflection of the current strength in equities or will these factors begin to shake the conviction in equities?
Given the unique macro-backdrop, the break-down of inter-market relationships and an equity market period that is like none other, we may already be in funky town.
We have remained invested and continue to hold our puts and put spreads.

1. Nasdaq 100: Is a “Retest” Needed?
Source: Trading View. Through year-to-date 2024.
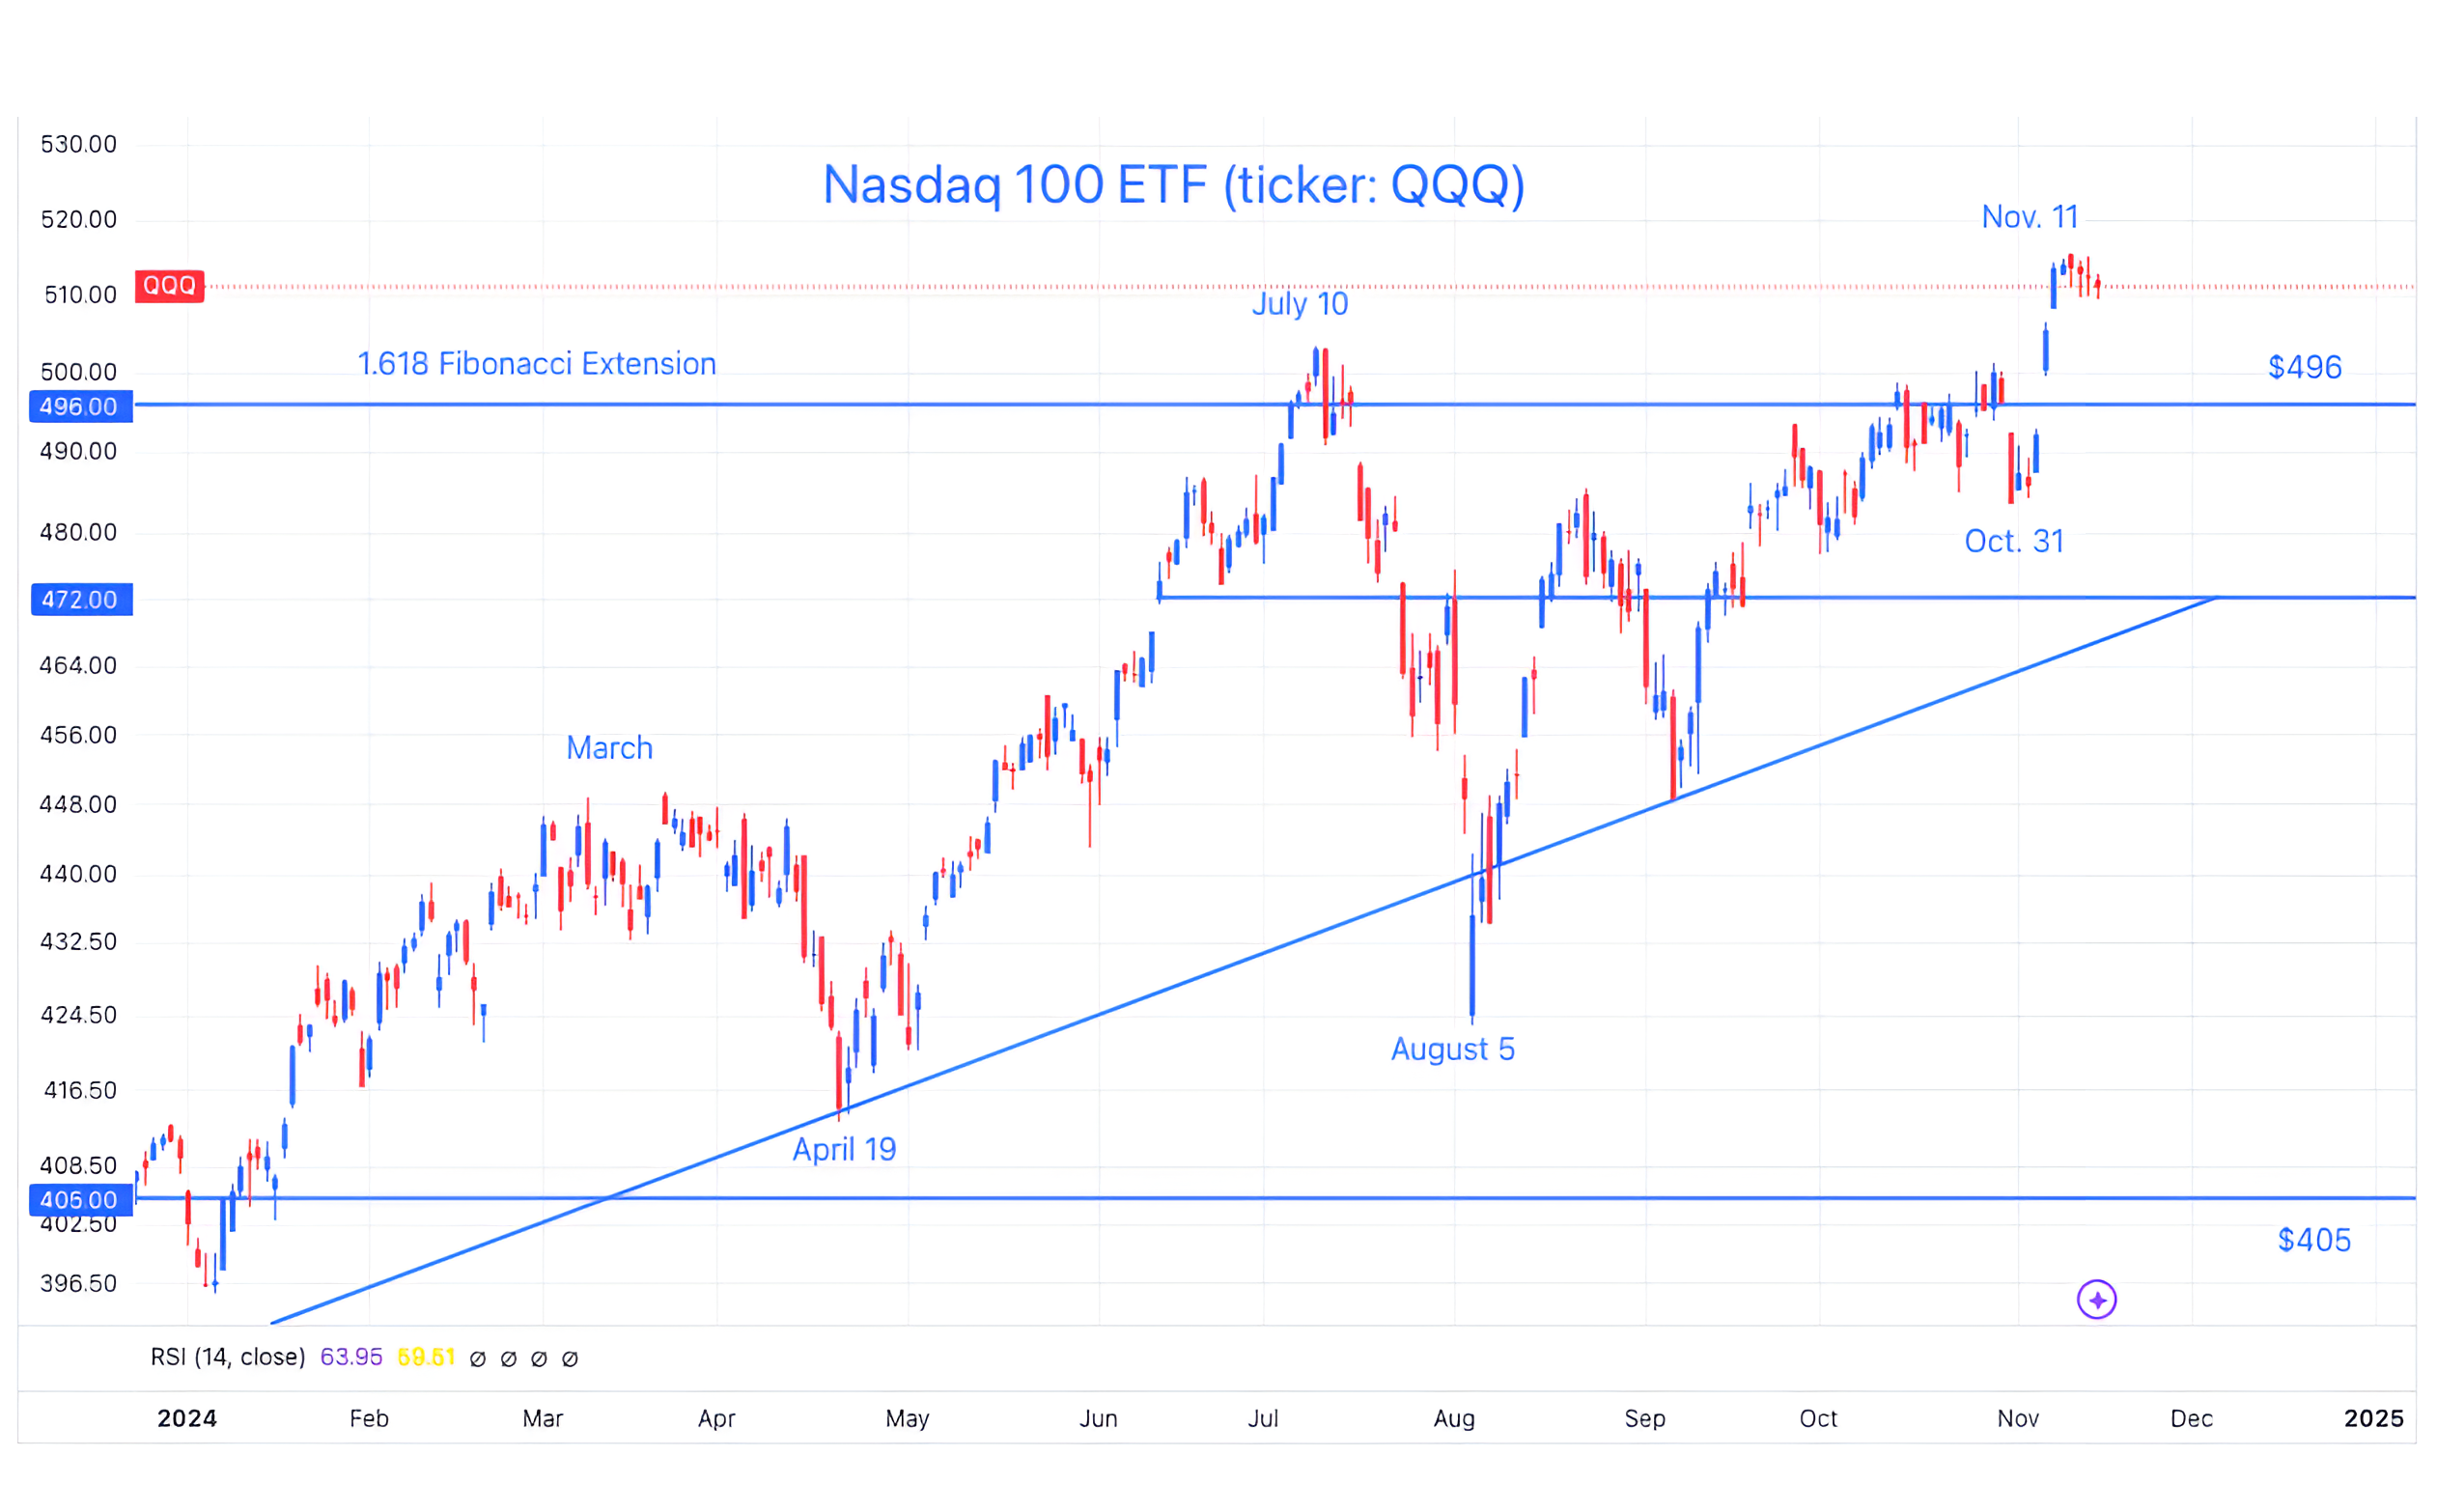
The chart above shows the Nasdaq 100 ETF (ticker: QQQ).
Over the last four months, the Nasdaq 100 ETF has been contending with the $496 level that is the Fibonacci extension of its 2022 sell-off. We initially highlighted this battle on July 1 (here).
Last week, in the aftermath of the election, the Nasdaq 100 ETF finally moved above the $496 level (we captured this in the appropriately titled “Break on Through to Other Side” here).
However, we often write about moving through key levels (either ceilings or floors) with “conviction”.
The market often tests “conviction” or shareholders “confidence” in the new range by “re-testing” the key level from the other side.
Essentially, once through the key level, price often revisits.
The reaction - either bounce or collapse - is an indication of shareholders comfort with the new neighborhood.
In early July, the Nasdaq 100 moved above $496 - the key level we identified - and when it moved back down to revisit from the north, it collapsed. It dropped 15% and clearly failed the re-test.
The Nasdaq 100 once again finds itself north of 496th street, and after the 7-trading day 6% move, another re-test may be in order.
We will be watching.
(This is not a recommendation to buy or sell any security and is not investment advice. Past performance is not indicative of future results. Please do your own research and due diligence).
2. What’s Eating Semiconductors?

Source: Trading View. Through year-to-date 2024.
The chart above shows the Semiconductor ETF (ticker: SMH).
We previously looked at the Semiconductor ETF in chart 2 here.
After its 220% increase from October 2022 to June 2024, the Semiconductor ETF has given back a little of its gain and has recently been underperforming the overall market and more specifically Software.
We wrote about the relative performance of Semiconductors (hardware) over Software in the introduction and chart 2 here.
(We also showed the Software ETF here and we showed the Cloud Computing ETF here).
The question at this point is: are the Semiconductors simply pausing after a big move higher or is their something more fundamental at work.
From a fundamental perspective,
Within this context, in our view, there have been five fundamental factors behind recent Semiconductor underperformance / Software outperformance:
There have been a series of reports arguing that improvements in AI and large language models (“LLMs”) are slowing (here, here, and here). If the gains in AI are slowing, then the expected disruption of software becomes less likely. (We highlighted the CEO of the fintech Klarna talking about replacing 3rd party software with less expensive AI created systems in chart 2 here). In other words, recent Software outperformance could be characterized as a “not as bad as feared” relief rally.
There has also recently been enthusiasm around software companies developing agent-related revenue acceleration. We have argued that AI has primarily been a cost savor rather than a revenue generator. During Q3 earnings, we saw some AI revenues coming from companies like Palantir that have created the layer above AI. (We highlighted this likely evolution in chart 2 here.)
Given the compression in Software valuation (remember the 24x next years revenue valuations in 2020/2021?), there is now the potential for M&A and Consolidation within the sector.
There is also this paper (here) that argues that more data for LLM training becomes detrimental to model performance. In essence, increases in quantization (from fp8 -> fp4 in the case of Hopper to the new Blackwell) make AI worse.
Finally, there are the challenges in SMCI which has lost its auditor, likely wont be able to file quarterly results and risks being delisted. As a reminder, SMCI was a Q1 stock darling that was added to the S&P 500 in March SMCI and is Nvidia’s third largest client.
In other words, there has been a perfect storm in the face of Semiconductors and there have been a number of reasons for tech-dedicated investors to rotate to Software.
From a chart perspective, Semiconductors (after a significant run) hit the 2.618 Fibonacci extension from their December 2021 to October 2022 sell-off and have fallen.
We would call this normal behavior.
We could see the Semiconductors revisit / retest the 1.618 level (particularly if there is bad news with SMCI) as they did in early August. This would be a 15% drop and would like lead to volatility around the broad indexes (the S&P 500 and Nasdaq 100).
That said, the ability of the Semiconductor Index to hit its 2.618 Fibonacci extension may be a foreshadowing of where the S&P 500 and Nasdaq 100 may eventually be heading if they can remain above their respective 1.618 extension levels.
(Past performance is not indicative of further results. This is not a recommendation to buy or sell any security and is not investment advice. Please do your own due diligence).
3. As Closer Look at the “Better than Expected” Q3 Earnings Season
Source: FactSet and Luminos Capital. Through year to date 2024.
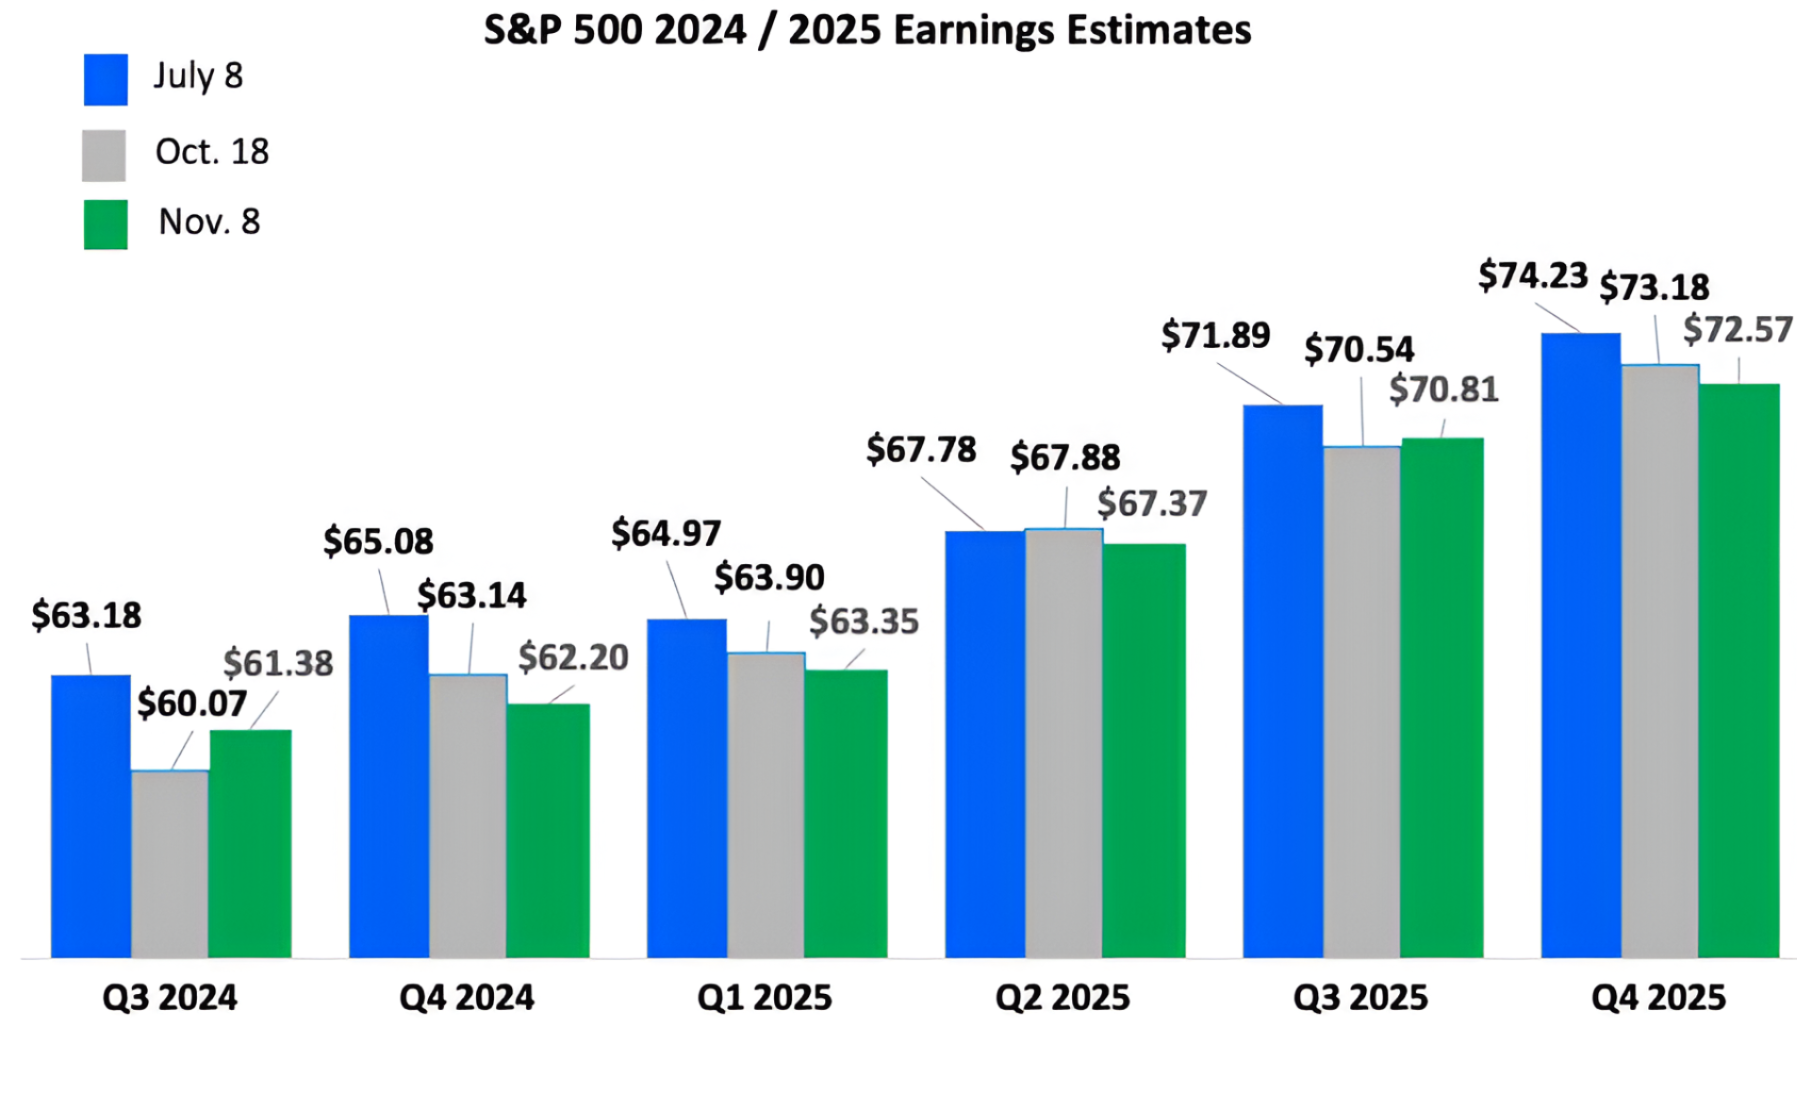
The chart above shows the estimated quarterly S&P 500 earnings as of the beginning of Q3 (July 8th); the beginning of earnings season (October 18th) and with 90% of S&P 500 companies having reported Q3 earnings (November 8th).
Looking at Q3 2024 earnings, we can see that from the beginning of the quarter (July 8) to the beginning of earnings season (October 18), estimates were reduced by nearly 5%.
During earnings season, companies exceeded the reduced forecasts.
Have earnings been better than expected? Officially, yes, but everyone can make their own judgement.
What may be more interesting is the reduction of future earnings expectations.
Despite the “better than expected” Q3 earnings, estimates for four of the next five quarters have come down.
As a reminder, if price remains steady (it has moved higher, but this is hypothetical) and earnings are going down, valuation (price/earnings) should naturally increase.
However, because the calendar has moved forward one quarter, we are now using Q3 2025 earnings ($70.81) to calculate expected earnings rather than Q3 2024 earnings ($61.38).
As a result, despite the $5.99 aggregate drop in earnings estimates for the next four quarters since July 8, the earnings figure in the denominator of the S&P 500 PE calculation has actually increased.
In this case, if price had remained steady, PE would have decreased simply because the calendar moved forward and estimates for earnings growth for the next four quarters is 12.7%.
We have highlighted our concerns with the 2025 earnings growth expectations for some time (see chart 3 here; here; here; here; here; chart 3 here; chart 3 here; charts 2, 3 and 4 here; chart 3 here; and chart 3 here).
We will see if at some point this matters.
(Past performance is not indicative of future results. This is not a recommendation to buy or sell any security and is not investment advice. Please do your own due diligence).
4. Could This be a Reason that Fundamentals Haven’t Mattered?

Source: Bank of America. Through year-to-date 2024.
The chart above shows US Equity Supply which is a combination of stock compensation + IPOs + other issuance minus Stock Buybacks.
Supply and demand is one of the economic theories in which I believe (the other is the law of unintended consequences).
As there has been negative equity supply for the past three years that has been met with increasing demand (due to fiscal stimulus and stealth liquidity), price has moved higher.
If equity issuance comes back next year or if share buybacks slow (due to higher borrowing costs or general uncertainty) - this may lead to volatility.
If, on the other hand, companies can continue to constrain the public float, the S&P 500 could continue to trend higher despite elevated valuation.
(Past performance is not indicative of future results. This is not a recommendation to buy or sell any security and is not investment advice. Please do your own due diligence).
5. European Equity Underperformance
Source: Bloomberg. Through year-to-date 2024.
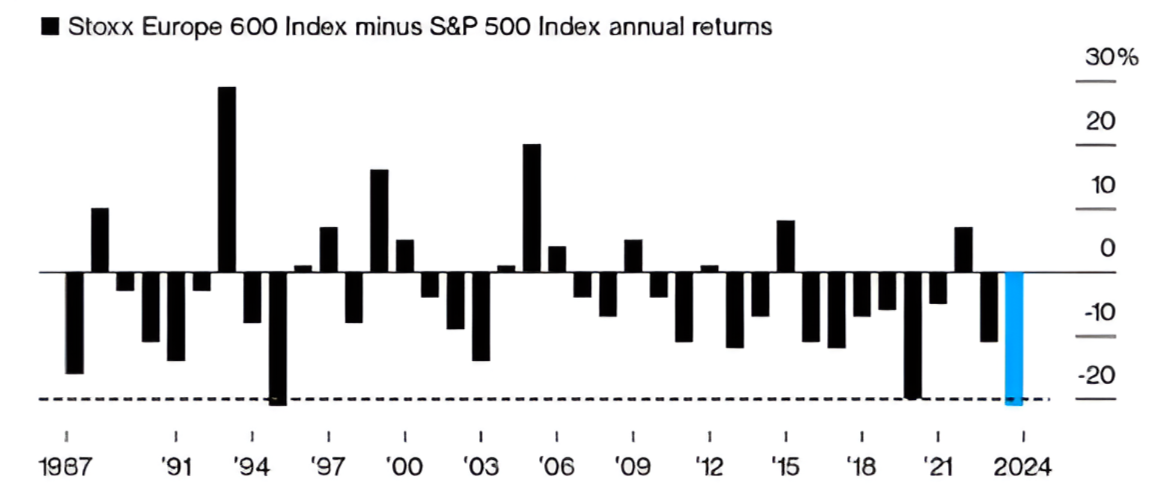
The chart above shows the annual returns of the Stoxx Europe 600 Index minus the annual returns of the S&P 500. (We recently looked at European equities in chart 5 here.)
The S&P 500 has outperformed the Stoxx Europe 600 Index by over 20% this year.
Over the last 20 years, The S&P 500 has outperformed the Stoxx Europe 600 Index by over 335% (7.6% per year compounding).
When I entered this business, 25 years ago, the ideas of global equity market diversification and asset allocation were gaining traction. Those ideas have come at a huge opportunity cost to those that have followed them.
For at least the last 10 years, I have received research reports from European banks saying that the valuation differential between US and European equities has hit an extreme and, therefore, it was time to buy European equities. Wrong.
These “theoretical” narratives that have cost money in the real world are why I have complemented my background in fundamentals with charts.
It is why we have remained invested this year and hedged with puts and put spreads rather than selling despite our discomfort with elevated valuation, mixed fundamentals and a questionable macro-backdrop.
It is why I don’t believe in models to solve the market.
At some point European equities will outperform or they wont. We will see it in the charts.
There are no rewards in this business for being theoretically right and practically wrong.
(Past performance is not indicative of future results. This is not a recommendation to buy or sell any security, please do your own research).