


Just Give Me a Reason
With the S&P 500 and technicals saying one thing and the Nasdaq 100 and fundamentals saying something else, will earnings season provide some clarity? Let's dig in...
A consistent theme of ours has been the counter-intuitive nature of the questionable fundamental and macro backdrop juxtaposed with the persistent strength in US equities. (See here and here).
With US Q3 earnings season beginning tomorrow, perhaps there will be clarity in terms of either constructive earnings and outlooks or a market reaction to disappointment.
As we have highlighted (see chart 2 here) analysts have consistently lowered earnings expectations for Q3 and they seem easily achievable.However, in our view, earnings growth projections of 14% in Q4 and 14% on average in 2025 remain too high. (See earnings in chart 2 here and here).
With valuation in the top decile of the past 25 years, we will be looking to see if its vulnerable to any further earnings re-rating.
As we highlighted on Tuesday (here), the S&P 500 is continuing to make new highs. It is not alone - the Industrials, Financials and Software (chart 2) below are all at or flirting with new all-time highs.
This broad based technical strength is bullish.
The Nasdaq 100 - as we highlight in the first chart below - has been the laggard.
We will watch to see if the broad cyclical strength can raise the Nasdaq 100 or if the Nasdaq 100 is foreshadowing challenges in the cyclical sectors.
In our view, the counter-intuitive character of the current US equity environment is explained by liquidity - both traditional and stealth (see here, here, here, here, here, here, here, chart 4 here and here). In addition, massive fiscal spending has likely also helped.
While we will evaluation earnings season, as Stanley Druckenmiller said:
“Earnings don’t move the overall market; it’s the Federal Reserve Board… focus on the central banks and focus on the movement of liquidity… most people in the market are looking for earnings and conventional measures. It’s liquidity that moves markets.”

1. Can the Nasdaq 100 Join the Party?

Source: Trading View. Through year-to-date 2024.
The chart above shows the Nasdaq 100 ETF (ticker: QQQ).
As we showed on Tuesday (here), the S&P 500 has surpassed its July high and is trading at or near all-time highs.
However, as can be seen in the chart above, the Nasdaq 100 remains 2% below its July all-time high at approximately the same level as its late-September peak.
The question we have continued to pose is: will the Nasdaq 100 fall from these levels and drag the S&P 500 down with it or will the strength in the S&P 500 carry-over to the Nasdaq 100?
While we acknowledged liquidity in the introduction, we continue to believe that, at least in the near-term, the answer to our question will at least partially depend on earnings.
With earnings season beginning tomorrow, Q3 earnings growth is currently estimated to be 2.9% - down from 7.8% growth at the beginning of the quarter. We don’t view this as very demanding and expect companies to surpass current estimates.
However, what we consider to be more important than companies results from the last three months will be how management teams characterize the current quarter.
Currently, analysts are expecting 14% Q4 S&P 500 earnings growth down from 17% in mid-July.
For some time, we have questioned earnings expectations for Q4 and the first half of 2025.
In early June (here), we wrote, “When we look at … Q4 2024, Q1 and Q2 2025 - we really begin to question the ability of companies to meet current expectations.”
Thus far, the guide down in earnings has not impacted the ability of the market to move higher as liquidity has off-set the disappointing news. We will see if that changes.
(This is not a recommendation to buy or sell any security and is not investment advice. Past performance is not indicative of future results. Please do your own research and due diligence).
2. Software Says the Nasdaq 100 is Going to a New High

Source: Trading View. Through year-to-date 2024.
The chart above shows the iShares Software ETF (ticker: IGV).
The software ETF includes some of the largest US software companies such as Microsoft (9%); Oracle (9%); Adobe (8%); Intuit (7%); Salesforce (7%); and ServiceNow (5%).
As can be seen, after revisiting its November 2021 high in February and again in July, this week, the Software ETF was able to move to a new all-time high.
Frequent readers know that I always like to watch the sustainability, durability and strength of any move above an important level. Typically, we look for a re-test of that level.
While we are watching for that, we find it interesting that the move higher in Software has occurred at a time when Semiconductors seem stuck at their August and September high, which is still nearly 10% below their July high.
In other words, Software is moving to a new high while Semiconductors seem stuck at a level below their all-time high.
Similar to dynamic between the S&P 500 and the Nasdaq 100, we want to see if the strength in Software can help lift the Semiconductors and the rest of the Nasdaq 100 or if Semiconductors and the Nasdaq 100 overall drag down Software.
(Past performance is not indicative of further results. This is not a recommendation to buy or sell any security and is not investment advice. Please do your own due diligence).
3. Maybe Our 2025 Earnings Outlook is Too Pessimistic
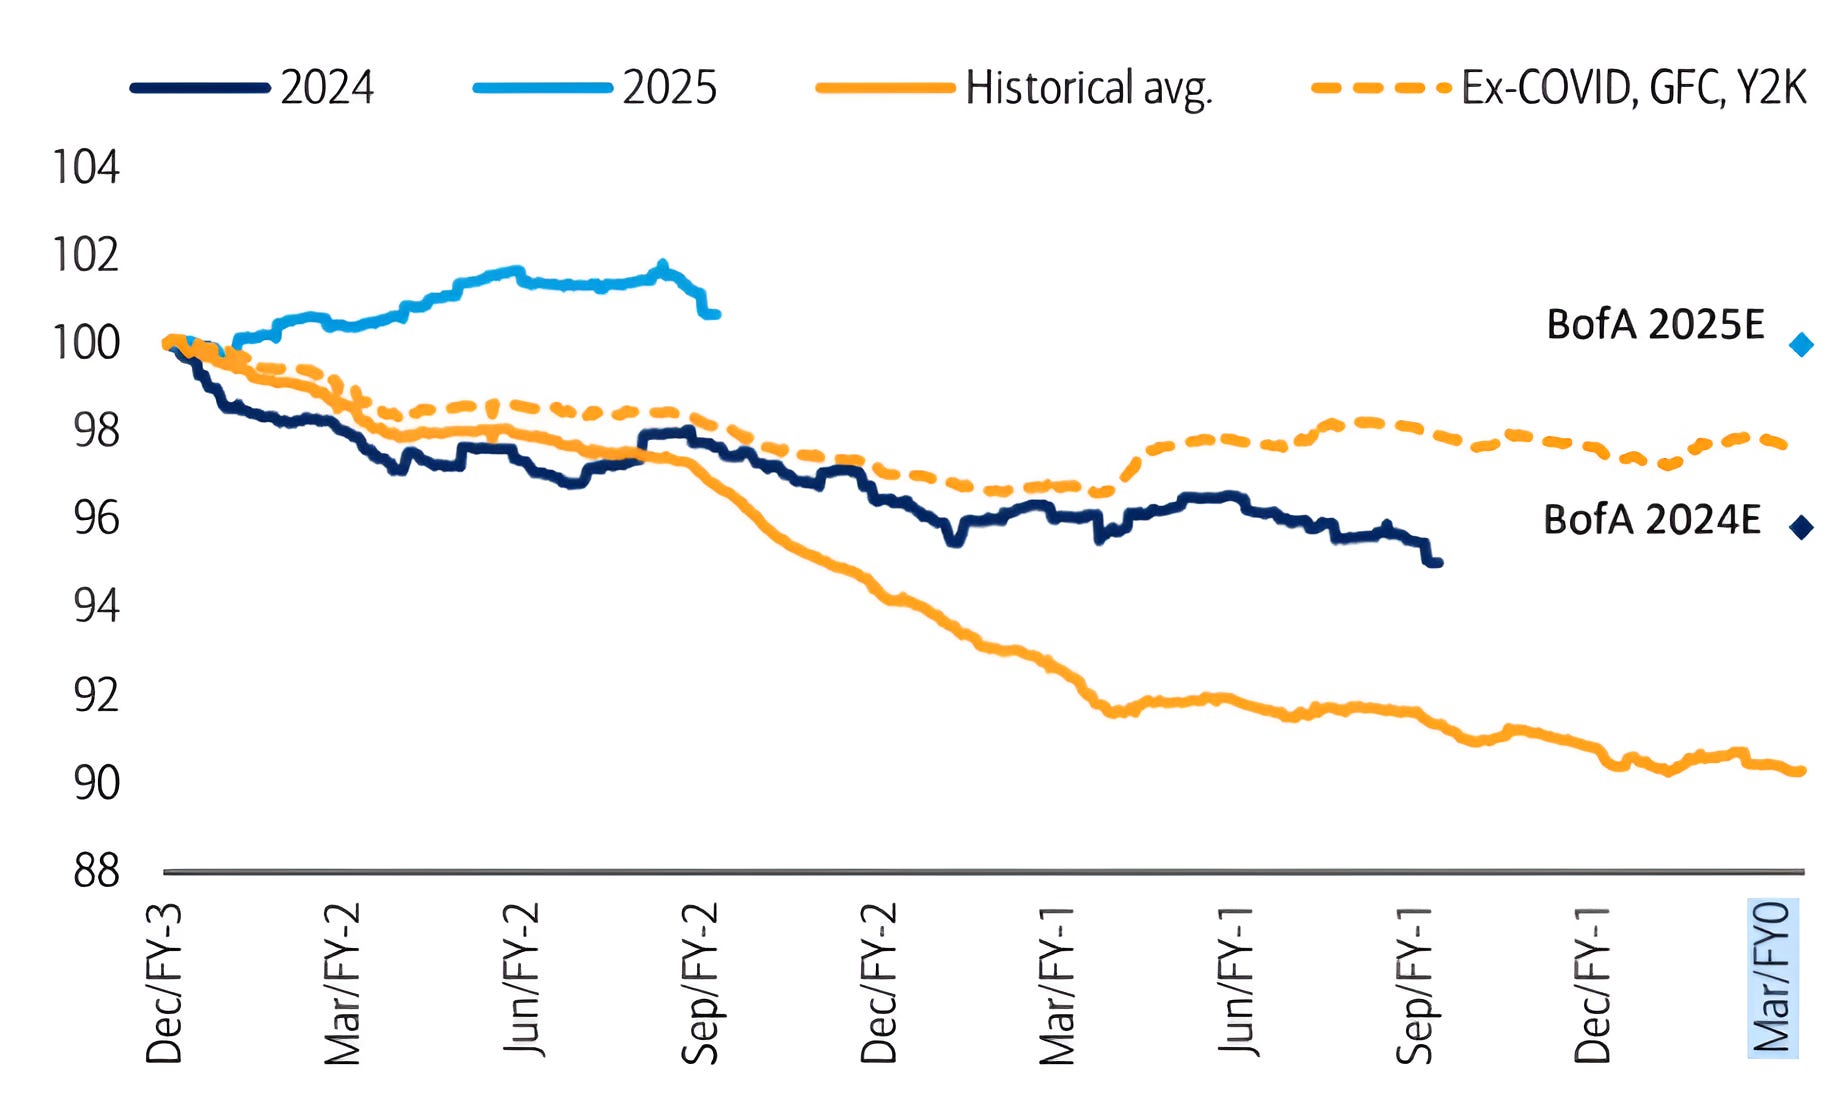
Source: Bank of America. Through June 2024.
The chart above shows the path of S&P 500 earnings estimates from 2001 through 2025.
Historically, analysts - at the encouragement of management teams - make overly optimistic projections and then revise those projections lower as reality unfolds.
Outside of the dot-com bust (Y2K); the Financial Crisis (the GFC); and covid, earnings estimates, which typically begin to be projected two years prior to a quarter, have, according to Bank of America, on average been revised lower by about 2% (yellow dashed line).
Simply looking at Q1 2024, which was by all means a solid quarter, when analysts began forecasting earnings for the period in January 2023, the expectation was for earnings of $59.09. That was the peak of expectations as air, slowly leaked out of the balloon.
By the time the quarter was reported, S&P 500 earnings were $56.49 - a drop of 4.4%.
This is roughly in line with Bank of America’s view of 2024 expected earnings (dark blue line).
Where we believe we may have a different opinion than that of Bank of America is for 2025 earnings expectations.
Bank of America is expecting very little downward revision to 2025 S&P 500 earnings expectations (light blue line and light blue diamond).
Our view has been that analysts are expecting over 14% earnings growth in 2025. This is the type of earnings growth that has generally only happened in a post-recession recovery or with the Trump corporate tax cut.
While there has been stimulus - from the Fed, China and elsewhere, we continue to have a hard time understanding the strength in earnings growth expectations.
If Bank of America is right, it may justify the current valuation of the S&P 500; whereas if our concerns are warranted, there may be a reconciliation of price and valuation to adjust to the new reality.
There may also be a third resolution. As we have been positing, encouraged by the easing cycle, investors may simply look past 2025 earnings disappointment to 2026 earnings to justify S&P 500 levels.
(Past performance is not indicative of future results. This is not a recommendation to buy or sell any security and is not investment advice. Please do your own due diligence).
4. Does History Rhyme or Repeat? We’ll Find Out Soon.
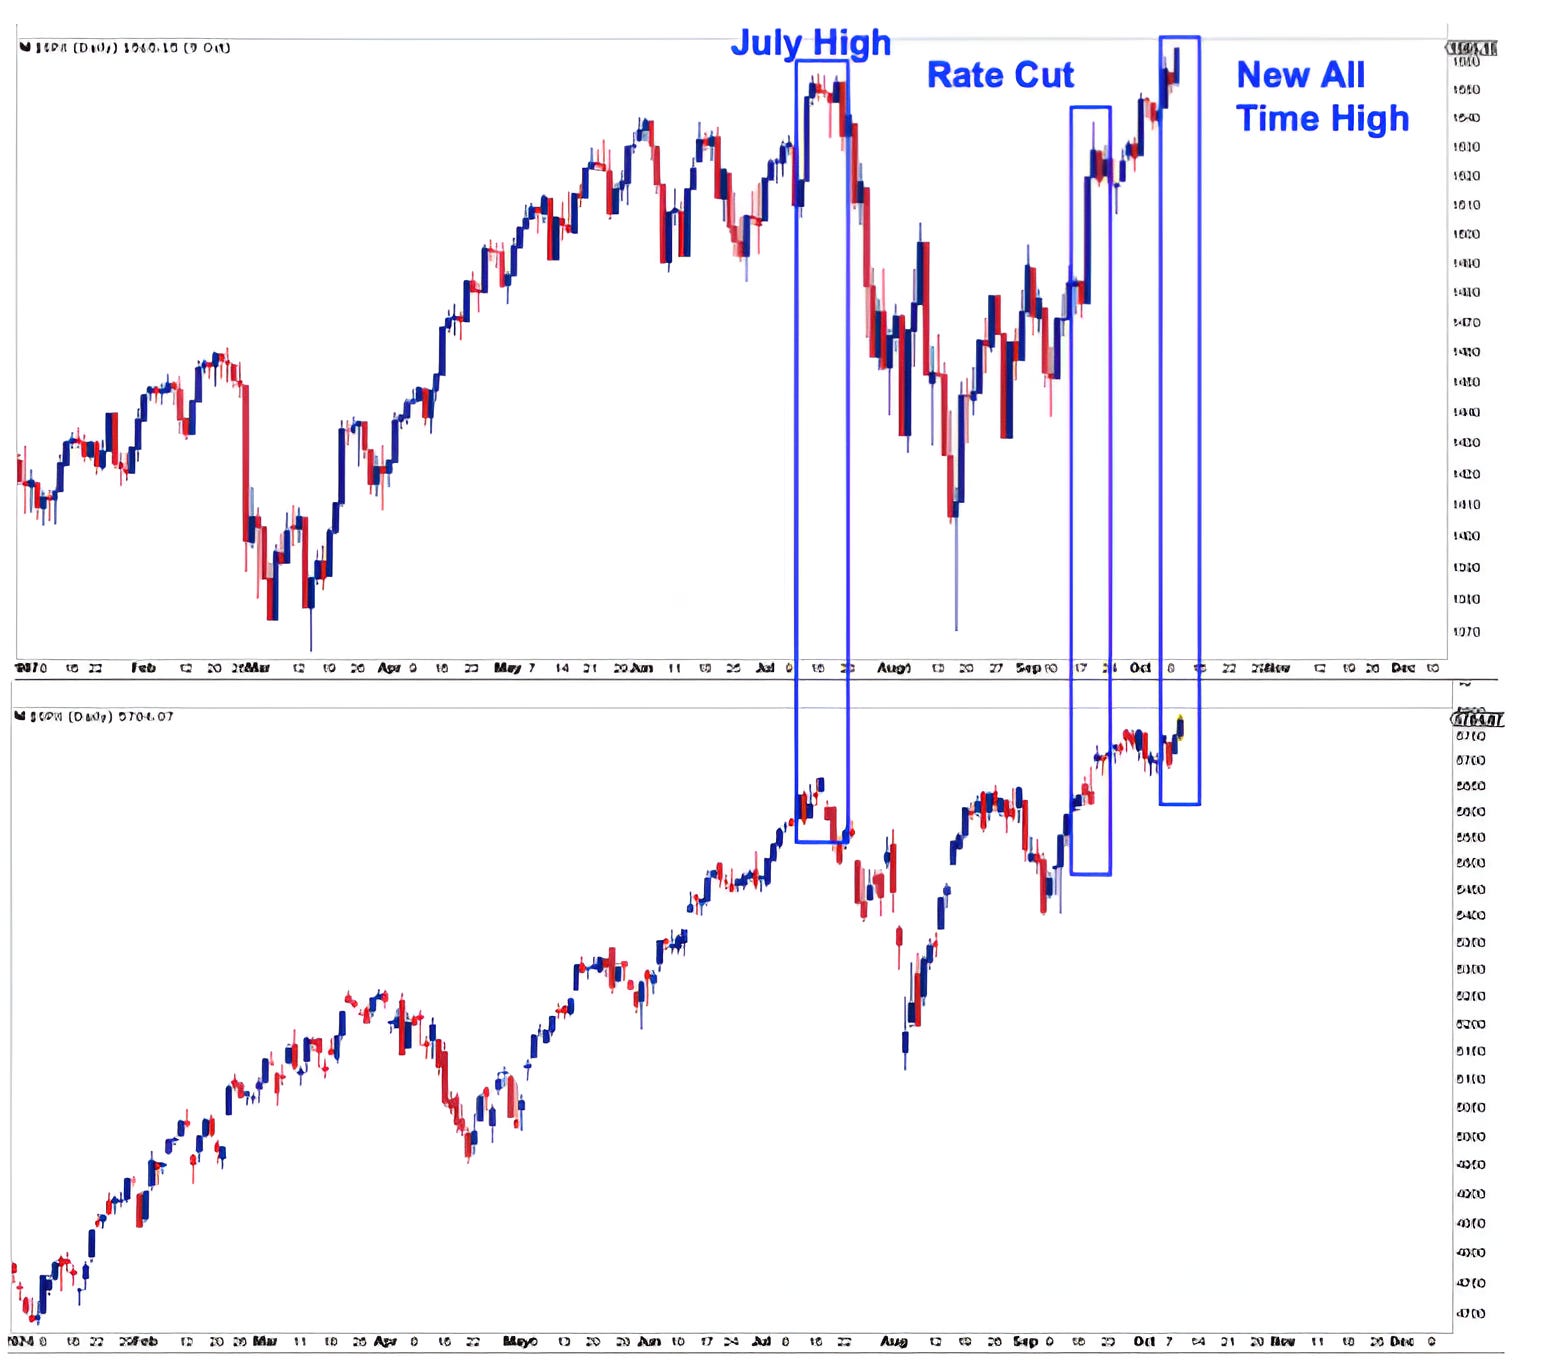
Source: NorthmanTrader. September 2024.
The top panel of the chart above shows the S&P 500 in 2007. The bottom panel shows the S&P 500 in 2024.
In 2007, the S&P 500 made a high in July, on September 18, with challenges arising in the banking sector, the Fed cut rates 50 basis points.
On October 11, 2007, the S&P 500 peaked and then began selling off into the
Financial Crisis.
This year (bottom panel), the S&P 500 made a high in July, and on September 18 (the exact same date), the Fed cut rates 50 basis points.
While we have pointed out excesses in terms of earnings expectations and valuation, we currently see few signs of anything like the financial crisis.
Tomorrow is October 11 and it’s the beginning of earnings season. We will see if it marks any type of short-term or long-term peak.
(Past performance is not indicative of future results. This is not a recommendation to buy or sell any security and is not investment advice. Please do your own due diligence).
5. A Young Bull…

Source: Carson Investment Research / Ryan Detrick. Through year-to-date 2024.
The chart above shows the returns and duration of S&P 500 bull markets since 1950.
For the purpose of the analysis, bull markets are defined as extended periods between 20%+ drawdowns (maybe not the best definition, but here we are) with returns calculated from the S&P 500 trough to its peak.
The median bull market, since 1950 has lasted five years as the S&P 500 has climbed 108%.
The current bull market is two years old and, over the past two years, the S&P 500 is up 61%.
In terms of duration and magnitude, the current bull market is only comparable to the one from October 1966 to November 1968.
If the current bull market turns into an average one (or even a median one), there is ample time and significant upside to go.
(Past performance is not indicative of future results. This is not a recommendation to buy or sell any security, please do your own research).