


Pour Some Sugar on Me
Despite near bubble equity valuations*, tight credit spreads and resilient inflation, the Fed is set to cut tomorrow. Indications of future policy will be more important than the move. Let's dig in...

One of our strongest market philosophies is based on the sage wisdom of Stanley Druckenmiller:
“Earnings don’t move the overall market; it’s the Federal Reserve Board… focus on the central banks and focus on the movement of liquidity… most people in the market are looking for earnings and conventional measures. It’s liquidity that moves markets.”
With equities near all-time highs; valuations near their 1999 peak*; credit spreads tight (see chart 3); bitcoin at over $105,000 (chart 5 here); gold near an all-time high; and recent inflation numbers stubbornly high (chart 4 here), one might conclude that liquidity is abundant.
However, it is within this context that the market is pricing with near certainty that the Fed will cut rates 25 basis points (0.25%) tomorrow.
We have argued for some time that the US is in a Fiscal Dominance regime where government debt outstanding and interest payments are so great that they impact central bank policy decisions. (Chart 4 here; here; in chart 5 here; in the introduction here; chart 2 here; and chart 2 here.)
On the other side of Fiscal Dominance are “bond vigilantes.”
The bond vigilantes recognize that traditional Fed policy controls the short end of the curve while the market (absent quantitative easing) controls longer maturities.
Since the Feds easing cycle began in September, 10-Year Treasury yields have increased over 1% from 3.3% to 4.4% (see chart 4 here).
While one could make the point that Treasury yields are pricing in the higher growth and stable inflation that would come from monetary easing, the higher yields may also be incorporating the risk of a government running a significant fiscal deficit with $36 trillion of debt outstanding.
Perhaps the elevated 10-Year yield combined with the other market factors cited above will lead to a change of Fed posture in tomorrow’s statement and press conference.
When the Fed last presented their expected path of policy in September’s Summary of Economic Projections (the dot plot), four rate cuts were considered for 2025.
Goldman Sachs has lowered its expectation to three (Goldman eliminated its expectation of a cut in January but continues to expect rate cuts in March, June, and September next year at a quarterly (or every-other-meeting) pace) and we will see if tomorrow’s meeting reduces expectations further.
In our view, it is important to remember November 2021.
It was simply the hint that the Fed would accelerate the end of quantitative easing (which would in turn set the stage for the rate hike cycle) that halted the ascent in equities.
The Nasdaq 100 and Russell 2000 Small Caps peaked immediately.
The S&P 500 drifted higher until early January 2022 and had its cycle high five weeks after the the two other indexes began to decline and over two months before the rate hike cycle began.
Finally, last weekend’s cover of Barron’s (picture below) and the heading “Why the Stock Market Could Gain Another 20% in 2025”, certainly raised my antennae.
In the introduction here, we wrote about our view of the challenges with a near-term 10% gain.
While nobody rings a bell at the top, the Barron’s cover reminded me of the last scene in Rocky 3 (here), when Apollo asks Rocky for a private rematch. Given that no officials or ring master is there to start the fight, Apollo says, “ding, ding.”
Pour some sugar on me.
*See chart 3 here. At its current level of 23x next 12 months expected earnings, the S&P 500 is at its second highest price to earnings valuation of the past 30 years. The highest - 24x - was in 1999.

1. A Stealth Correction
Source: Trading View. Through year-to-date 2024.
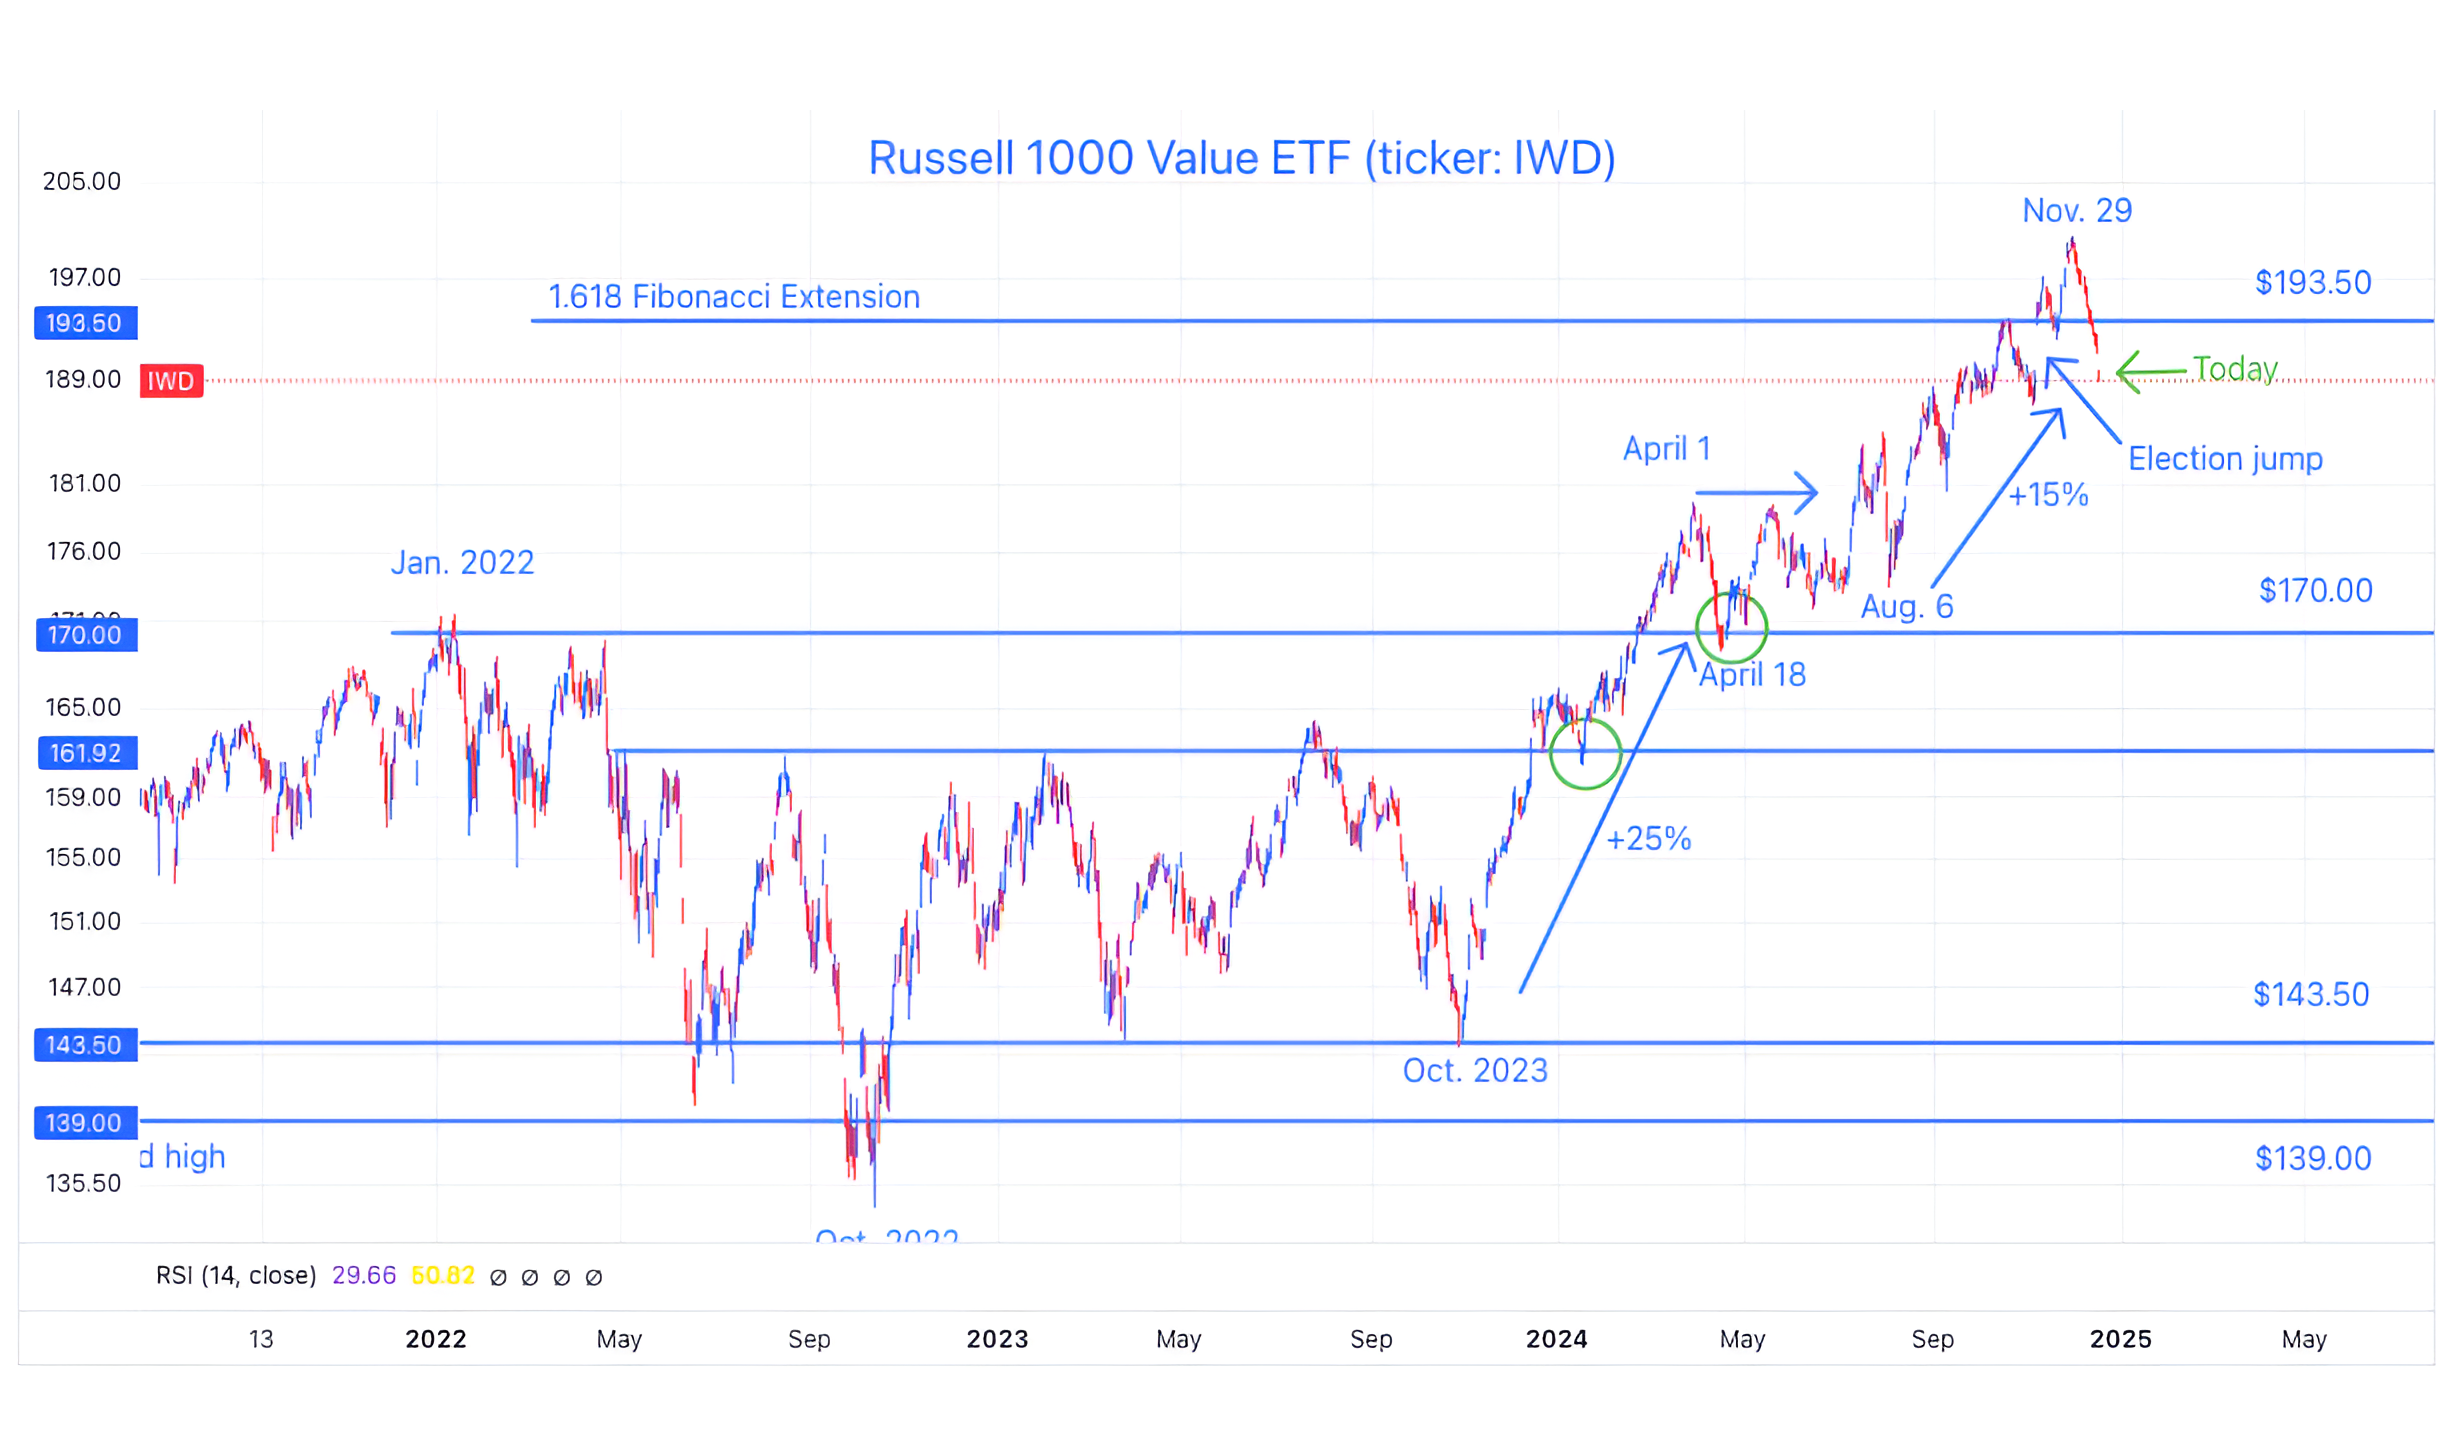
The chart above shows the Russell 1000 Value ETF (ticker: IWD).
We showed this chart last week (here) as the index had moved down to its 1.618 Fibonacci extension level from its late November peak.
Our view at the time was that the Russell 1000 Value ETF would bounce and potentially form the right shoulder of a bearish “head and shoulders” formation.
Instead, the Russell 1000 Value ETF has moved down 12 straight days (including today) and has lost nearly 6% in the process.
Over the same time, the S&P 500 has moved slightly higher, however, it has done so as more shares have declined than advanced every single day during this period.
Needless to say this is an interesting dynamic.
On one hand, we can make the case that there has been so much selling (under the surface) that the correction is over and the market should bounce higher.
On the other hand, it’s possible that the weakness under the surface begins to hit the Magnificent 7 and the overall market begins to drop.
Given typical end of year seasonal strength, we would expect a bounce in the Russell 1000 Value ETF. We believe the real battle will be (if and) when the ETF re-approaches the 1.618 Fibonacci extension of its 2022 sell-off.
(This is not a recommendation to buy or sell any security and is not investment advice. Past performance is not indicative of future results. Please do your own research and due diligence).
2. Corporate Credit Spreads Are Tight
Source: The Daily Shot, Bloomberg. Through year-to-date 2024.
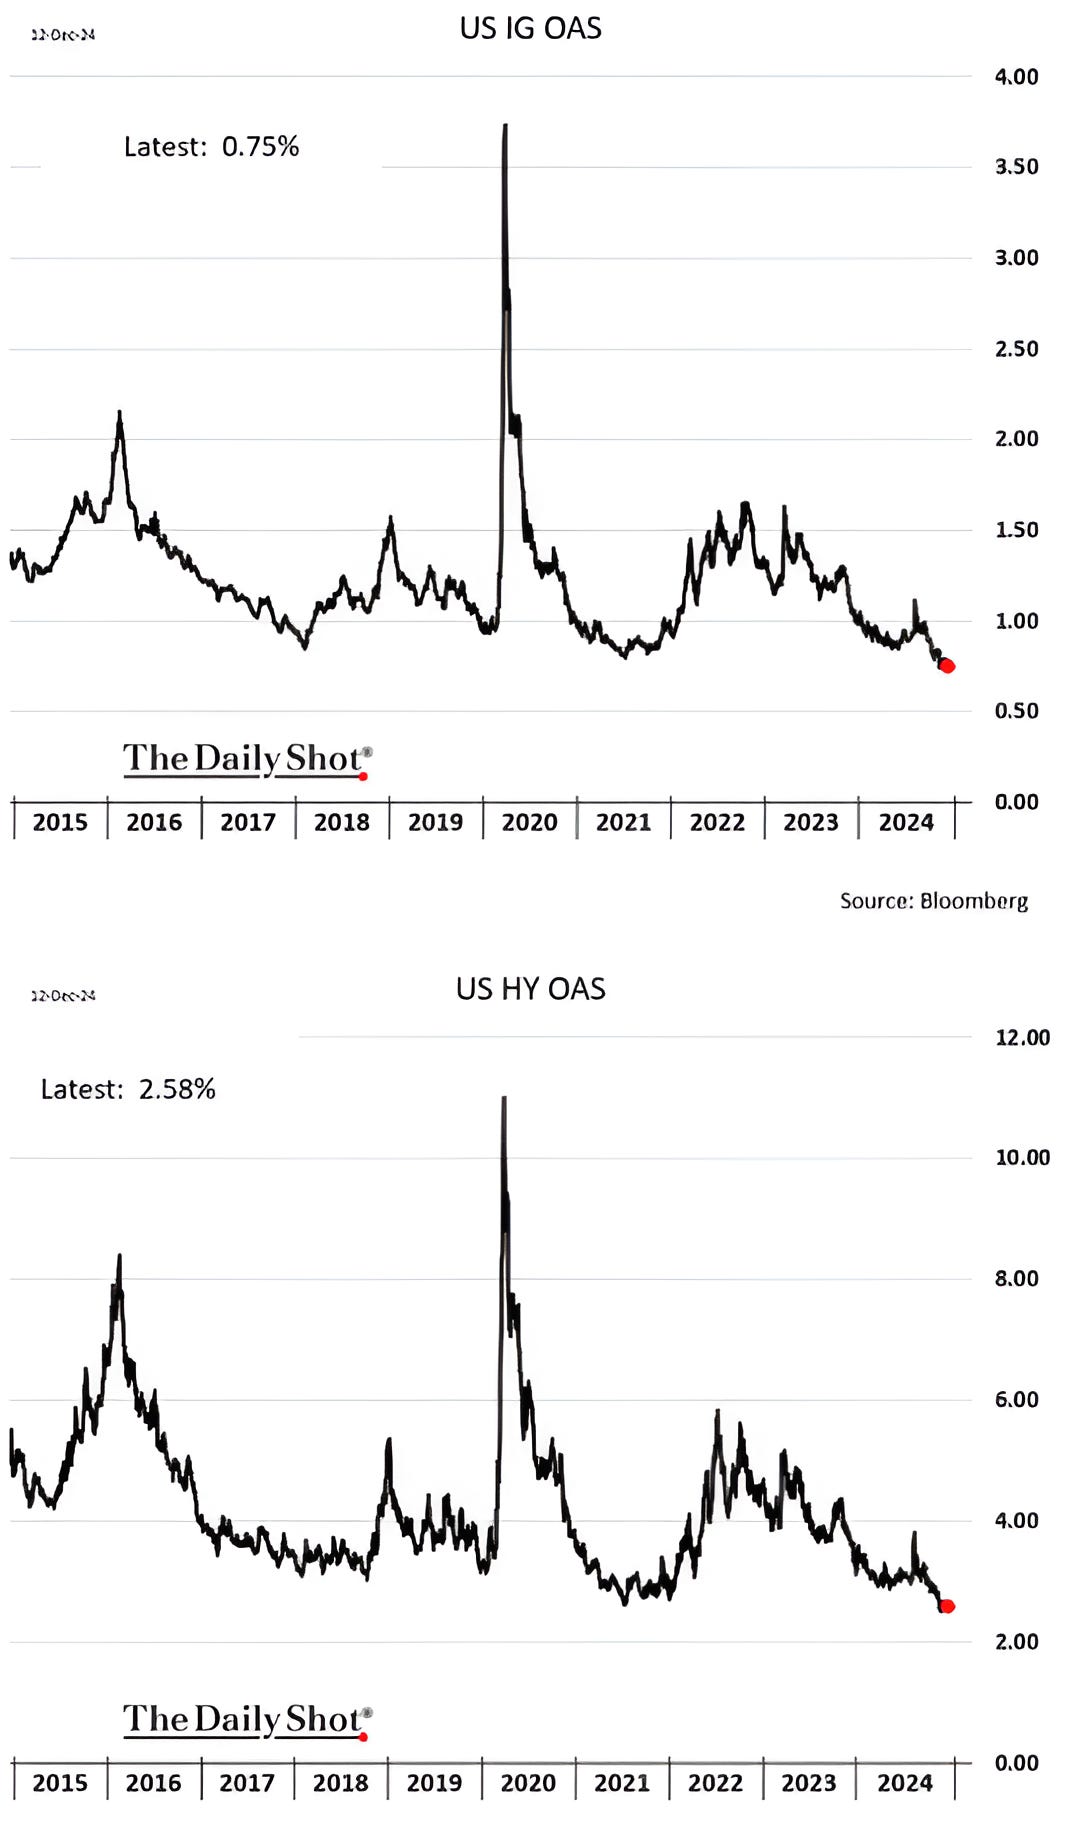
The top chart above shows investment grade corporate credit spreads and the lower chart shows high yield credit spreads.
Both investment grade and high yield credit spreads are at their tightest levels of the past 10 years.
While this does not mean a sell-off is imminent, it does mean that investors are receiving very little reward for the corporate risk they are taking.
(Past performance is not indicative of further results. This is not a recommendation to buy or sell any security and is not investment advice. Please do your own due diligence).
3. One Last Strategist…
Source: BCA, Peter Berezin. Through year to date 2024.
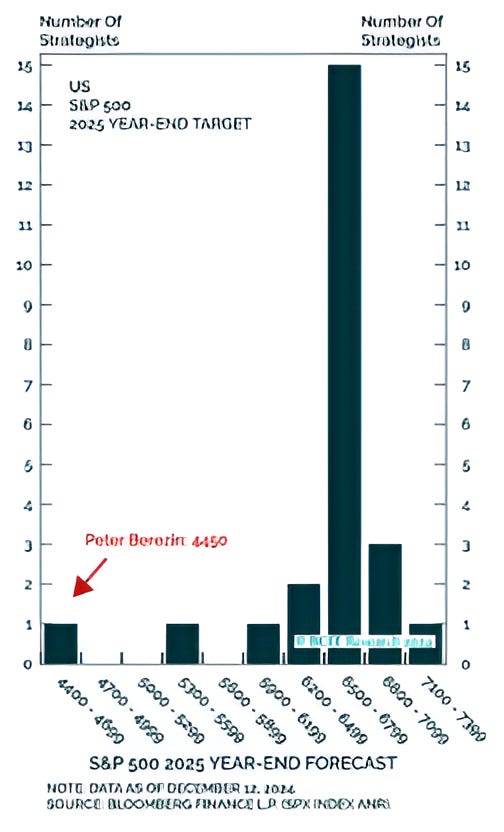
The chart above shows the tight grouping of Wall Street Strategists’ year-end forecasts and highlights (with the red arrow) the contrarian target of 4450 from BCA’s Peter Berezin.
Last week, when we showed FundStrat’s bullish 2025 S&P 500 first half, followed by the bearish second half (here), we thought that would be the end of our posts on 2025 Strategists’ Views (chart 3 here and here).
As we noted last week, it is important to highlight a range of views and to understand the rationale behind them.
Interestingly, the proximate cause of BCA’s expected equity market sell-off is a spike in Treasury Yields in the first half of 2025 that forces President Trump to abandon tax cuts.
In other words, BCA is concerned about bond vigilantes and higher Treasury Yields which we have been highlighting all year.
Where we differ is that BCA is calling for a mid-year US recession in 2025; whereas in our view, if Treasury yields move higher leading to equity volatility, the Fed will implement QE (or some other balance sheet expansion measure) that will lower longer-term Treasury yields and contain the equity market sell-off.
As we noted last Thursday (here), we will continue to keep an eye on Treasury yields.
(Past performance is not indicative of future results. This is not a recommendation to buy or sell any security and is not investment advice. Please do your own due diligence).
4. Everyone on the Same Side of the Boat…

Source: Bank of America. Through year-to-date 2024.
The chart above from the Bank of America Fund Managers Survey (FMS) shows the percent of Fund Managers overweight US equities.
The percent of Fund Managers overweight US equities is at the highest level since 2021.
While this in itself is not a catalyst, one might wonder where additional equity buyers will come from.
Furthermore, it is easy to see that other periods of heightened overweight positioning have often been better selling situations rather than buying opportunities.
Although we have not shown it, the accompanying chart to the one above shows that fund managers have their lowest allocation to cash since 2001.
(Past performance is not indicative of future results. This is not a recommendation to buy or sell any security and is not investment advice. Please do your own due diligence).
5. Two Targets for the Brazilian Real
Source: Trading View. Through year-to-date 2024.
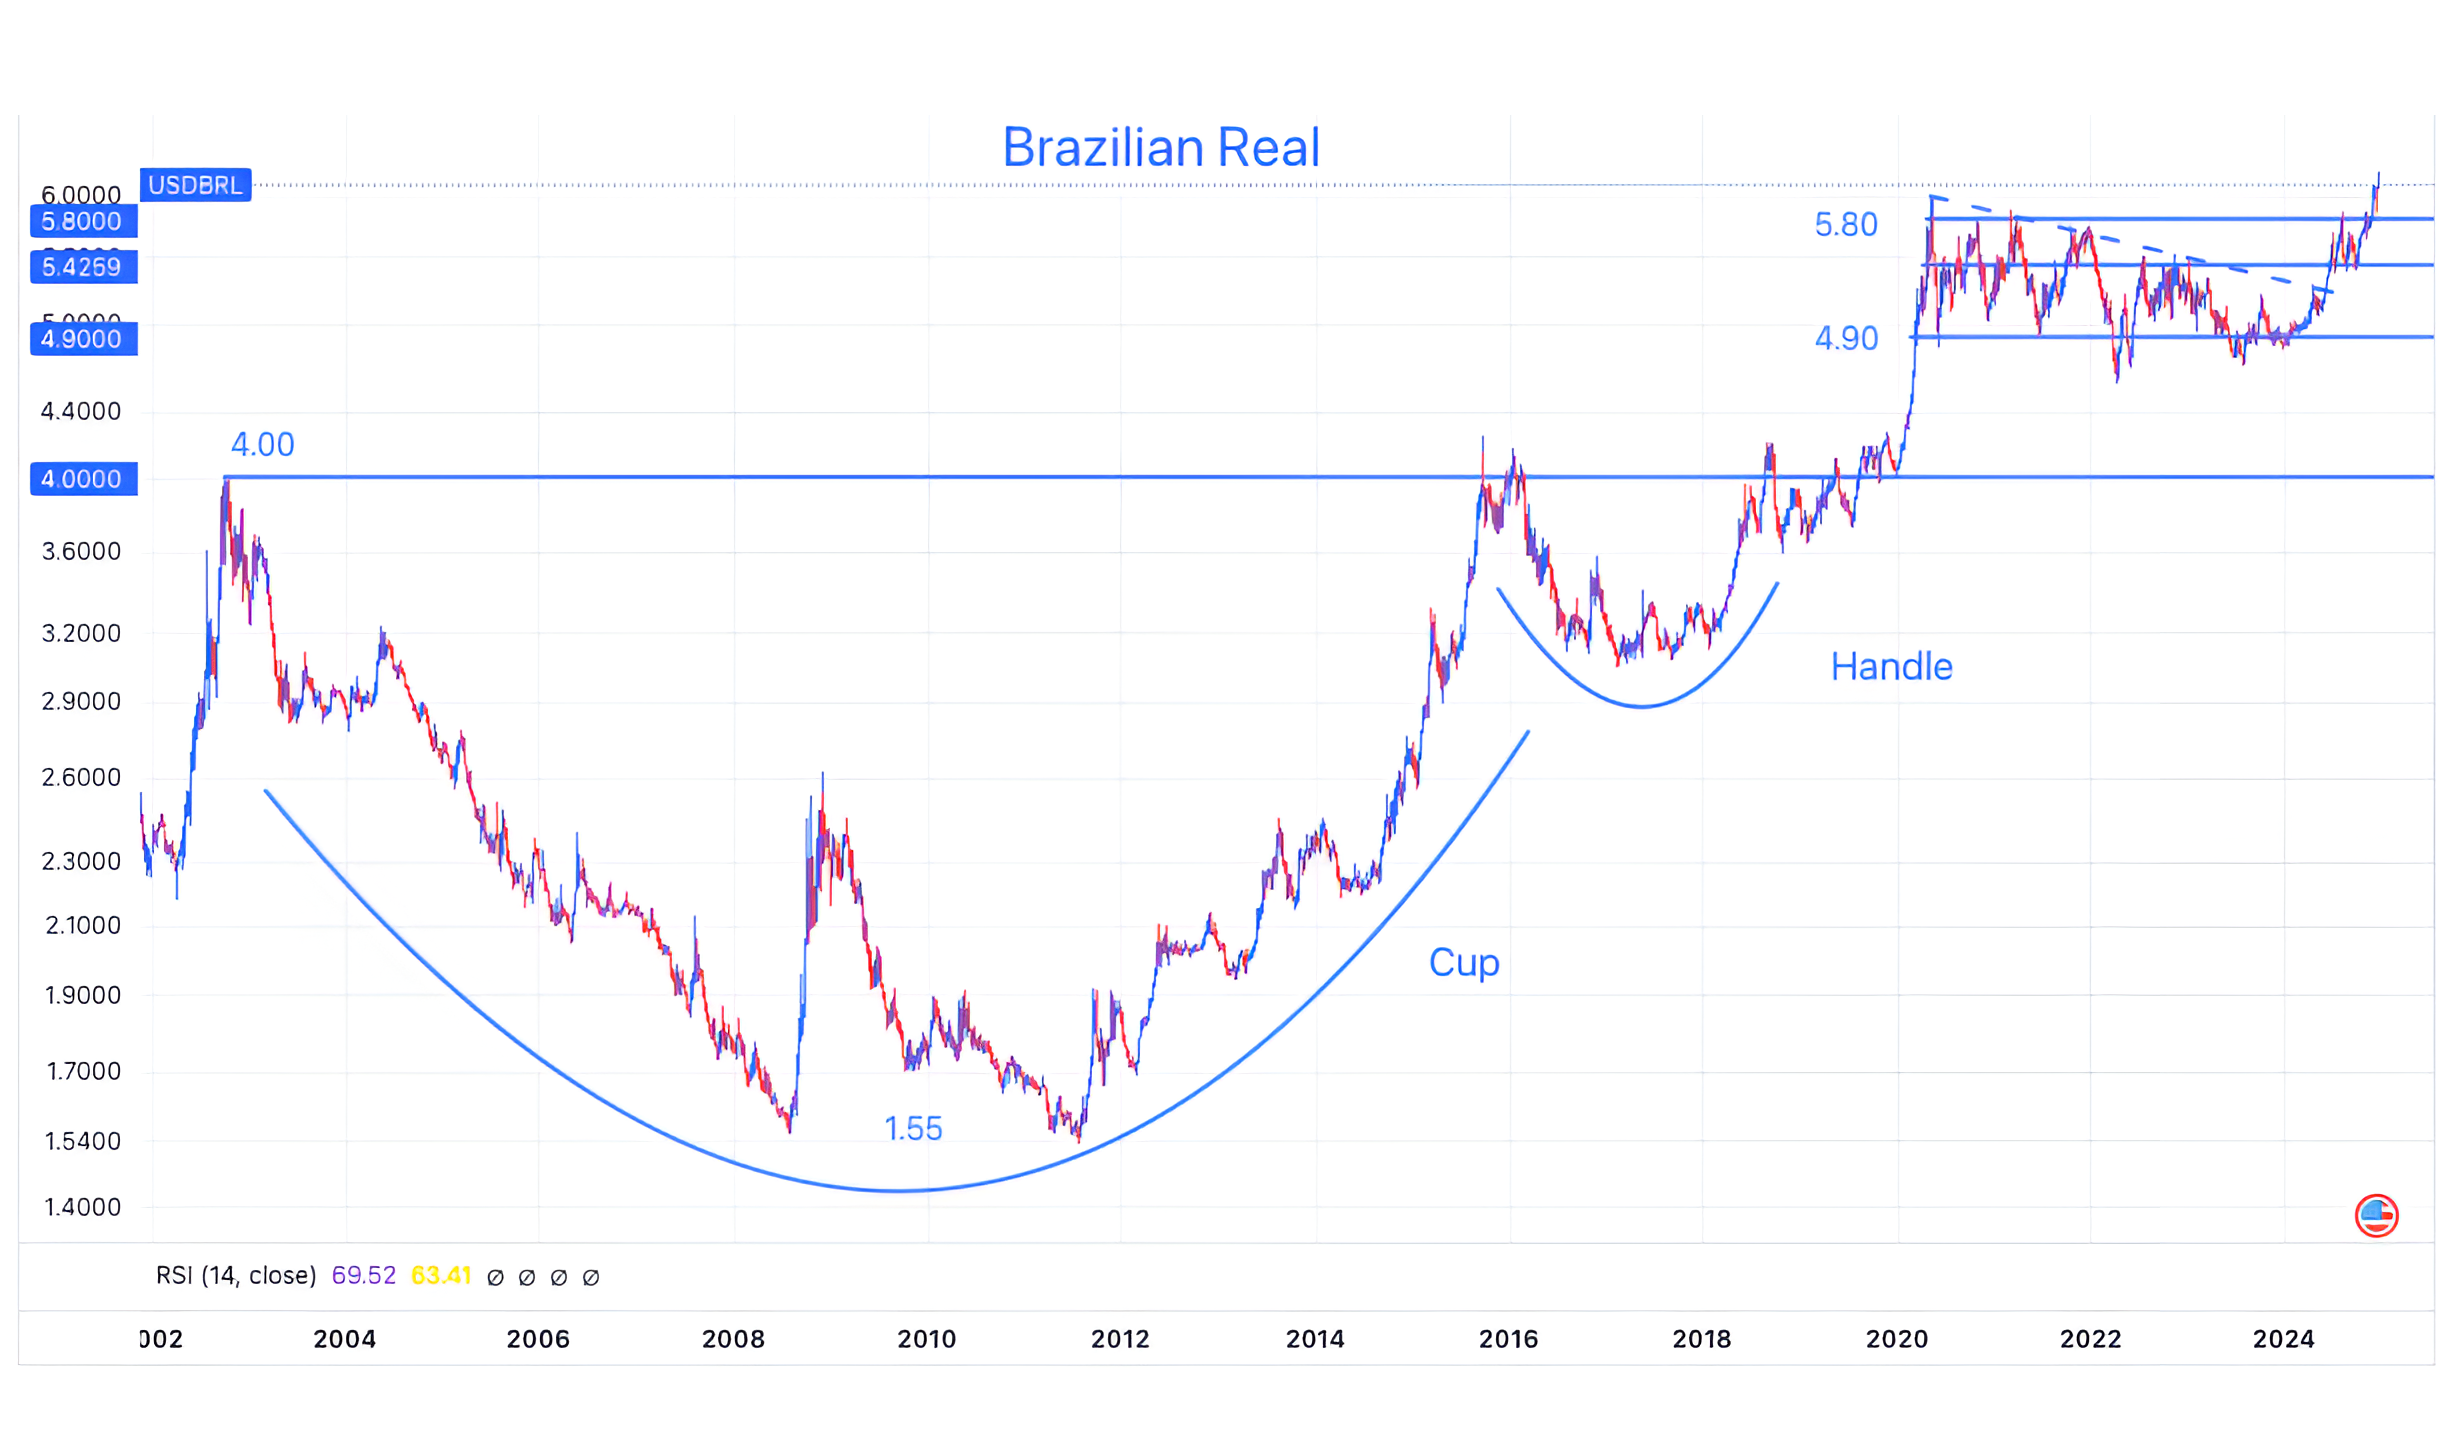
The chart above shows the Brazilian Real (BRL) / US dollar cross from 2000.
As I wrote the last time I showed this chart (here), although I have spent considerable time in Brazil (and I love the country), it would be naive of me to say that I understand all of the factors that feed into the Brazilian Real (BRL) / US dollar exchange rate.
However, looking at the chart, we can come up with two possible targets for the Real:
The first target is 6.45. This is based on the long-term cup and handle pattern. The target is the difference of the top of the cup and bottom of the cup added to the top of the handle. ((4.00-1.55)+4.00)
The second target is 6.70. This is based on simple symmetry as the BRL has moved above its 4.5 year sideways range. (5.80 + (5.80-4.90)).
These are simply observations based on the chart.
(Past performance is not indicative of future results. This is not a recommendation to buy or sell any security and is not investment advice. Please do your own research and due diligence).