


One Way or Another...
Throughout 2024, we have cited a number of imbalances that could challenge the ascent in equity markets. Those imbalances continue to pile up. At what point will markets respond? Let's dig in...

We have continued to cite our view of the challenges that, in our view, the equity market continues to ignore.
Is it simply climbing a wall of worry or is there a more fundamental story that we’re ignoring?
Typically, a fundamental story begins with earnings and earnings growth.
While our base case does not incorporate S&P 500 earnings dropping or a recession, the consensus expectation of 14% growth, in our view, leaves little scope for upside surprise.
Although we recognize some of the animal spirits that Trump 2.0 along with Elon Musk and other business friendly cabinet members has unleashed, a portion of this excitement seems to have been priced in since the election.
Furthermore, we continue to see the challenge of the transition from Biden to Trump and specifically from Treasury Secretary Yellen and her bag of tricks to Scott Bessent (despite his qualifications). (We wrote about this in the introduction here).
From a valuation standpoint, we have continued to characterize today’s top-decile equity market valuation as demanding.
We continue to recognize and highlight that valuation is not a catalyst.
However, in the past (and I know compliance tells me history is not a guide), at this point in the cycle (not coming out of a recession) elevated valuations have often been resolved through multiple compression rather than earnings growth.
In investing, timing is an art and it does not pay to be early.
With that in mind, despite our fundamental concerns, we are continuing to watch charts and inter-market relationships to hone the art and calibrate the timing.
It won’t be perfect, but we recognize that one way or another, this market will not remain elevated forever.

1. The Nasdaq 100: Picture Perfect

Source: Trading View. Through year-to-date 2024.
The chart above shows the Nasdaq 100 ETF (ticker: QQQ).
We have continued to expand our list of concerns:
Earnings (expectations too high) (chart 4 here; see chart 3 here; chart 3 here; here; here; here; here; chart 3 here; chart 3 here; charts 2, 3 and 4 here; chart 3 here; and chart 3 here);
Valuation (top decile) (chart 3 here);
Semiconductor weakness (chart 3 here);
Value Shares moving down (chart 1 here);
Sentiment (are there any bears left?);
The macro environment (Europe and China look seriously challenged);
Geopolitics (a coup in Syria would have been a big deal);
Elevated Treasury Yields (see chart 4); and
The strong dollar (chart 5)…
one thing we can not argue with is the chart of the Nasdaq 100.
On July 1, when the Nasdaq 100 ETF was at $480, we wrote:
“As stated above, we continue to be constructive through year-end 2024, and after a pause /fight in the $496 area, the Nasdaq 100 can trade above that level.”
In the post election period, a sustainable move above $496 began.
Three weeks ago (here), we noted that the Nasdaq 100 ETF was retesting the $496 level and we wrote that in our view, that despite imbalances there was a high likelihood (we said 70%) that:
“the Nasdaq 100 and S&P 500 will make new all-time highs before experiencing a more significant sell-off in the first half of 2025.”
We continue to see this scenario evolving.
Throughout this year, we have continued to cite imbalances that in the past may have signaled the potential for equity market volatility.
However, our strategy, rather than over-reacting in advance by selling down exposure has been to “insure” our positions through puts and put spreads.
At some point, the weight of the challenges cited above will likely impact equity market, but looking at the chart of the Nasdaq 100, that point is not now.
(This is not a recommendation to buy or sell any security and is not investment advice. Past performance is not indicative of future results. Please do your own research and due diligence).
2. One More Strategist View…

Source: FundStrat, Bloomberg. Through year-to-date 2024.
The chart above shows the S&P 500 with its 2025 as projected by Tom Lee at FundStrat.
We have been showing and highlighting 2025 S&P 500 Wall Street projections (chart 3 here and here) - today we have another.
Tom Lee is the former (it’s been a little while now) equity strategist at JP Morgan and he’s known for his bullish prognostications.
What we found interesting about his 2025 outlook is two things:
On Tuesday (chart 3 here), we noted that the Wall Street Strategists were tightly grouped between 6500 and 7000 with their 2025 year-end target. Tom Lee has nearly hit both by presenting a path that takes the S&P 500 to 7000 at mid-year and back down to 6600 at year-end.
We have continued to highlight our view that the S&P 500 will experience a first half sell-off and a likely second half recovery - Tom Lee sees an opposite path. Anytime someone differs with our view, we want to understand it and present the differences.
With point 2 in mind, let’s go through some Tom Lee’s rationale:
The first half rally, in Tom Lee’s view, will be driven by Fed easing (next cut likely next week) and economic enthusiasm surrounding Trump and Trump policies.
The second half sell-off is based on four factors:
Government spending cuts (the DOGE) may begin to cut into GDP (fiscal restraint);
Tariffs (see chart 3 below), if implemented, may cut into growth
Seasonality: the second half of year 1 of the US Presidential cycle is often weak;
After two consecutive years of 20%+ returns, returns in year three have typically been more constrained.
Our view of a sell-off is based on a combination of a “stretched” market in terms of momentum; overly bullish sentiment; premium (top decile) valuation across a number of metrics; disappointing earnings; the debt ceiling; and challenges with the Washington transition (Yellen the juggler leaving the Treasury while several balls are in the air).
One final note, Tom Lee is forecasting 2026 S&P 500 earnings of $300. If correct, mid-year, the S&P 500, based on his view, would be trading at 23.3x 2026 (not next 12 months) earnings. As peak next 12 months earnings (in 2000) were 24.2x, we see this multiple as possible, but unlikely.
All of that said, we believe it’s important to highlight both views.
Our philosophy throughout this year has been to not preemptively react to any potential market move, but to rely on technical signals and clues to inform positioning. We will continue this in 2025.
(Past performance is not indicative of further results. This is not a recommendation to buy or sell any security and is not investment advice. Please do your own due diligence).
3. Tax Cuts vs. Tariffs

Source: Ned Davis Research. Through year to date 2024.
The chart above from Ned Davis Research shows US cyclical vs. defensive shares during 2017 (blue) and 2018 (orange).
In 2017, when the US tax cut was the priority of the Trump 1.0 administration, cyclicals (Industrials, Consumer Discretionary, Financials, Materials, Energy) outperformed.
In 2018, when Tariffs were the priority of Trump 1.0, defensive sectors (Healthcare, Consumer Staples, Real Estate) outperformed.
At this point, it is difficult to tell the priority for Trump 2.0.
While the incoming administration knows it needs to extend its original tax cuts, given the deficit and other factors, it may be difficult to pass additional tax cuts. Will extensions be enough for cyclicals to outperform?
On the other hand, Trump has been very vocal on tariffs. However, there is speculation that Trump is using tariffs as a negotiating tactic while warming up to the biggest tariff recipient by inviting the Chinese Leader Xi Jinping to his inauguration.
All of that said, I thought the above was an interesting lens through which to consider the 2025 equity market.
(Past performance is not indicative of future results. This is not a recommendation to buy or sell any security and is not investment advice. Please do your own due diligence).
4. Checking in on the 10 Year US Treasury Yield
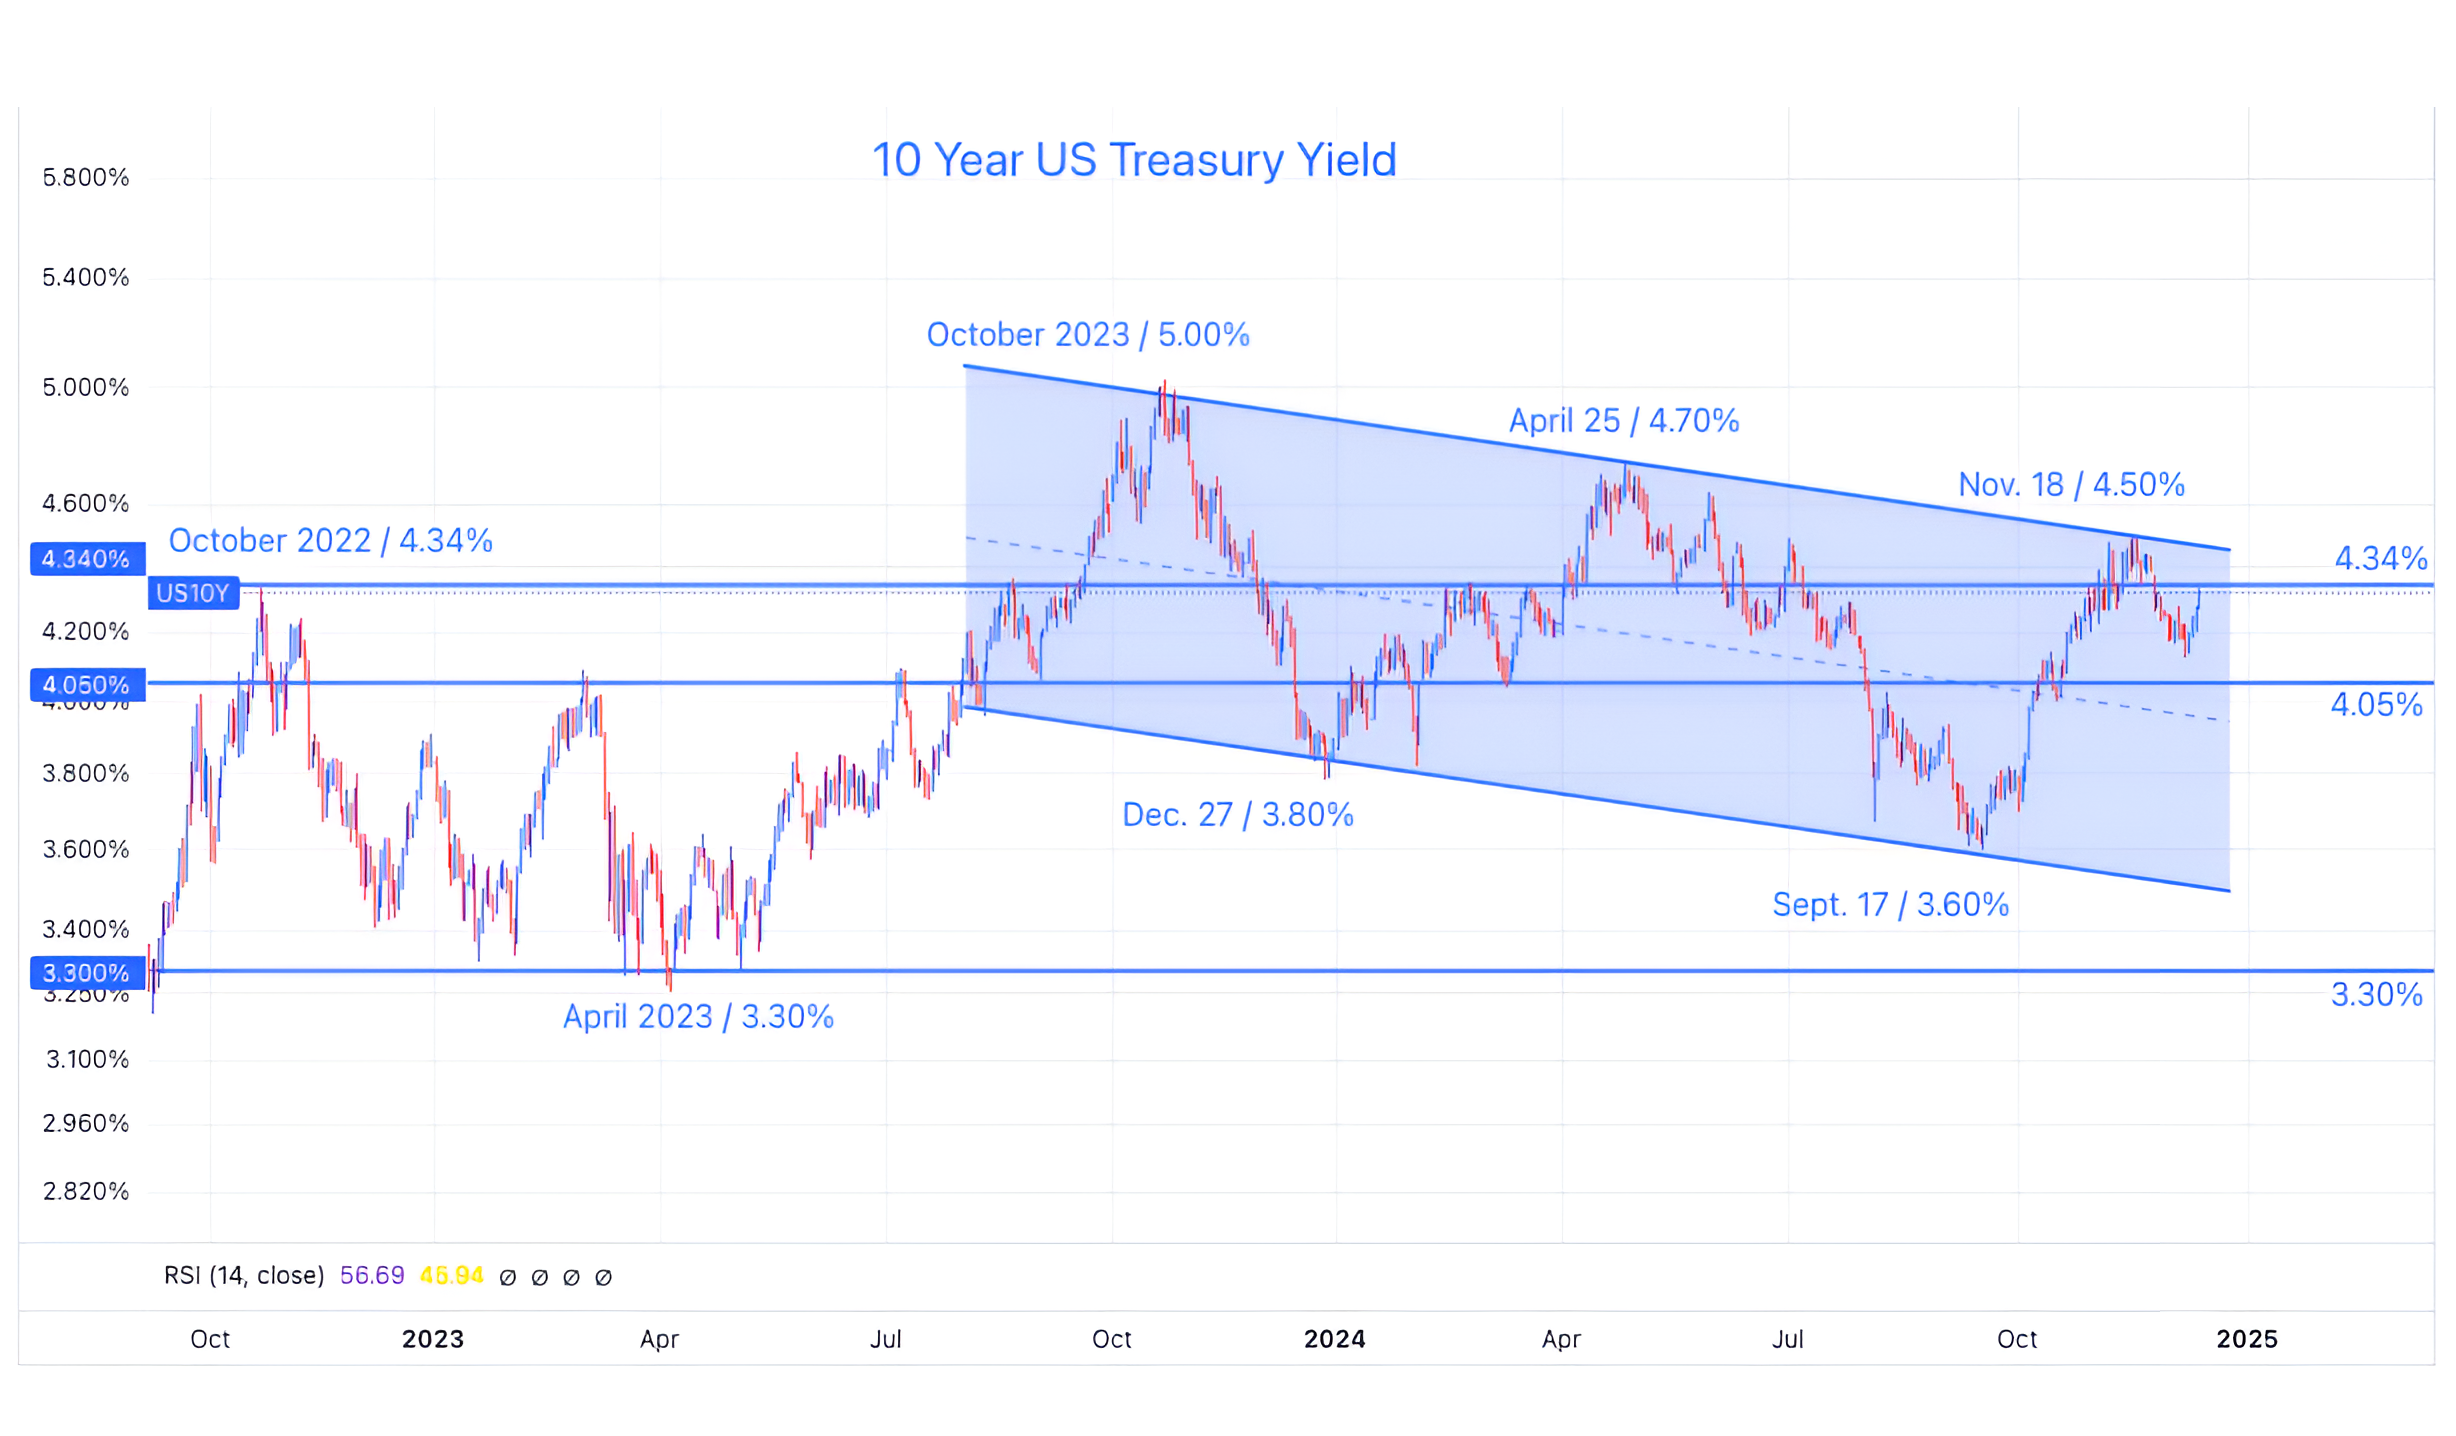
Source: Trading View. Through year-to-date 2024.
The chart above is a close-up of the path of 10-Year US Treasury yields over the last two+ years.
The last time 10-Year US Treasury yields hit 4.34%, we expressed our concern (chart 2 here) that they might constrain equity upside.
There is now a 99% probability priced into the market that the Fed will ease next week.
Given some measures of CPI (see chart 4 here), in isolation, in our view, a cut may be unwarranted.
Long-term Treasury Yields often reflect growth and inflation expectations.
If lower Fed Funds levels suggest higher inflation and higher growth, 10-Year Treasury yields, all else equal, could move higher.
As the market has digested recent inflation data and has concluded that it may be a little higher than hoped, but not high enough to stop the Fed from cutting this dynamic has been reflected in the little spike back up to the 4.34% line in 10 Year US Treasury yields (above).
We continue to believe that the inter-related issues of inflation and higher Treasury yields are a significant risk to equity markets.
As we saw in 2022, inflation is a multiple-shrinker. From a “finance” perspective, as analysts discount future cash flows to determine equity valuations, those cash flows are worth less (today) in an inflationary environment.
Similarly and related, as the 10-Year yield informs the discount rate in any discounted cash flow analysis, as the 10-Year yield moves higher, equity valuations often move lower.
With an equity market that is trading at a top decile valuation (chart 3 here), shrinking multiples represent a significant risk.
On the near-term chart of the 10-Year US Treasury yield, we are watching: a) the 4.34% line that has been a battleground for the last two years and b) the downtrend channel that has formed.
From both fundamental (inflation, growth and issuance) and technical (chart) perspectives, we continue to see the longer-term path of less resistance as higher.
Fundamentally, the most important factor we are watching is the amount of Treasury issuance that will be required to a) refinance existing debt (charts 4 here and here) and b) finance the deficit (see chart 5 here).
From a technical (purely chart perspective), we have showed a very long-term 10-Year US Treasury yield (here). In our view, the 40-year bull market in Treasuries as yields moved lower from 1982 to 2022 is over.
(Past performance is not indicative of future results. This is not a recommendation to buy or sell any security and is not investment advice. Please do your own due diligence).
5. The US Dollar

Source: Trading View. Through year-to-date 2024.
The chart above shows the US Dollar.
We last showed the US Dollar chart in mid-October here as the dollar had bounced from the lower end of our range (at the end of September) to our “lower mid-level” of $104.
After a brief pause at $104, the Dollar moved to the high-end of our range at $107 and paused.
It is now re-attacking the $107 level.
In general, since 2022 large moves in the US Dollar have been inverse to equity market performance.
In other words, US Dollar strength has often foreshadowed equity weakness and vice versa.
We believe that if the dollar were to strengthen sustainably above the $107 level this would be an headwind to equities.
(Past performance is not indicative of future results. This is not a recommendation to buy or sell any security and is not investment advice. Please do your own research and due diligence).