


The Tide is High...
As Warren Buffett says, “Only when the tide goes out do you discover who's been swimming naked.” With equities rallying, the tide remains high, but signs of low tide may be developing. Let's dig in...

Since early June (here), we have been writing about our expectation of an equity market correction either late this year or early next year:
In our view, the rally will continue for the next 3-9 months driven by technicals and seasonality and supported by stealth liquidity and the expectation of improving fundamentals.
That said, we are beginning to see possible cracks in the foundation of the market’s ascent that, in our view, could become more apparent either late this year or in early 2025.
Although it’s a fools errand to try to develop a 6, 12 and 18-month road map for the equity market, we see the possibility (10-15% likelihood) of a 30% sell-off that see the S&P 500 bottom around 4000-4200 in 2025 from a peak of 5500-5800 in 2024.
As the equity market overshot our mid-year expectation, in September (here) we increased our probability of a sell-off to 30%:
“While I still believe that a post-election rally (regardless of who wins) is likely, given some of the macro data we are watching (not only in the US but China); inflated 2025 US earnings expectations, elevated valuations and stretched sentiment (even the most consistent bears have capitulated), we believe the likelihood of a significant sell-off has increased to 20-30%.”
And a month ago, we wrote:
“We would now call this a 30% chance of a 20-30% sell-off from a level of around 6000 in the S&P 500 leading the index back down to a range 4200-4800.”
Most recently (three weeks ago here), we wrote:
“We see a 30% probability of a significant sell-off (probably around 20% down) in the first half of 2025. This would bring the S&P 500 from its recent peak of 6000 to a level below 5000.
We believe this volatility will be met with liquidity including some form of Quantitative Easing / Fed balance sheet expansion that will drive an equity recovery.”
While we are not beholden to the calendar, we are now at the beginning of our volatility-expectation period.
Combined with the post-election rally in stocks a questionable earnings season (chart 3 here); elevated valuations (chart 3 below); sentiment that we see as “greedy;” and the challenges of transitioning to a new administration (we described this on Tuesday here), we believe the ingredients for volatility are present.
While we don’t want to be early, some of the indexes (we showed the Equal Weight S&P 500 and Small Caps on Tuesday) and sectors (we show Technology in chart 2 below) that we track have hit areas where we would expect a pause.
A valuation metric we haven’t shown, but is one that Warren Buffett has highlighted is the market capitalization-to-GDP ratio. It is currently around 200% which is a level that Buffett compared to "playing with fire" in a 2001.
Berkshire Hathaway has been selling down its equity portfolio throughout this year and it now is holding $325 billion of cash which is a record for the company and nearly double the $168 billion balance at the end of last year.
Although we don’t know if a pause (should it occur) will transition into something more sinister, we have added puts and put spreads to our portfolios.
In investing, there are times to press the gas, there are times to ease up on the accelerator, there are times to tap the breaks and there are times to pump the breaks.
Although we are not yet begun to apply the breaks, we have eased up on the accelerator.
The Tide is High, but a low tide may be on the horizon.

1. The Nasdaq 100 Has Offered No Outperformance for the Last Year

Source: Trading View. Through year-to-date 2024.
The chart above shows the Nasdaq 100 relative to the S&P 500.
When the chart is moving higher, the Nasdaq 100 is outperforming and when the chart is moving lower, the Nasdaq 100 is underperforming.
During 2023, allocating to the Nasdaq 100 over the S&P 500 offered investors a significant advantage.
For the year, the Nasdaq 100 rose 55% (its best year since 1999) while the S&P 500 returned 26%.
Over the past year, however, the Nasdaq 100 has performed in line and year-to date the S&P 500 is outperforming the Nasdaq 100 by 2%.
We will watch for a new trend to develop in this relationship in order to favor one index over the other.
In our view, this chart is a reflection of our philosophy that passive investments (ETFs) need to be actively managed.
(This is not a recommendation to buy or sell any security and is not investment advice. Past performance is not indicative of future results. Please do your own research and due diligence).
2. Technology Has Hit Our Upper Target…

Source: Trading View. Through year-to-date 2024.
The chart above shows the Technology Sector ETF (ticker: XLK).
On Tuesday (here), we showed the Equal Weight S&P 500 and the Small Caps bumping up against targets that we had identified - today, we are showing a similar dynamic for the Technology Sector overall.
When we last showed the Technology Sector, we highlighted two targets:
The near-term target, similar to what we have shown on several indices, was the the 1.618 Fibonacci extension of the 2022 sell-off.
The higher target was based on “symmetry.”
Symmetry suggests that the dollar value of the sideways range will be equal to the dollar value of the increase once the range has been exceeded.
In the case of the Technology Sector ETF, the 2021-2023 range was $64.
Once the ETF moved above the range, our long-term target was $64 above the ceiling of the range or $241.
(As an aside, I recognize that things like the 1.618 Fibonacci extension and symmetry to establish targets at best sound simplistic and at worst seem un-rigorous.
However, I’ve shown these enough times across a broad range of price series, that hopefully it is easy to recognize their use).
Similar to the Equal Weight S&P 500 and the Small Caps, we would expect the Technology Sector to pause at its current level.
Why is this important?
Technology represents nearly 1/3 of the S&P 500.
In other words, if the Technology sector were to pause, it may be a challenge for the index to move significantly higher.
(Past performance is not indicative of further results. This is not a recommendation to buy or sell any security and is not investment advice. Please do your own due diligence).
3. Valuation Doesn’t Matter…Until It Does

Source: JP Morgan. Through year to date 2024.
The main (graphical portion) of the chart above shows the price to forward earnings of the S&P 500. (We showed a similar chart in chart 4 here).
The box overlay on the chart shows the current valuation of the S&P 500 based on different measures vs. their respective 30-year averages.
We never consider valuation a catalyst - an expensive market will not go down because it’s expensive and a cheap market will not go up because it’s cheap.
We do view valuation as a measure of risk.
An expensive market can often drop further and faster than a cheap market.
There are a few things to note on this chart:
As we’ve stated before, we are in the third valuation bubble period of the past 30 years. The other two expanded further than many expected but both foreshadowed significant drawdowns.
In the box, the second valuation is the CAPE (cyclically adjusted PE) or Shiller PE (for more information see here). The CAPE has a strong inverse correlation with 10-year returns. Similar to the conclusions that could be drawn from the charts we showed from Bank of America (chart 4 here) and Apollo (chart 3 here), the elevated CAPE ratio correlates to low long-term equity returns.
The final valuation in the box compares the earnings yield of the S&P 500 (earnings / price) and BAA bond yields. In the past, I ran an analysis of this relationship that I called the modified Fed model (the Fed model compares the earnings yields of the S&P 500 with 10-Year US Treasury Yields). My conclusion was that the risk and return characteristics of buying equities when the earnings yield of the S&P 500 was lower than the yield of BAA bond yields as it is now was significantly less favorable than when buying equities when the earnings yield of the S&P 500 is higher than the yield of BAA bond yields.
Although the timing is uncertain, we are confident that volatility will re-assert itself over the next year.
We would characterize today’s market as a pile of twigs waiting for a match or a balloon in search of a pin.
In our view, the match or the pin could be delivered in the form of a) higher oil prices / inflation; b) higher 10-year yields; c) significant earnings miss (not necessarily from a US company); d) foreign currency volatility / imported crisis.
(Past performance is not indicative of future results. This is not a recommendation to buy or sell any security and is not investment advice. Please do your own due diligence).
4. Only 35% of S&P 500 Stocks Have Outperformed in 2024
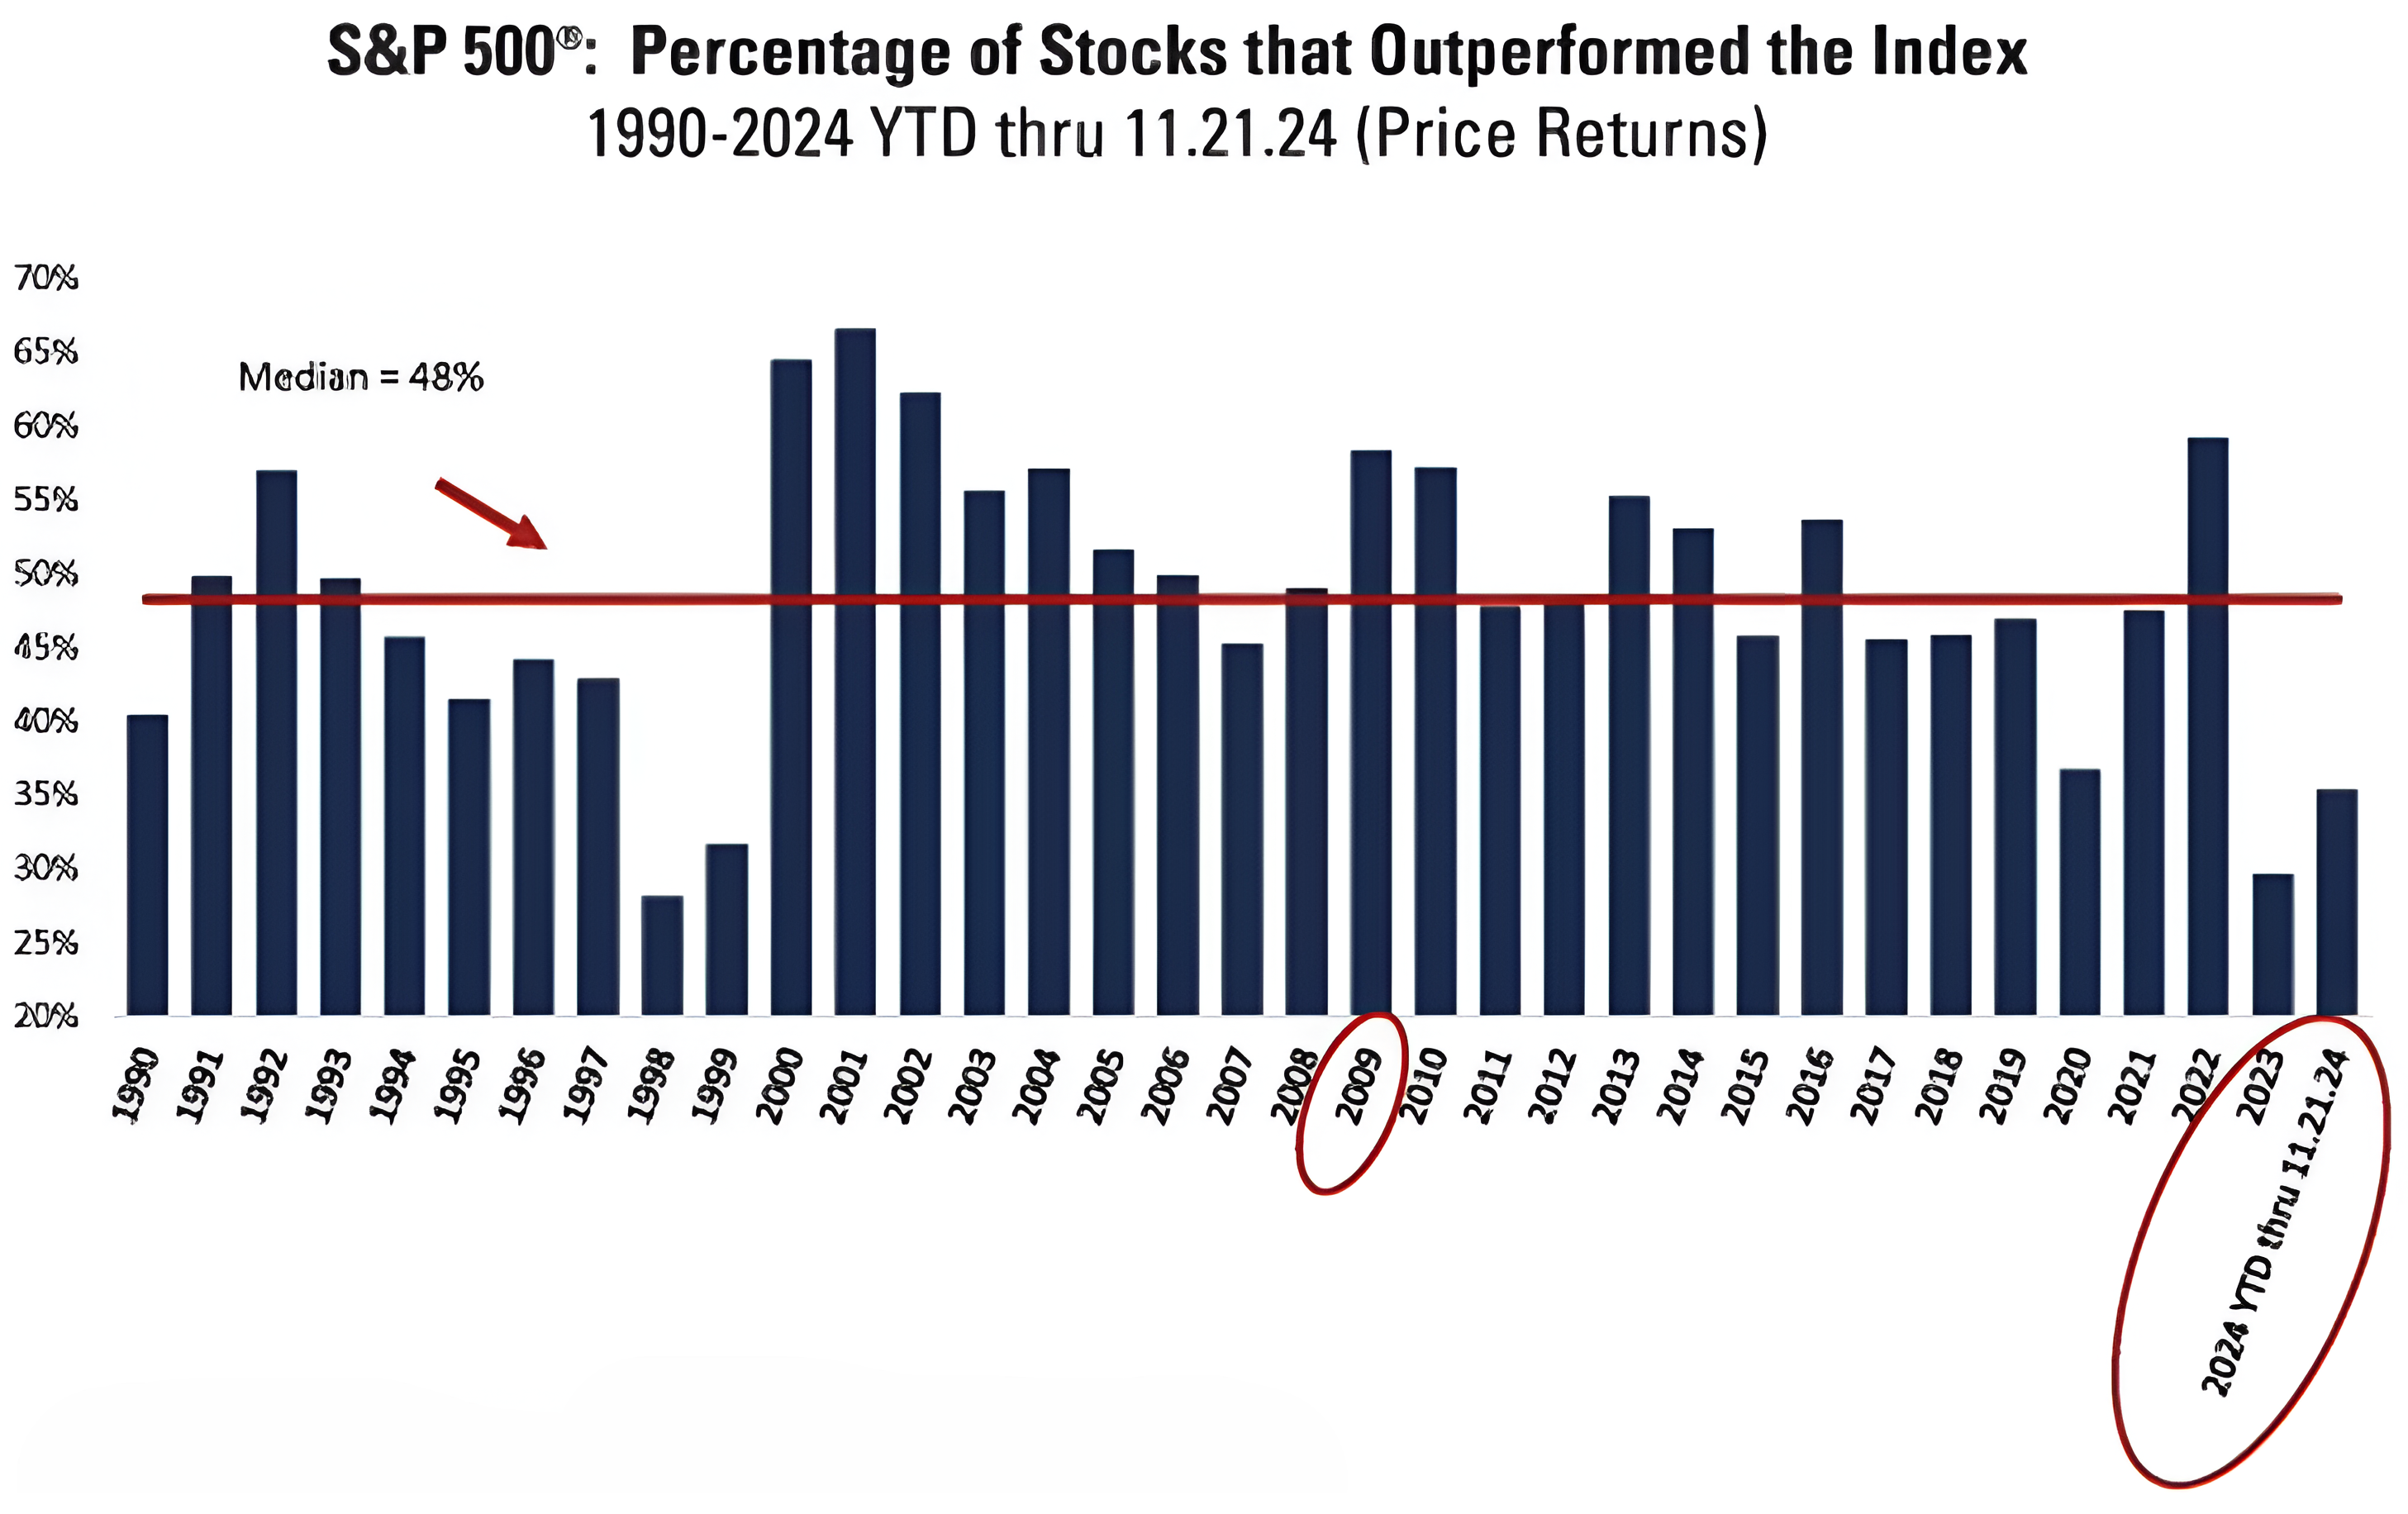
Source: Bernstein and Associates. Through year-to-date 2024.
The chart above shows the percentage of S&P 500 stocks that have outperformed the index each year since 1990.
The median has been 48%.
Interestingly, 2023 and 2024 have had the lowest percentage of shares since 1998 and 1999.
While 2000 (the beginning of the dot-com collapse) was a terrible year for the market, it was a great year for stock pickers as value and small-caps outperformed.
(Past performance is not indicative of future results. This is not a recommendation to buy or sell any security and is not investment advice. Please do your own due diligence).
5. Over 50 Record Highs this Year…What’s Next?

Source: Ned Davis Researh. Through year-to-date 2024.
The chart above shows the S&P 500 performance in the year following a year during which the index has achieved 50 or more new all-time highs.
Through November, the S&P 500 had hit 56 new all-time highs during 2024.
This was the 7th time in since 1928 (nearly 100 years) that index has experienced more than 50 new highs in a single year.
In the year following five of the seven previous times, the S&P 500 has had a negative return and the average return for all occurrences has been -3%.
(Past performance is not indicative of future results. This is not a recommendation to buy or sell any security and is not investment advice. Please do your own research and due diligence).