


Shake It Up!
What if Nvidia reported strong earnings and the stock sold off as the "internals" are challenging? Investors may be more concerned with the macro future than the micro past. Let's dig in...

Overnight, the American Association of Individual Investors % Bears came in at over 60% for the seventh time since 1987 and the CNN Fear / Greed Index entered the Extreme Fear zone.
Many have been very quick to characterize these readings as contrarian and, as a result see the negativity as a buying opportunity.
While these survey results have often been contrarian in the past, we had to wonder if this pavlovian buy whistle was really a reflection of negative sentiment? (Thus far we view is it as inconclusive - see chart 2).
As we’ve written for some time, US equities are expensive. On most measures, they are at top decile valuations.
While this is not a downside catalyst, it does, in our view constrain upside.
Why did US equities rally over 20% for the past two years to record highs and to valuations that are in the top 10% of US market history?
In our view, it was a combination of extreme fiscal stimulus combined with traditional and “stealth” monetary policy.
We provided a decent framework for this in the introduction here where we asked the question:
“In the absence of monetary and potentially fiscal support, can US equities maintain their historically high valuation levels?”
Both President Trump and Treasury Secretary Bessent have been very explicit they want the economy to wean off fiscal support in favor of non-government growth.
At the very least the fiscal austerity measures (DOGE) and the tax increases (tariffs), will likely lead to slower growth.
In a more challenging scenario, the baton handoff from the government to private sector will not be smooth and will lead to economic volatility.
Either way, if and when the analyst community begins to integrate these scenarios into their financial models, we will likely see earnings expectations further reduced.
In our view, the 8% drop in Nvidia’s share price today (chart 3) despite solid earnings may be a reflection that the “best” had been priced in, growth will slow and valuation, in those scenarios, is demanding.
We will see if this leads to broad equity market volatility.
As we have written: “if we were providing odds, we would favor a 10%+ sell-off prior to a 10%+ climb (65/35)” (introduction here).
Shake It Up!

1. Nasdaq 100 ETF: Setting Up a Date with $500?
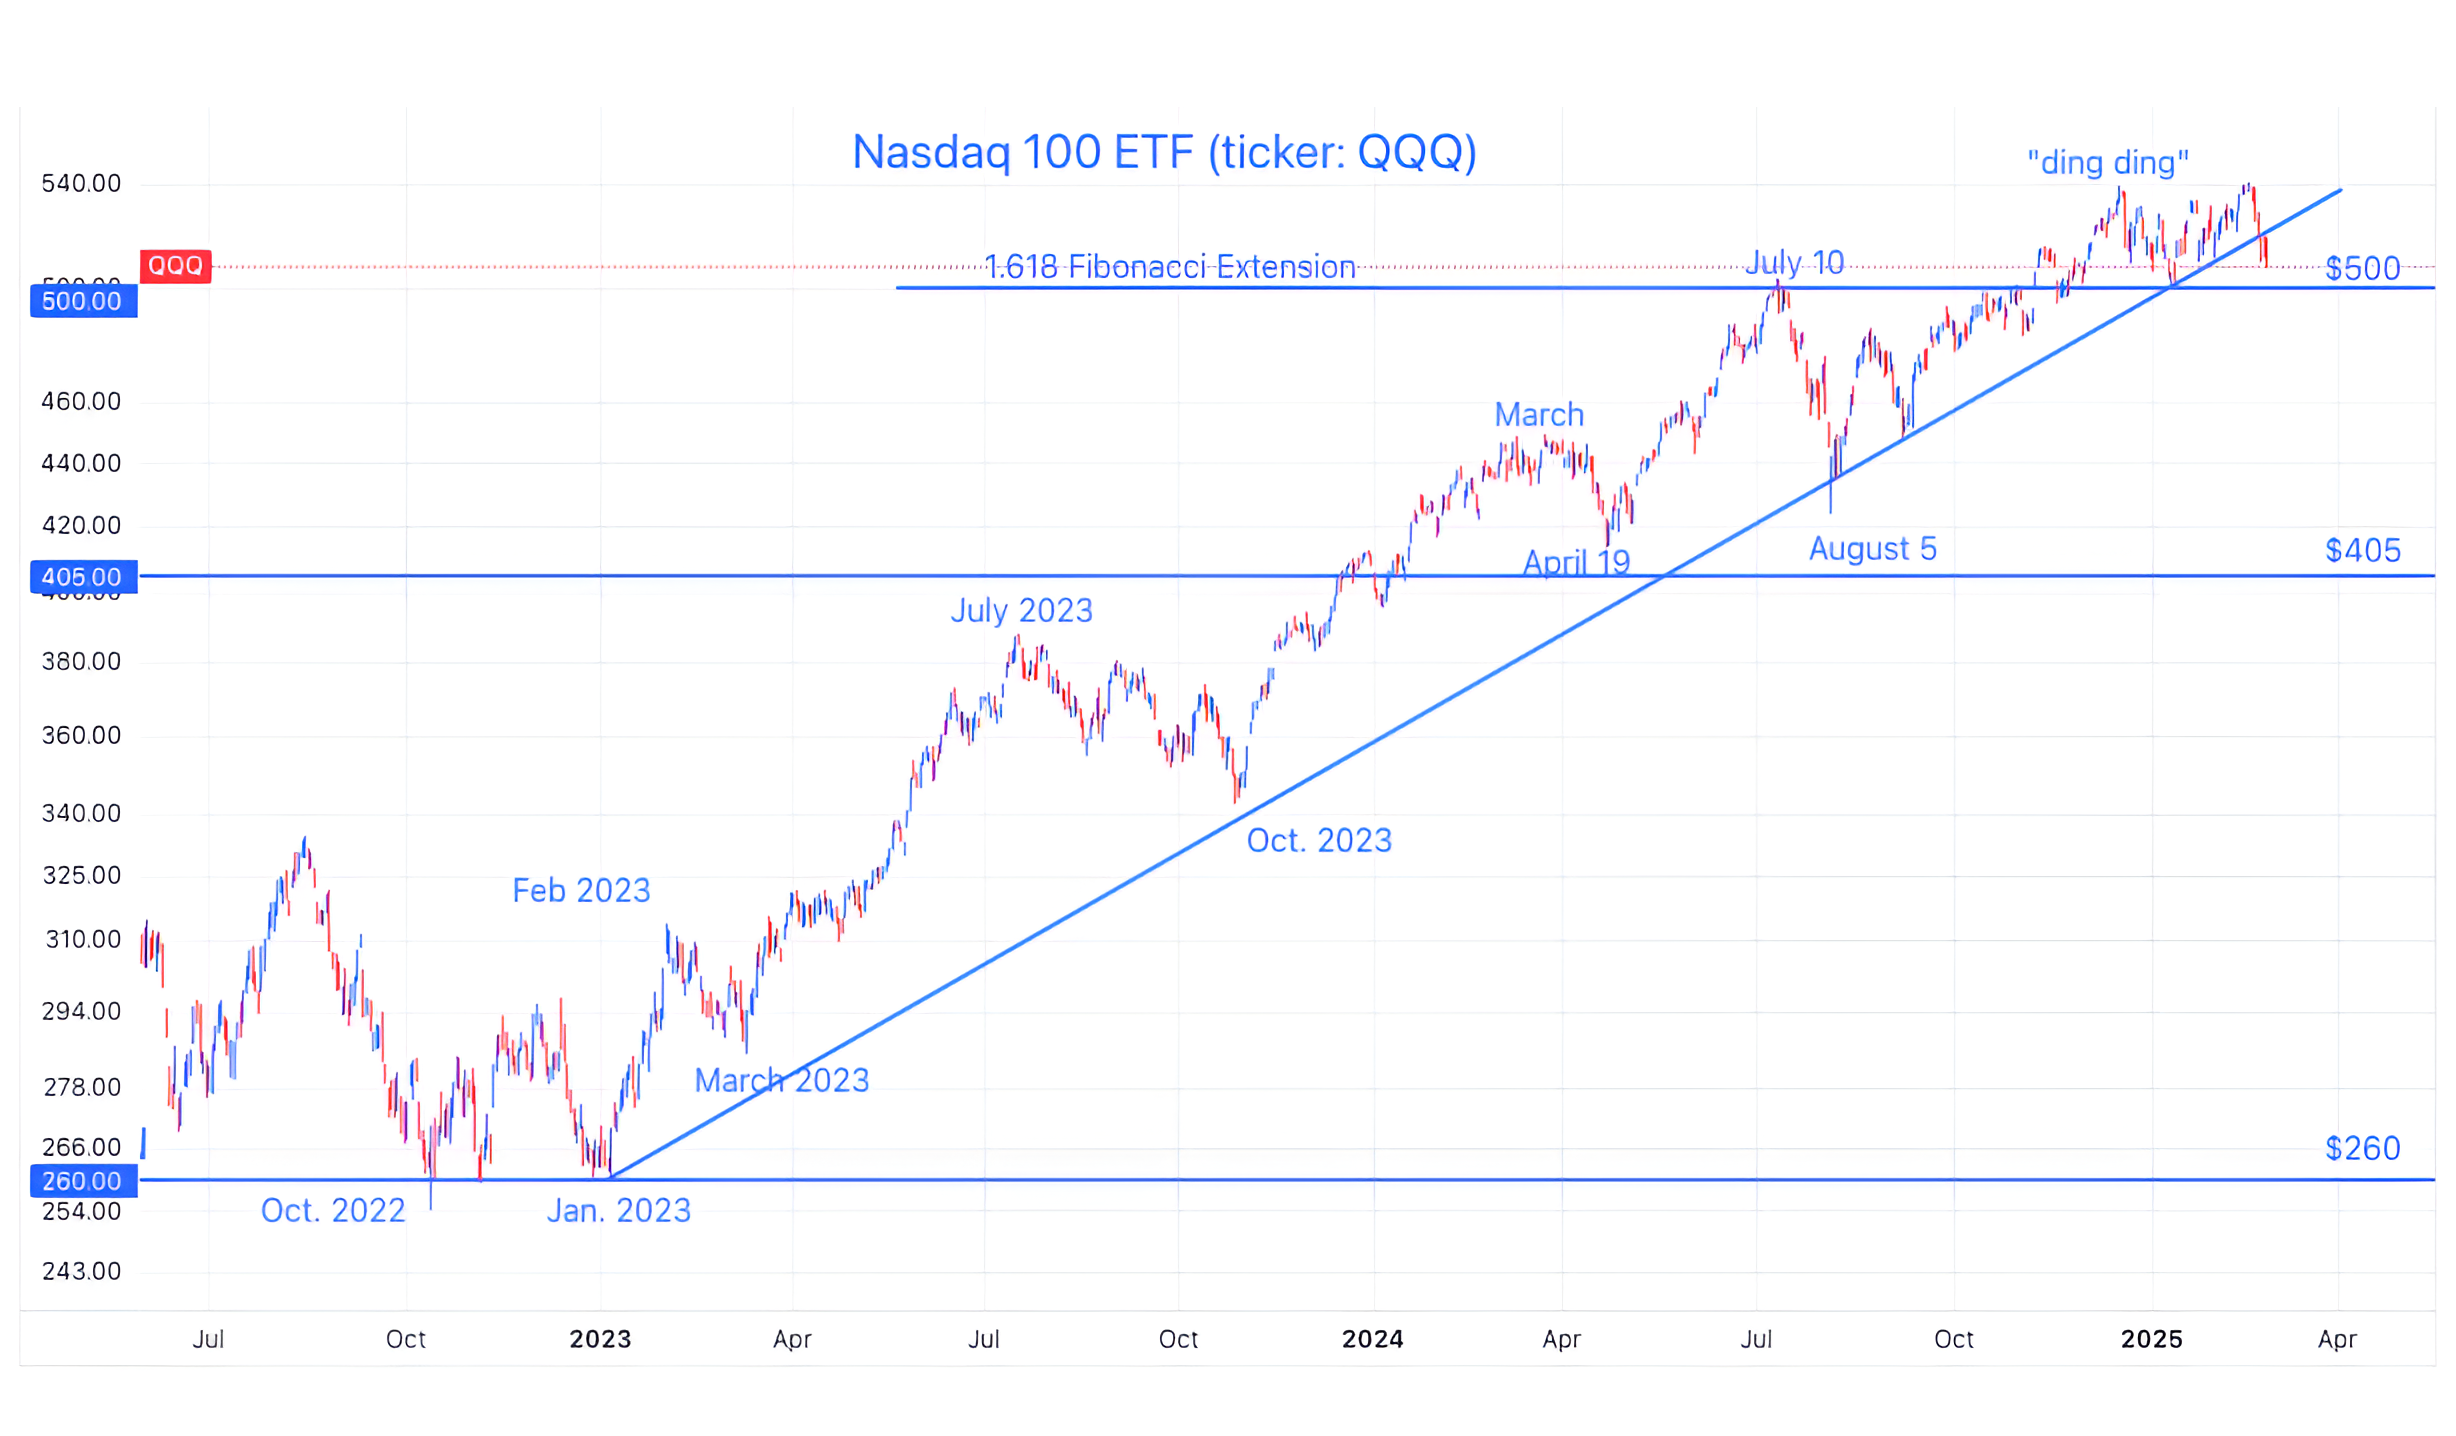
Source: TradingView. Through year-to-date 2025.
The chart above shows the Nasdaq 100 ETF (ticker: QQQ).
Over the past few weeks, we had remarked that we were impressed with the resilience of the Nasdaq 100 given the announcement of DeepSeak, tariffs and other uncertainties.
However, we have also acknowledged that it felt like the Nasdaq 100 (and S&P 500) was waiting for news to move decisively in either direction.
Although the Nasdaq 100, like the S&P 500, has broken its uptrend line this week, it still remains in its post-election trading range.
As we wrote three weeks ago (here):
“On the Nasdaq 100 ETF, we are focused on two levels: 500 (the post-election floor / 1.618 Fibonacci extension) and 538 (the post election high -(“ding ding” on the chart).
A convincing move above or below either of these, confirmed by other factors will have our attention.”
For the time being, despite trimming our equity exposure and buying puts and put spreads, we are remaining patient and trying not to overreact to a small correction.
(This is not a recommendation to buy or sell any security and is not investment advice. Past performance is not indicative of future results. Please do your own research and due diligence).
2. Sentiment: One of These Times is Not Like the Others
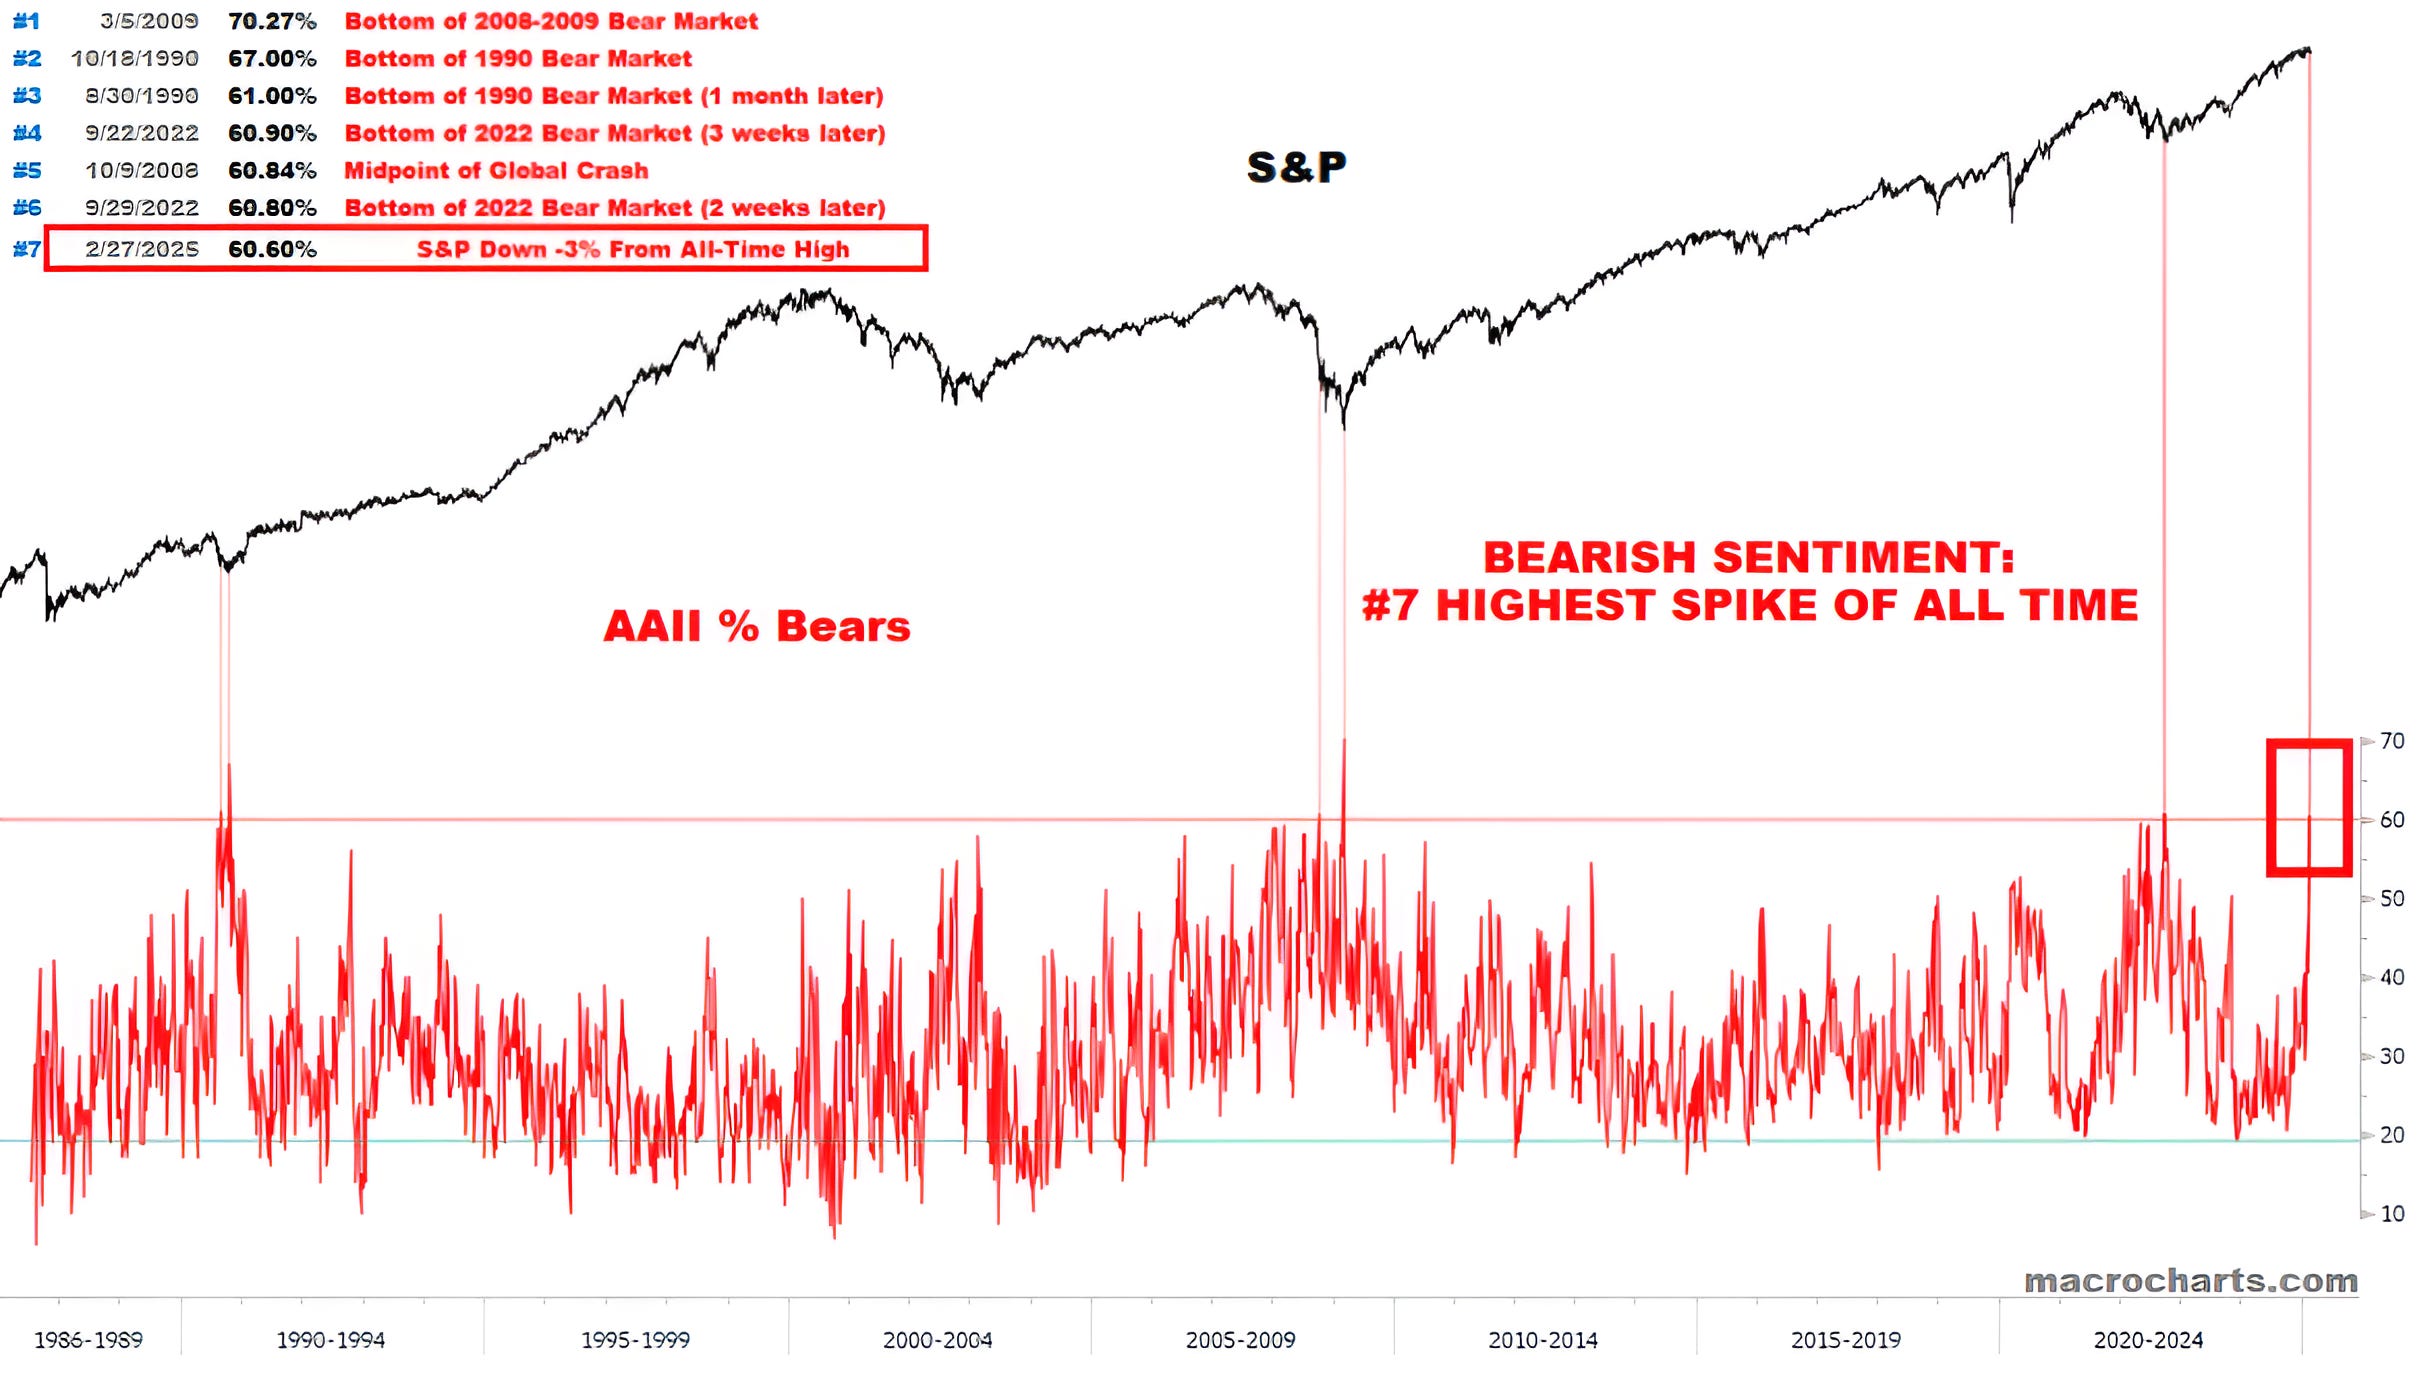
Source: Macrocharts / Bloomberg. Through year-to-date 2025.
The top panel of the chart above shows the S&P 500 and the bottom panel shows the American Association of Individual Investors (AAII) % Bears.
The AAII Bulls / Bears survey was released early this morning and showed that over 60% of Individual Investors had characterized themselves as “Bears.”
In the history of the survey (since 1987), the percent of Bears has only been above 60% six other times.
In past instances, the S&P 500 was an average of 27% below its highs. This is the first time that “60%+ Bears” has occurred with less than a 10% drawdown in the S&P 500.
Most importantly, prior “60%+ Bear” readings have been contrarian and have represented a sentiment “flush” as the readings have occurred near the cycle low.
With the S&P 500 3% from its all-time high, we can question whether the AAII Bearish reading will once again be near the cycle “low” and provide a contrarian “buy” opportunity.
Like most other indicators we follow, with sentiment, we like to look for supporting data.
While the CNN Fear / Greed Index is at an “Extreme Fear” reading, the put / call data, which we see as the key for confirmation, is not yet spiking in favor of puts.
Typically, it is the combination of sentiment, selling and hedging (puts) that creates a buyable bottom.
For now, the AAII Bearish % shows what investors are saying, but the selling, positioning and put buying does not yet confirm that they have acted on the view.
As a result, we are not “buyers” on the AAII Bearish % release, rather, as the Nasdaq 100 (above) and S&P 500 (chart 1 on Tuesday here) remain in their respective post election trading ranges, we remain “watchers.”
(Past performance is not indicative of further results. This is not a recommendation to buy or sell any security and is not investment advice. Please do your own due diligence).
3. Nvidia

Source: TradingView. Through year-to-date 2025.
The chart above shows Nvidia’s share price (ticker: NVDA) with its 200-day moving average (curved light blue line). (This is not a recommendation to buy or sell Nvidia shares).
We’ve shown and written about Nvidia several times. (Most recently, chart 2 here; chart 3 after Q2 earnings here; after Q1 earnings here; and in chart 2 here; here; and in February here).
While we expected further upside in Nvidia shares, in late November, we wrote:
“Our concern, as it is with any high growth story is when the growth begins to slow (2nd derivative), the multiple can compress quickly…we would be quick sellers on weakness.”
When I spoke to a hedge friend this morning about Nvidia’s earnings, they pointed out that while the company had exceeded revenue and earnings expectations, gross margins peaked at 79% in April last year and have been decelerating ever since. This quarter gross margins were 73.5% and Nvidia guided to 71.0% next quarter.
While the declining gross margins are challenging, the growth in accounts receivable was concerning.
In the fourth quarter revenue grew $4.2b (quarter over quarter) at the same time accounts receivable grew $5.4b. In other words, all of Nvidia’s revenue growth was in the form of receivables.
Furthermore, customers have been taking longer to pay. Accounts receivable days outstanding came in at 53 days vs. 35-40 over the last four quarters.
Essentially, Nvidia lowered margins and extended credit to make sales.
In the view of my hedge fund friend, this dynamic will set Nvidia up for an earnings miss over the next two quarters.
This is likely the foundation of the slowing growth scenario that I’ve been concerned about.
When looking at the chart, Nvidia closed today slightly below its 200-day moving average (curved blue line).
While shares can recover, the past two times that shares have dropped below their 200-day moving average convincingly, they have dropped another 50%.
(Past performance is not indicative of future results. This is not a recommendation to buy or sell any security and is not investment advice. Please do your own due diligence).
4. What Message is Oil Sending?
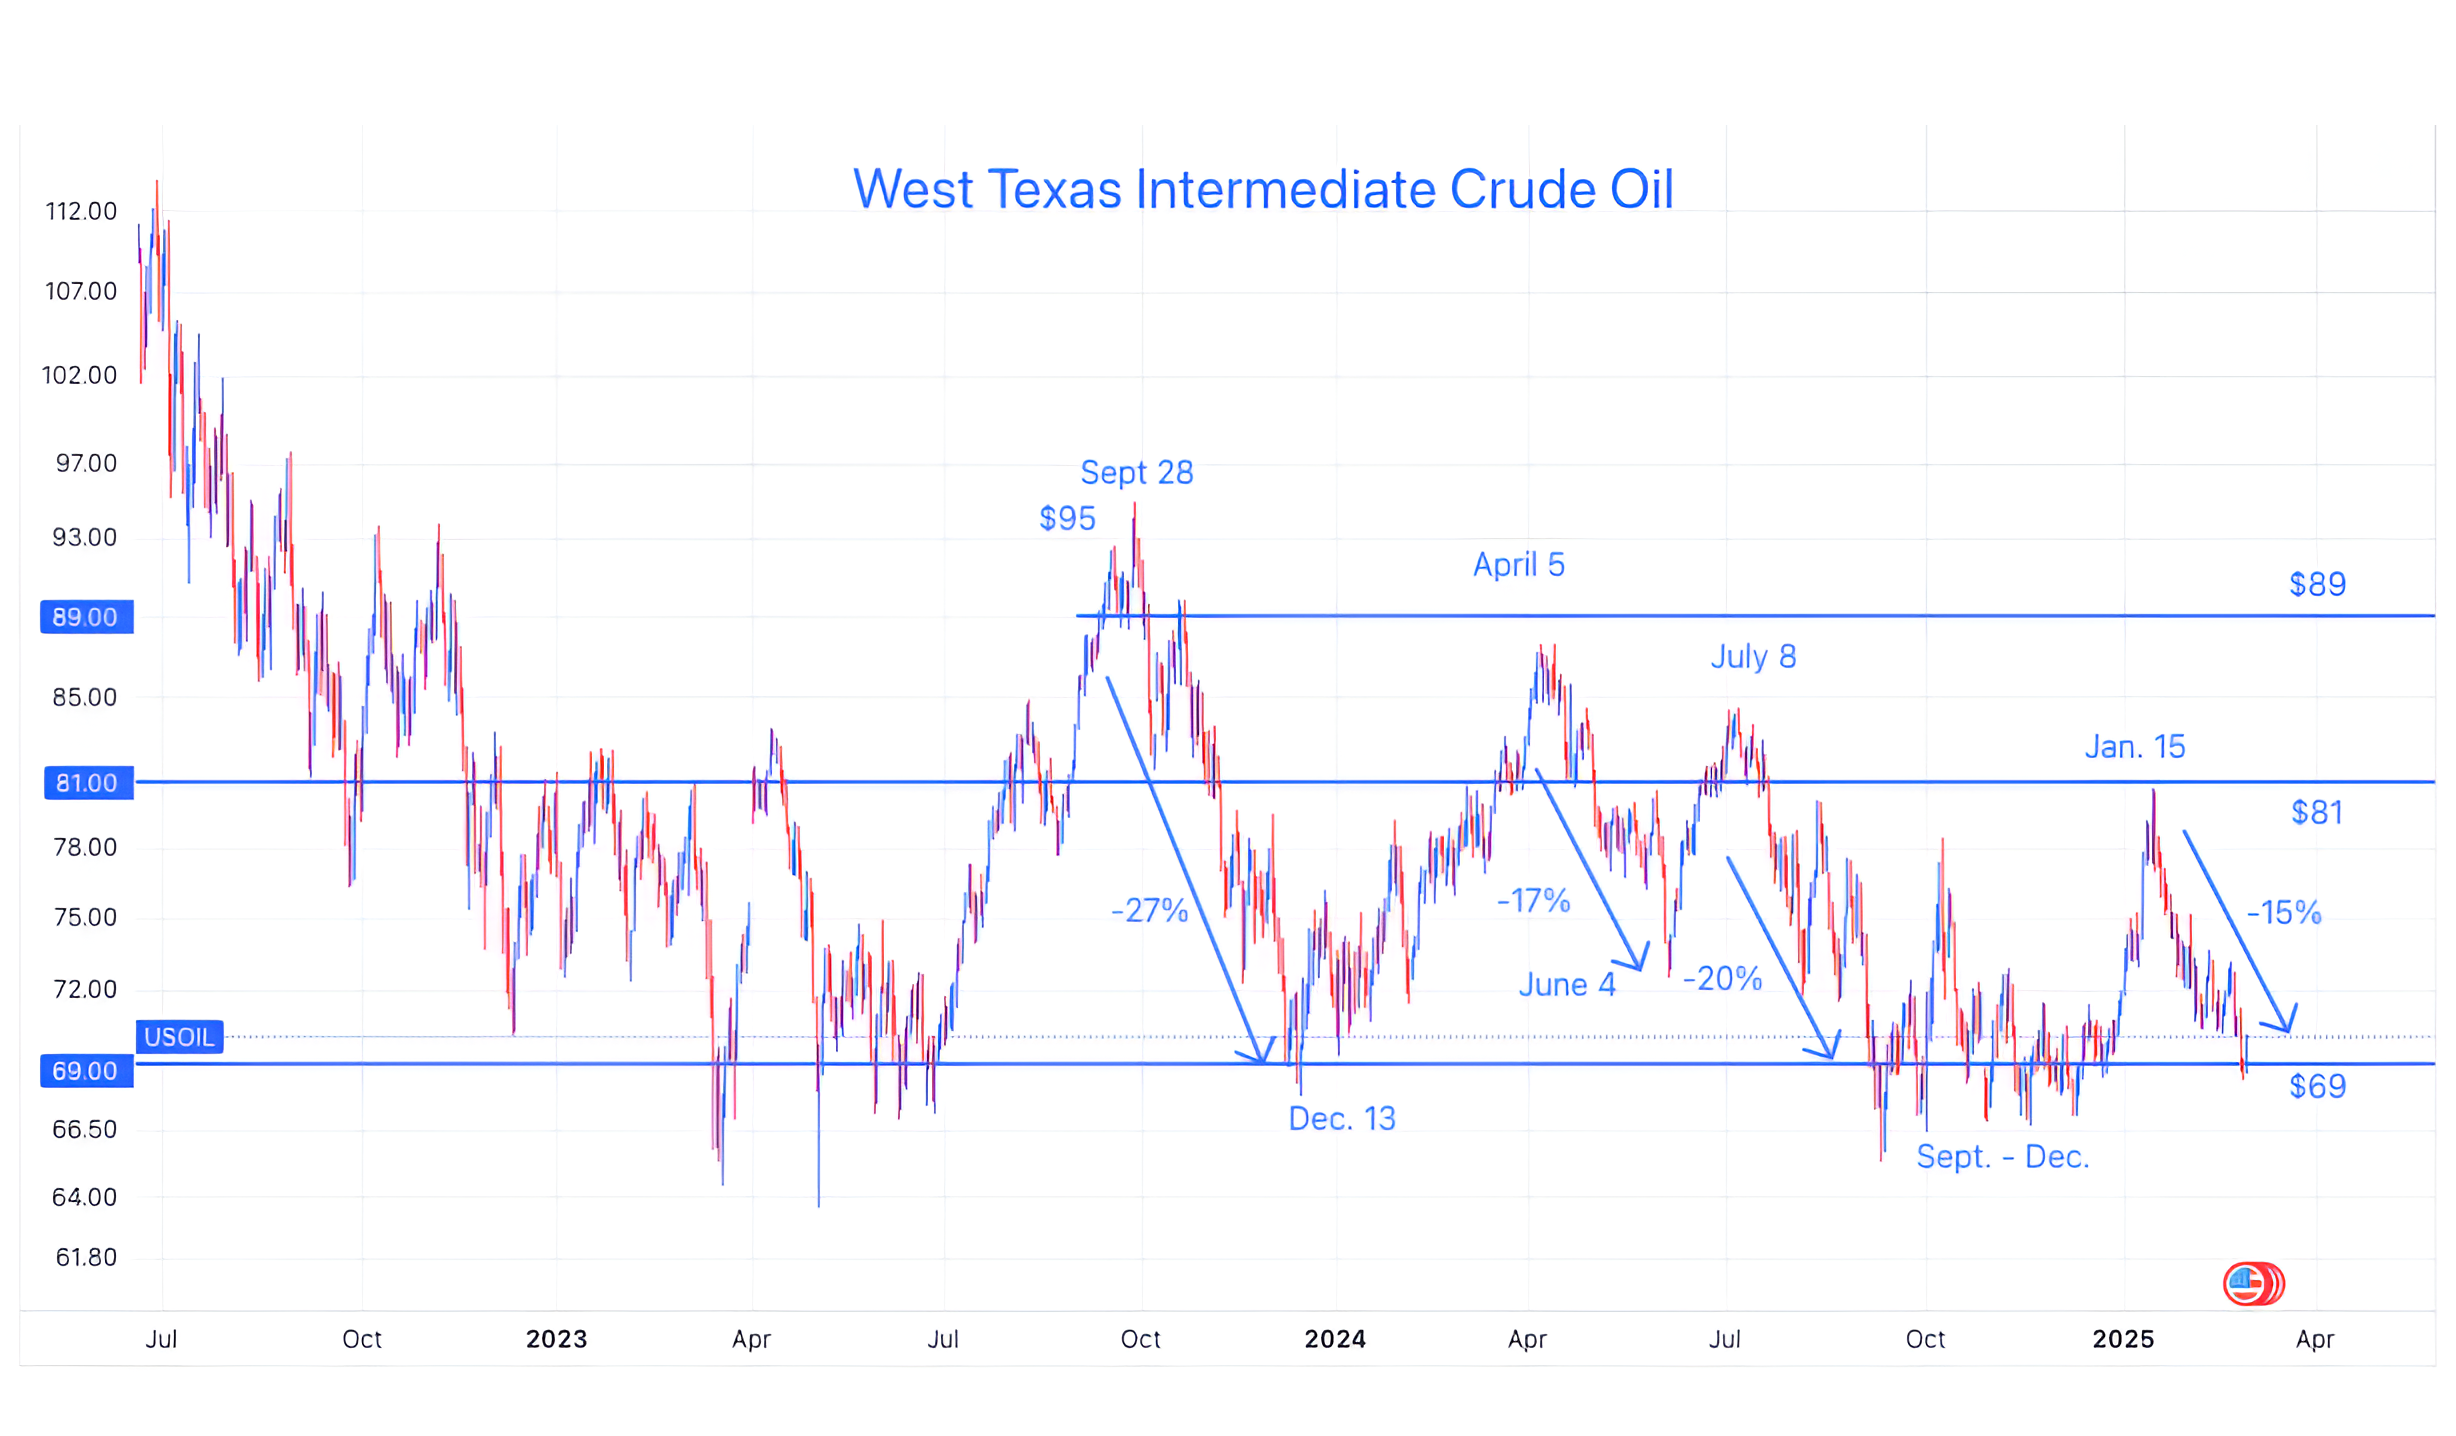
Source: TradingView. Through year-to-date 2025.
The chart above shows the price per barrel of West Texas Intermediate (WTI) crude oil.
We wrote about oil in our year-end note (chart 4 here) and headlined it with “Watching Oil in 2025.”
At the time, we obviously had no idea that the price of oil would climb 15% by mid-January and drop 15% by the end of February.
Rather than being concerned about the price per barrel of oil, we are questioning the message:
Is the drop in oil price a reflection that US growth is slowing?
Is it an indication that the end of the Ukraine war is near and that Trump will allow Russia’s oil to flow (with no restrictions)?
Is it saying that Trump will allow and promote drilling?
While we could ignore what oil is “saying” and just be thankful that the recent drop in the price of oil is disinflationary and may give the Fed options (despite the higher inflation expectations I showed on Tuesday), the answers to each of the questions above have different investment and policy implications.
We will watch to provide insights, for now, as oil is back at its two-year floor, we wouldn’t be surprised to see price stabilize and potentially bounce higher.
(Past performance is not indicative of future results. This is not a recommendation to buy or sell any security and is not investment advice. Please do your own research and due diligence).
5. Global Equities vs. US
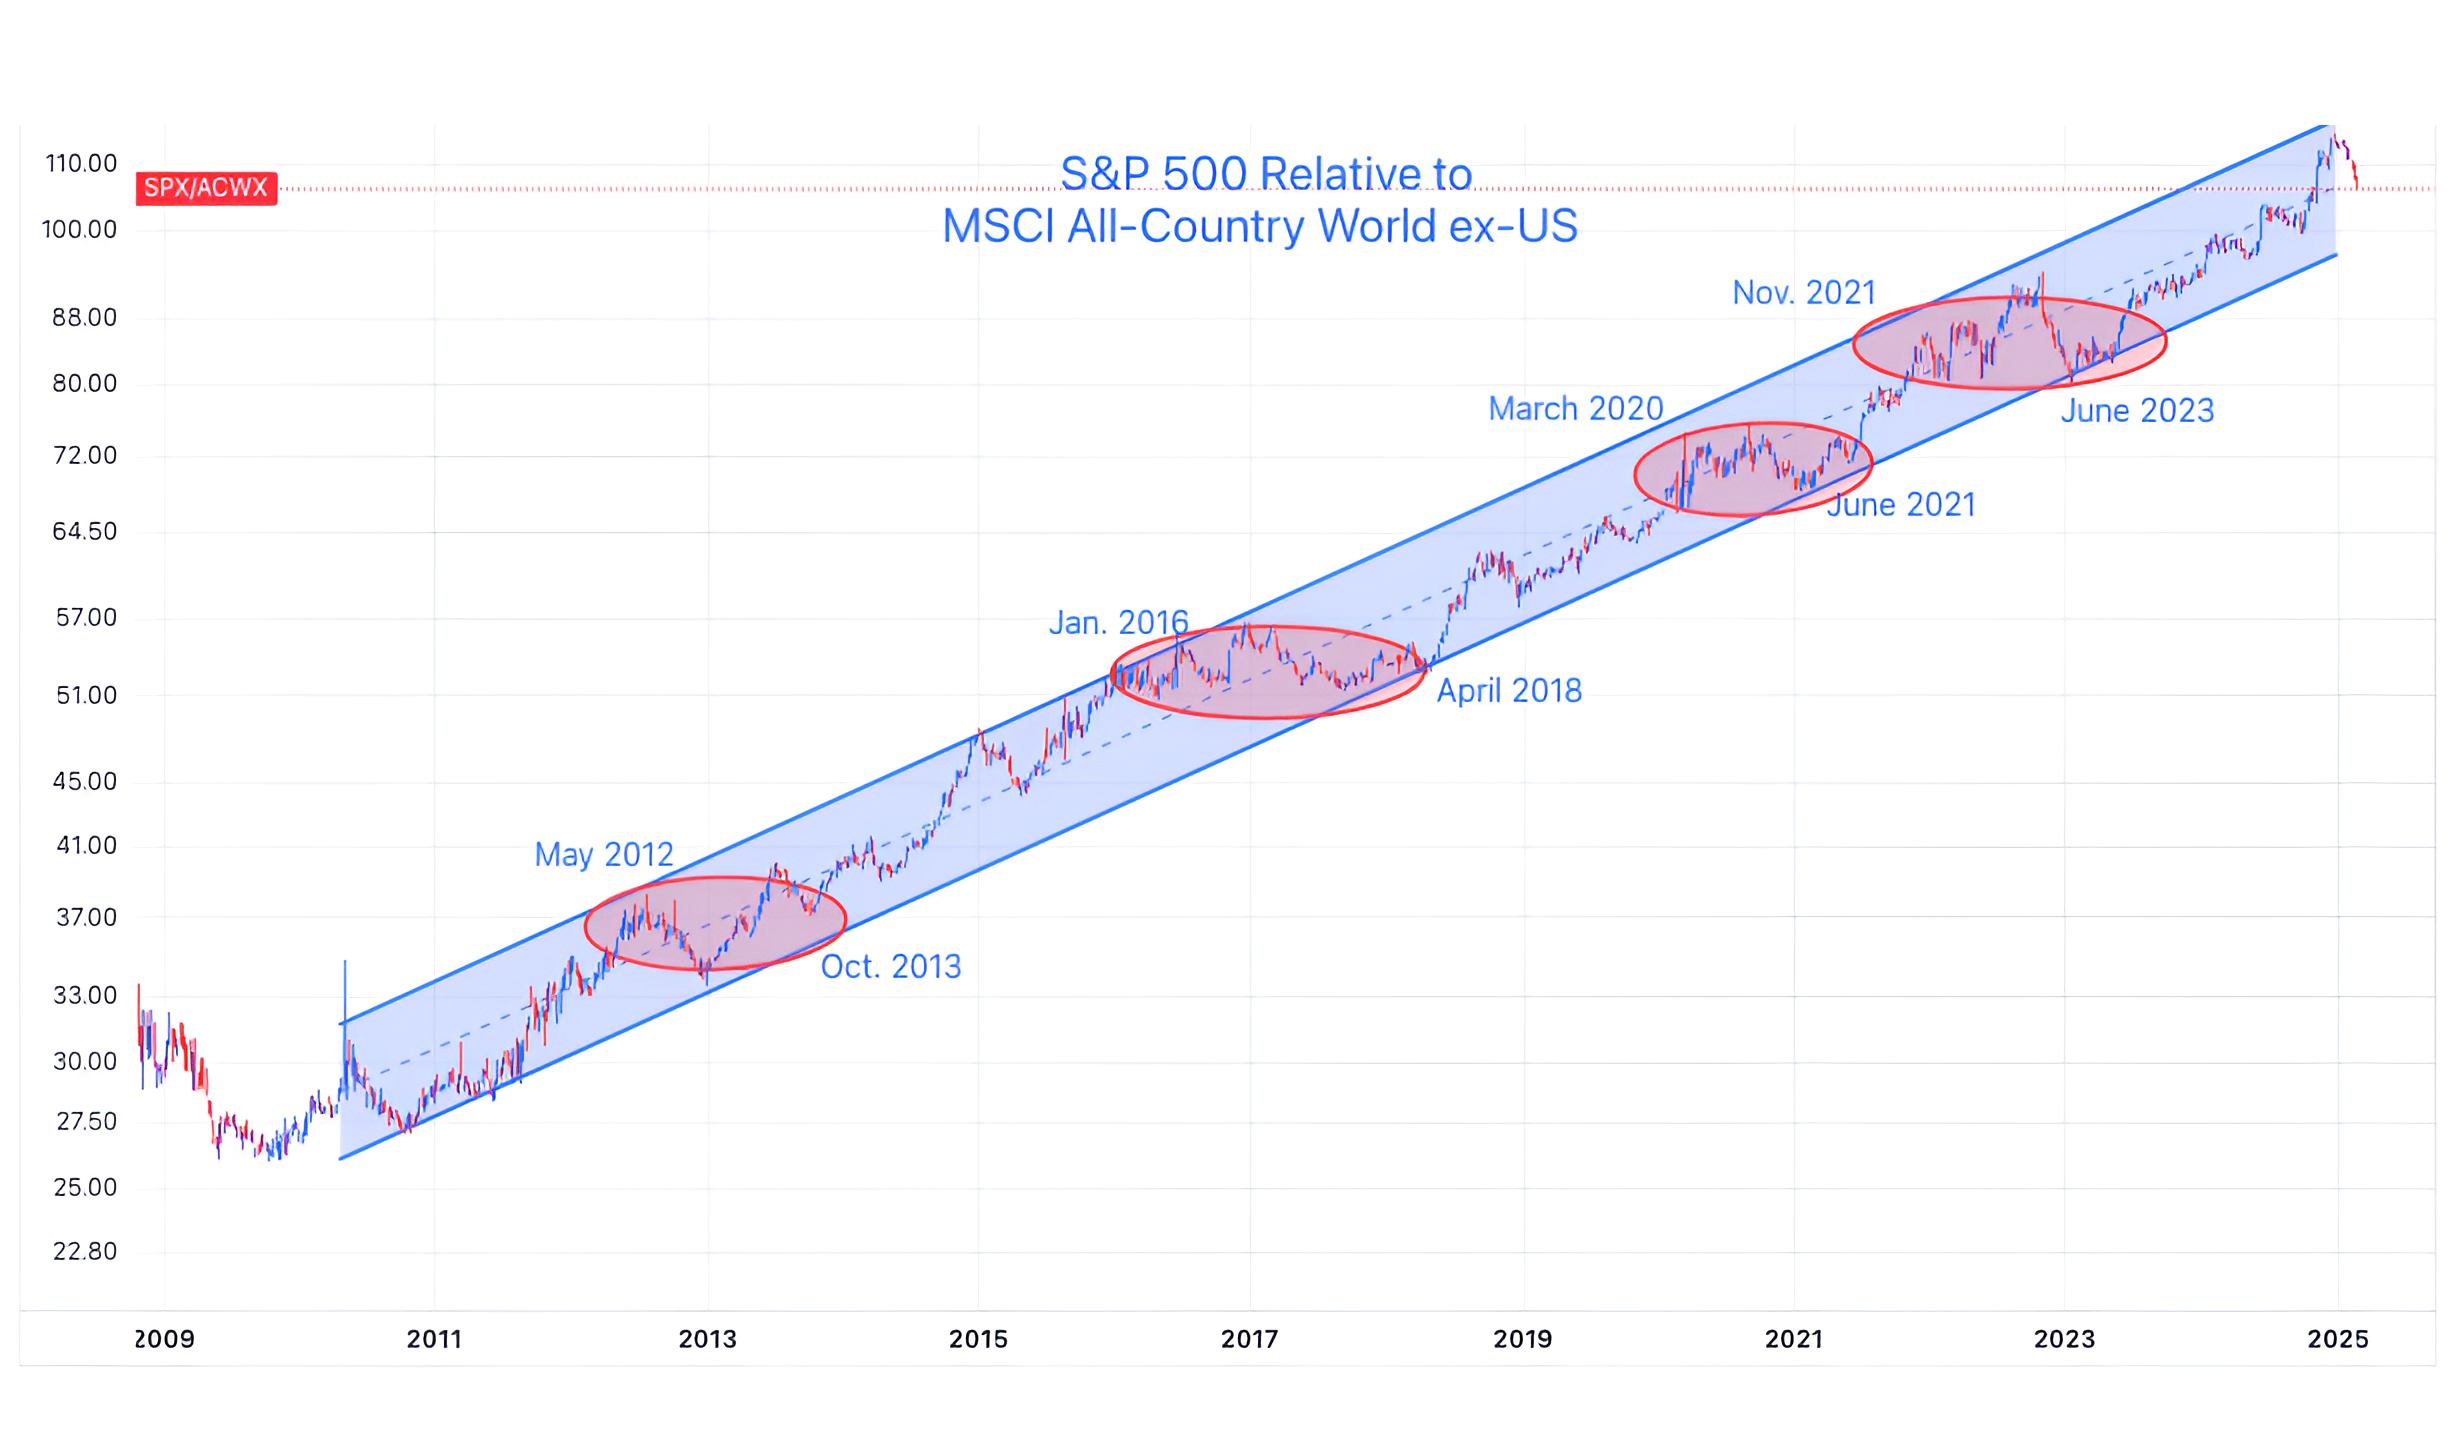
Source: TradingView. Through year-to-date 2025.
The chart above shows the S&P 500 relative to the MSCI All Country World ex-US from 2009.
We showed this chart in mid-December (here) and at the time wrote:
“With US equities near the top of their relative range, we would not be surprised to see a period of in-line performance.
However, we see no current reason to emphatically sell US equities in favor of non-US.”
Thus far in 2025, US equities have underperformed their Global counterparts, however, within the context of longer-term portfolios, we see this as a “sideways move” similar to the red ovals on the chart.
For more tactical investors, there may be non-US equity opportunities (perhaps China or Europe?) - but each needs to be evaluated on its own merits.
(Past performance is not indicative of future results. This is not a recommendation to buy or sell any security and is not investment advice. Please do your own research and due diligence).