


It's the End of the World as We Know It!
While somewhat hyperbole and somewhat true, when looking at the geopolitical construct, the economy and especially global markets, the character has changed. Let's dig in...

While we aim to avoid political topics, we recognize the influence of policy on markets.
As we entered 2025, one of our concerns was how markets would handle the transition from Treasury Secretary Yellen to Treasury Secretary Bessent (we highlighted this in the introduction here) and what we have characterized as the differing policy priorities of Trump 2.0 from those of the Biden administration.
In our view, the transition would (and will) be complicated and complications and uncertainty have often been expressed in markets through valuation contraction.
The combination of tariffs which are essentially a tax increase and DOGE which is essentially fiscal austerity (whether one agrees with it or not) will likely present a headwind to US economic growth.
This in turn may begin to impact future earnings expectations.
If the market considers this scenario, it will begin to price it in sooner rather than later.
In mid-November, we wrote:
“As we wrote in the introduction here, we see a 30% probability of a significant sell-off (probably around 20% down) in the first half of 2025. This would bring the S&P 500 from its recent peak of 6000 to a level below 5000.
We believe this volatility will be met with liquidity including some form of Quantitative Easing / Fed balance sheet expansion that will drive an equity recovery.”
While the market is clearly not in a significant sell-off mode, we found it notable that over the past week (in line with our views on stealth liquidity), that the Fed has begun to end Quantitative Tightening (“QT”).
In our view, the end of QT will allow the Fed to address any significant market volatility (and keep 10-Year Treasury yields “contained”) through Quantitative Easing (as we wrote three months ago) rather than through traditional rate hikes.
Although US equities remain 2-3% below all-time highs, the character of the market has changed. As we’ve written in the past, the 2025 market is not like the 2024 market.
With that as a backdrop, the markets resilience while trading at top decile multiples (across most metrics), in the wake of surprise tariffs and quickly changing policy has impressed us.
We always want to look under the surface of the headline indexes to determine if there are any market indicators that are signaling caution.
In our view, as we show below, some are, and, as a result, we have once again reduced our equity exposure.
As a reminder, at the beginning of the year (here), we reduced equities in most portfolios by 10-15%, yesterday we sold another 5% by doing some minimal trimming and taking gains.
To us, last Friday’s US equity market sell-off as the S&P 500 fell 1.7% and the Nasdaq 100 fell 2.2% seemed like a character change.
Was this just the 2nd half of February “seasonals” that we cited in chart 5 here asserting themselves?
Was this just a failure to surpass previous highs that will be challenged again after the market licks it wounds?
Was this simply in line with our view of: “if we were providing odds, we would favor a 10%+ sell-off prior to a 10%+ climb (65/35)” (introduction here)?
Was this the beginning of a more significant correction that we have been expecting since last June (an evolution of our thinking about this is in the introduction here)?
Was this the reflection of slowing US growth (slow retail sales, housing starts - chart 4, below) while acknowledging increasing inflation expectations (chart 5, below)?
Was this a reflection of…The End of the World as We Know It?
*Both the title and the picture below are more dire than our current thinking.

1. The S&P 500: This is Not 2024
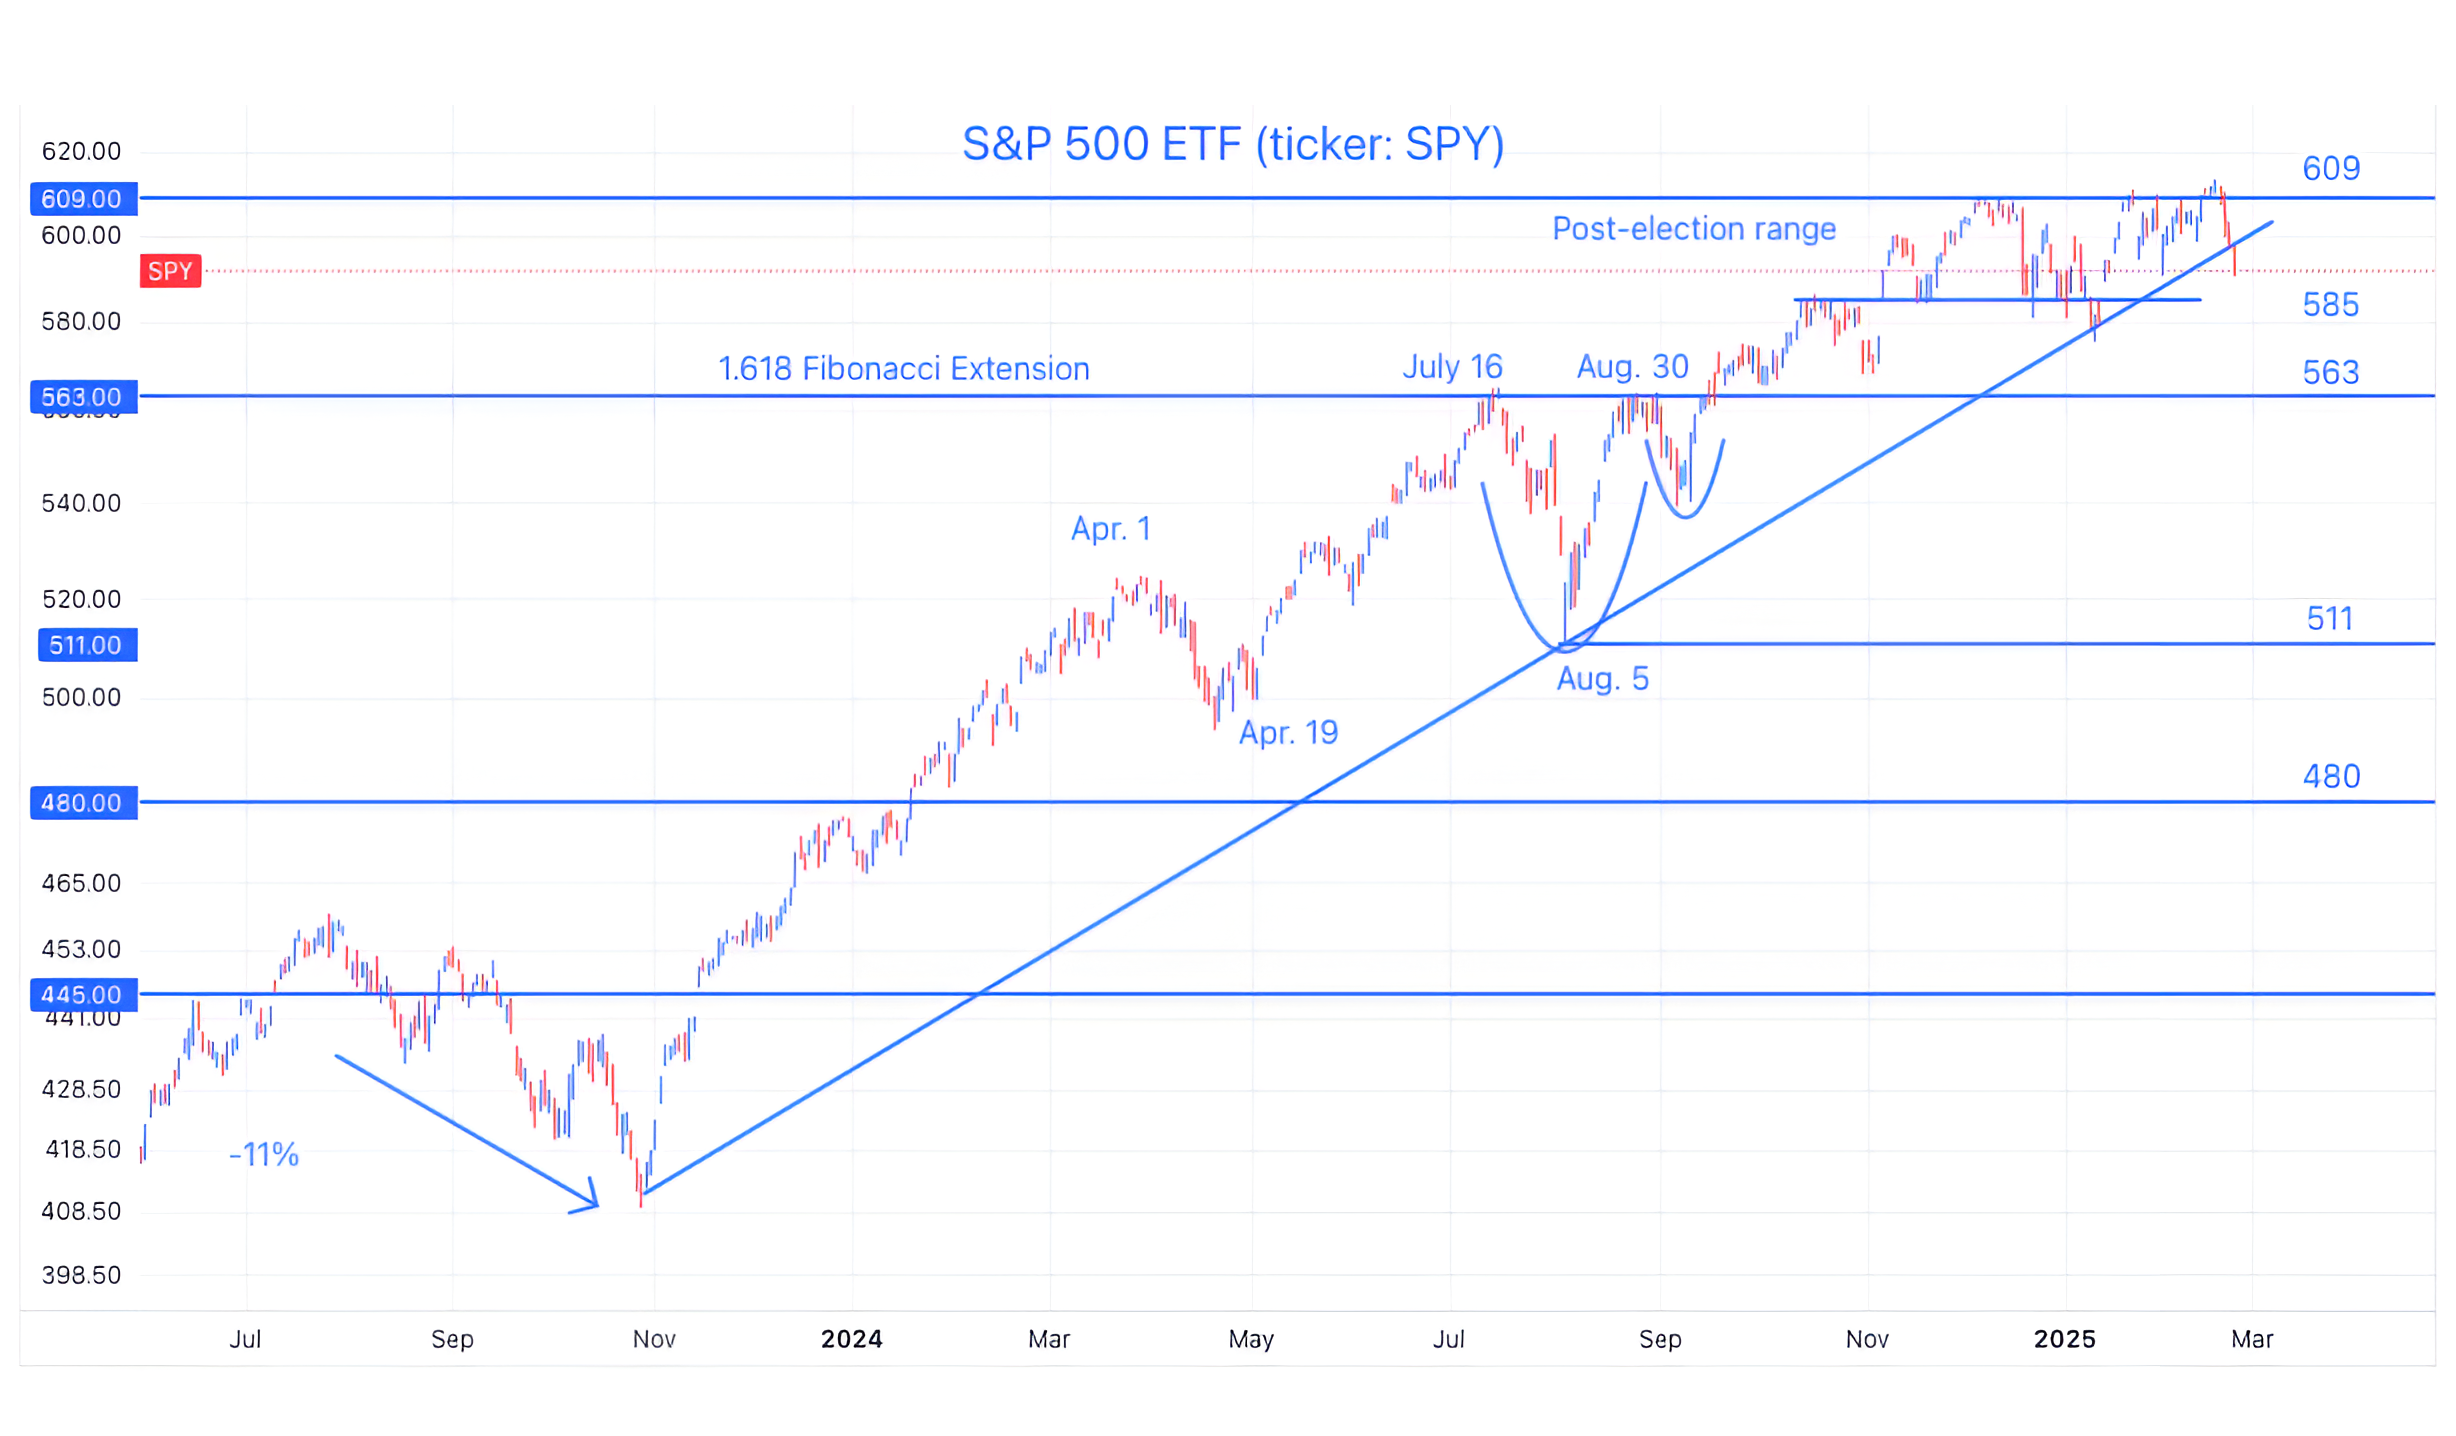
Source: TradingView. Through year-to-date 2025.
The chart above shows the S&P 500 ETF (ticker: SPY).
After peaking above the December high early last week, the S&P 500 has dropped 3.5% (as of the time of this writing).
If it closes at its current level, the Index will have broken the uptrend line that has been in place since late October 2023.
Similar to the horizontal lines that we draw in, with diagonal (uptrend lines) there is often a “re-test” from the underside that can provide some insight on the market’s strength.
What does this mean?
After the four-day sell-off and the break below the uptrend line, we wouldn’t be surprised to see a rally back to the underside of the line.
That will be the true test.
If the S&P 500 moves back up to the underside of the downtrend line (the 600 to 603 on the ETF / 6000 to 6030 on the S&P 500 index), we believe the reaction from there will provide true color on the markets character.
In the meantime, making a definitive call based on a subjective uptrend line is not something we’re willing to do.
Throughout 2024, we were disciplined in terms of holding our positions and hedging (through puts and put spreads) when conditions seemed stretched. This year, we have trimmed exposure in addition to hedging.
Different markets often require different attitudes and strategies.
Although the uptrend may be broken, it is important to acknowledge that the S&P 500 remains in its post-election range.
The ETF can continue to trade between 585 and 609 and buy time to digest the strong up move of the past two years.
As always, we will try to provide a range of indicators to develop a stronger view.
(This is not a recommendation to buy or sell any security and is not investment advice. Past performance is not indicative of future results. Please do your own research and due diligence).
2. Small Caps: Have We Seen this Movie Before?

Source: TradingView. Through year-to-date 2025.
The chart above shows the Russell 2000 Small Cap ETF (ticker: IWM).
The last time we showed this chart in early January (here), we acknowledged:
“Small Caps were not able to surpass their 2021 (post-covid) high and have lost all of their post-election gains.”
At this point, the recent action looks similar to the movement prior to the 2022 sell off:
The Small Cap ETF was trading in a range between $212 and $227.
It moved above the range and hit $244.
It quickly fell back into the $212 to $227 range.
In 2022, the Russell 2000 Small Cap ETF fell below $212 and continued falling to $162.
While we are not expecting a fall of a similar magnitude in the current period, holding the $212 level is clearly important.
Furthermore, as we always consider the Small Caps to be a reflection of overall economic health - we question what the Small Caps and their November 2024 peak may be saying about the 2025 domestic economy.
(Past performance is not indicative of further results. This is not a recommendation to buy or sell any security and is not investment advice. Please do your own due diligence).
3. Questions About the Consumer

Source: TradingView. Through year-to-date 2025.
The chart above shows the Consumer Discretionary ETF (ticker: XLY) relative to the Consumer Staples ETF (ticker: XLP).
We last showed this chart on February 4 (here) right after it had peaked.
At the time, we wrote:
“We love this intermarket relationship because it often foreshadows and confirms big turns in the broad markets.
Notice how this relationship peaked in November 2021, six weeks before the peak in the S&P 500.”
Needless to say, this relationship, which peaked in late January (what did it know?) doesn’t look good.
Is it once again foreshadowing broad market weakness?
While not conclusive, we need to acknowledge how both this chart and the Small Caps - with no overlap (these are all S&P 500 stocks) - both hit their November 2021 highs and reversed abruptly.
When combined with the Russell 2000 Small Caps, the weakness in the relationship between consumer discretionary and consumer staples warrants questions about the strength of the overall economy.
We begin to explore those below.
(Past performance is not indicative of future results. This is not a recommendation to buy or sell any security and is not investment advice. Please do your own due diligence).
4. Housing Starts: Flashing Yellow, Again

Source: Bespoke Investment Group. Through year-to-date 2025.
The chart above shows the rolling 12 month average of trailing US housing starts (blue line) and US recessions in grey.
While it looks somewhat dire that every US recession over the past 55 years (with the exception of the covid-recession) has been preceded by a decline in housing starts, there have been moves lower in housing starts that have not led to recessions (albeit none as large as the present one).
With that in mind, looking at previous years when housing starts dropped and no recession followed 1984, 1994, 1997 and 2018 - each experienced significant equity market volatility.
As most of the current decline in housing starts occurred in 2022 - concurrent with the increase in interest rates and the challenging market environment - perhaps we’ve seen the equity market volatility.
That said, looking closely at the chart, it seems that the decline in housing starts has resumed.
Combined with the weak retail sales report, the resumption of the softness in housing starts warrants our attention, and likely reflects a slowing economy.
At this point, however, it is is too early to conclude more than that.
(Past performance is not indicative of future results. This is not a recommendation to buy or sell any security and is not investment advice. Please do your own research and due diligence).
5. Inflation Expectations
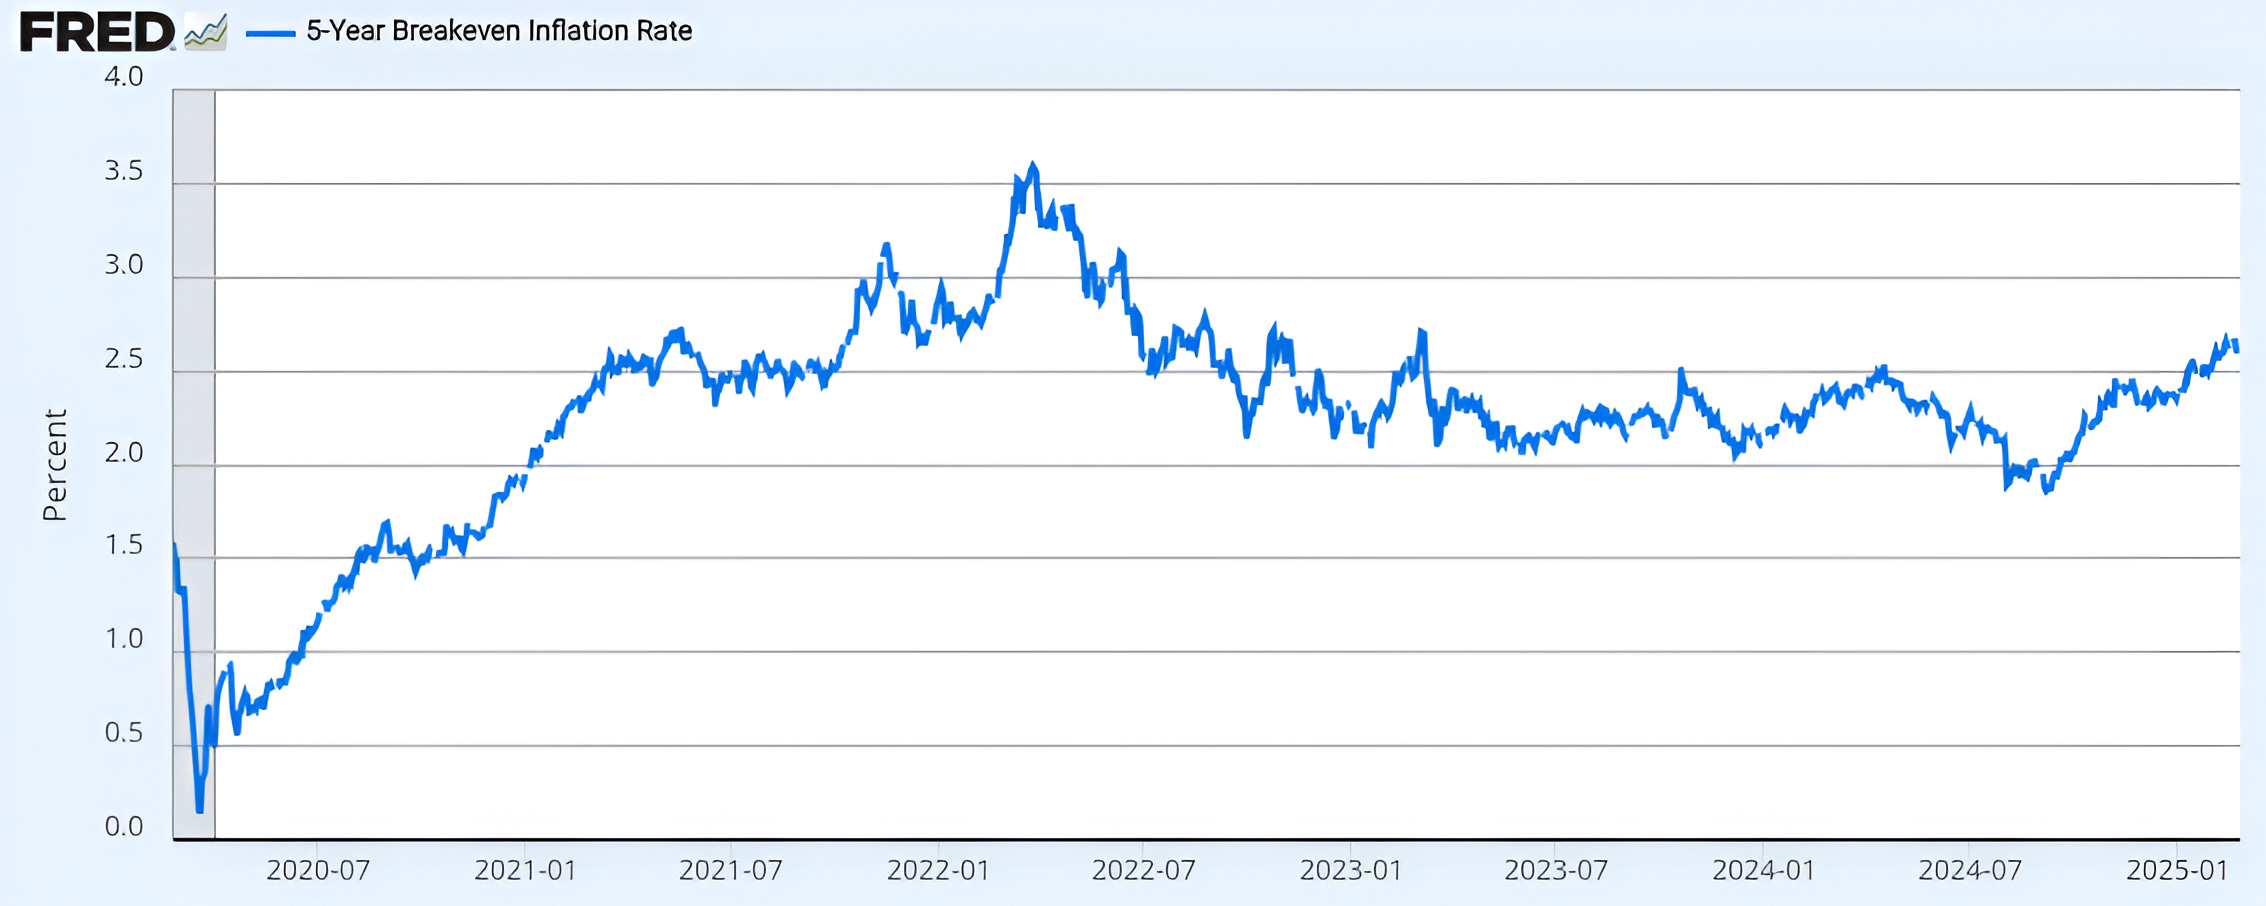
Source: Federal Reserve Bank of St. Louis via Fred. Through year-to-date 2025.
The chart above shows 5-Year Breakeven Inflation Rate.
The 5-Year Breakeven Inflation Rate is the market based rate of inflation expectations and is a measure of what investors expect inflation to be over the next five years.
As can be seen, inflation expectations have been moving higher since September 2024.
Furthermore, inflation expectations are now at their highest level since early 2023.
While 5-Year inflation expectations are only 2.6%, their peak was 3.6%, even as CPI was around 8.0% in 2022.
The point here is that if the 5-Year Breakeven Inflation Rate continues to move higher or remains near the same level, it might be a challenge for the Fed to cut rates aggressively if growth slows significantly.
(Past performance is not indicative of future results. This is not a recommendation to buy or sell any security and is not investment advice. Please do your own research and due diligence).