


How Will I Know?
Although we have noted our concern of a Q1 sell-off and "rang the bell" at the top on Dec. 17, US equities have bent but not broken. Is this a pause or a top? How will I know? Let's dig in...

Despite consistently highlighting our concerns around earnings expectations and valuations throughout 2024, we were careful to maintain full equity exposure throughout the year.
We expressed caution by buying puts and puts spreads in portfolios.
We view these option strategies like we view insurance on our home. We don’t hope for an insurable event, sometimes there’s a cost to the insurance, but if there’s an issue, the insurance can pay for itself and them some.
In our view, the character of the equity market has changed this year.
Whereas we viewed last year’s market as an “investing” market (maintain exposure), we view the market this year as a more tactical or trading market.
After expressing significant caution throughout 2024, on December 17 (here), we wrote: “While nobody rings a bell at the top…ding, ding.” Three weeks after that (nearly a month ago), we reduced equity exposure in our portfolios by 10-15% (introduction here).
Although the S&P 500 (chart 1, below) has gone nowhere over the past month, it has been faced with DeepSeek; corporate earnings (benign); the political transition; and a barrage of new policies and priorities. In the wake of these challenges, we have been impressed by the resilience in equity markets.
Something that we learned early on is that if the market or an asset does something you wouldn’t expect given the conditions, it’s important to pay attention.
Despite the factors mentioned above, US equities have not sold off in any meaningful way.
In an equity market that is trading at the top decile of most valuation metrics, we would typically expect the uncertainty that we’ve seen to be expressed through multiple contraction.
While we are “paying attention” as the market is speaking, there are some market watchers that believe tops are a process and bottoms are an event.
Are the past six weeks the beginning of the topping process or are they simply a pause after a significant ascent?
We are always transparent about what we’re watching and the signals that we view as the most important at any given time.
Below, we try to highlight some of what we’re watching.
That said, the cross currents of macro (combination of policy and liquidity) and micro (earnings, outlook and valuation) have rarely been more complicated.
Within that context, we continue to see the near-term (3-6 months) downside risk (10-20%) as greater than the upside potential (5-8%).
However, we are not religious in our view and index moves above or below different levels that are confirmed by inter-market relationships will help us answer if the sideways move over the past three months has been a pause that “refreshes” after a significant move higher or the beginning of a top.
“How Will I Know?”

1. The S&P 500: Indecision.

Source: TradingView. Through year-to-date 2025.
The chart above shows the S&P 500 ETF (ticker: SPY).
Very simply, since the election, the Index has been in a 4% trading range (essentially, above 585 on the chart above and above 5865 on the Index).
One characteristic to note is that the 200-day moving average is now at the 1.618 Fibonacci extension level of the 2022 sell-off at 563.
Since 1994, the S&P 500 has touched its 200-day moving average at least once in 87% of the calendar years.
The only years it did not were 2013, 2017, 2021, and 2024. Notice that over the past 30-years, the S&P 500 has not gone two consecutive years without hitting its 200-day moving average.
The likelihood, in our view, is that the S&P 500 will once again meet its 200-day moving average during 2025.
Will it do so while the 200-day moving at average is at or around its 1.618 Fibonacci extension level?
Obviously, we don’t know.
Something else that we’ve been considering:
When we wrote about the possibility of an island reversal pattern in the Nasdaq 100 last Thursday (here), we said that after the “exhaustion” gap that created the island, the reversal may “include several runaway gaps in the new direction.”
When US equity markets opened down over 1% yesterday, I thought about that description. Was that a run-away gap? We will watch for other potential runaway gaps.
For now, to determine market character, within the S&P 500 ETF we are focused on two levels: 609 and 585 (6100 and 5865 on the index).
A convincing move above or below either of these, confirmed by other factors will have our attention.
(This is not a recommendation to buy or sell any security and is not investment advice. Past performance is not indicative of future results. Please do your own research and due diligence).
2. The Dow Jones Industrials Index as a Signal
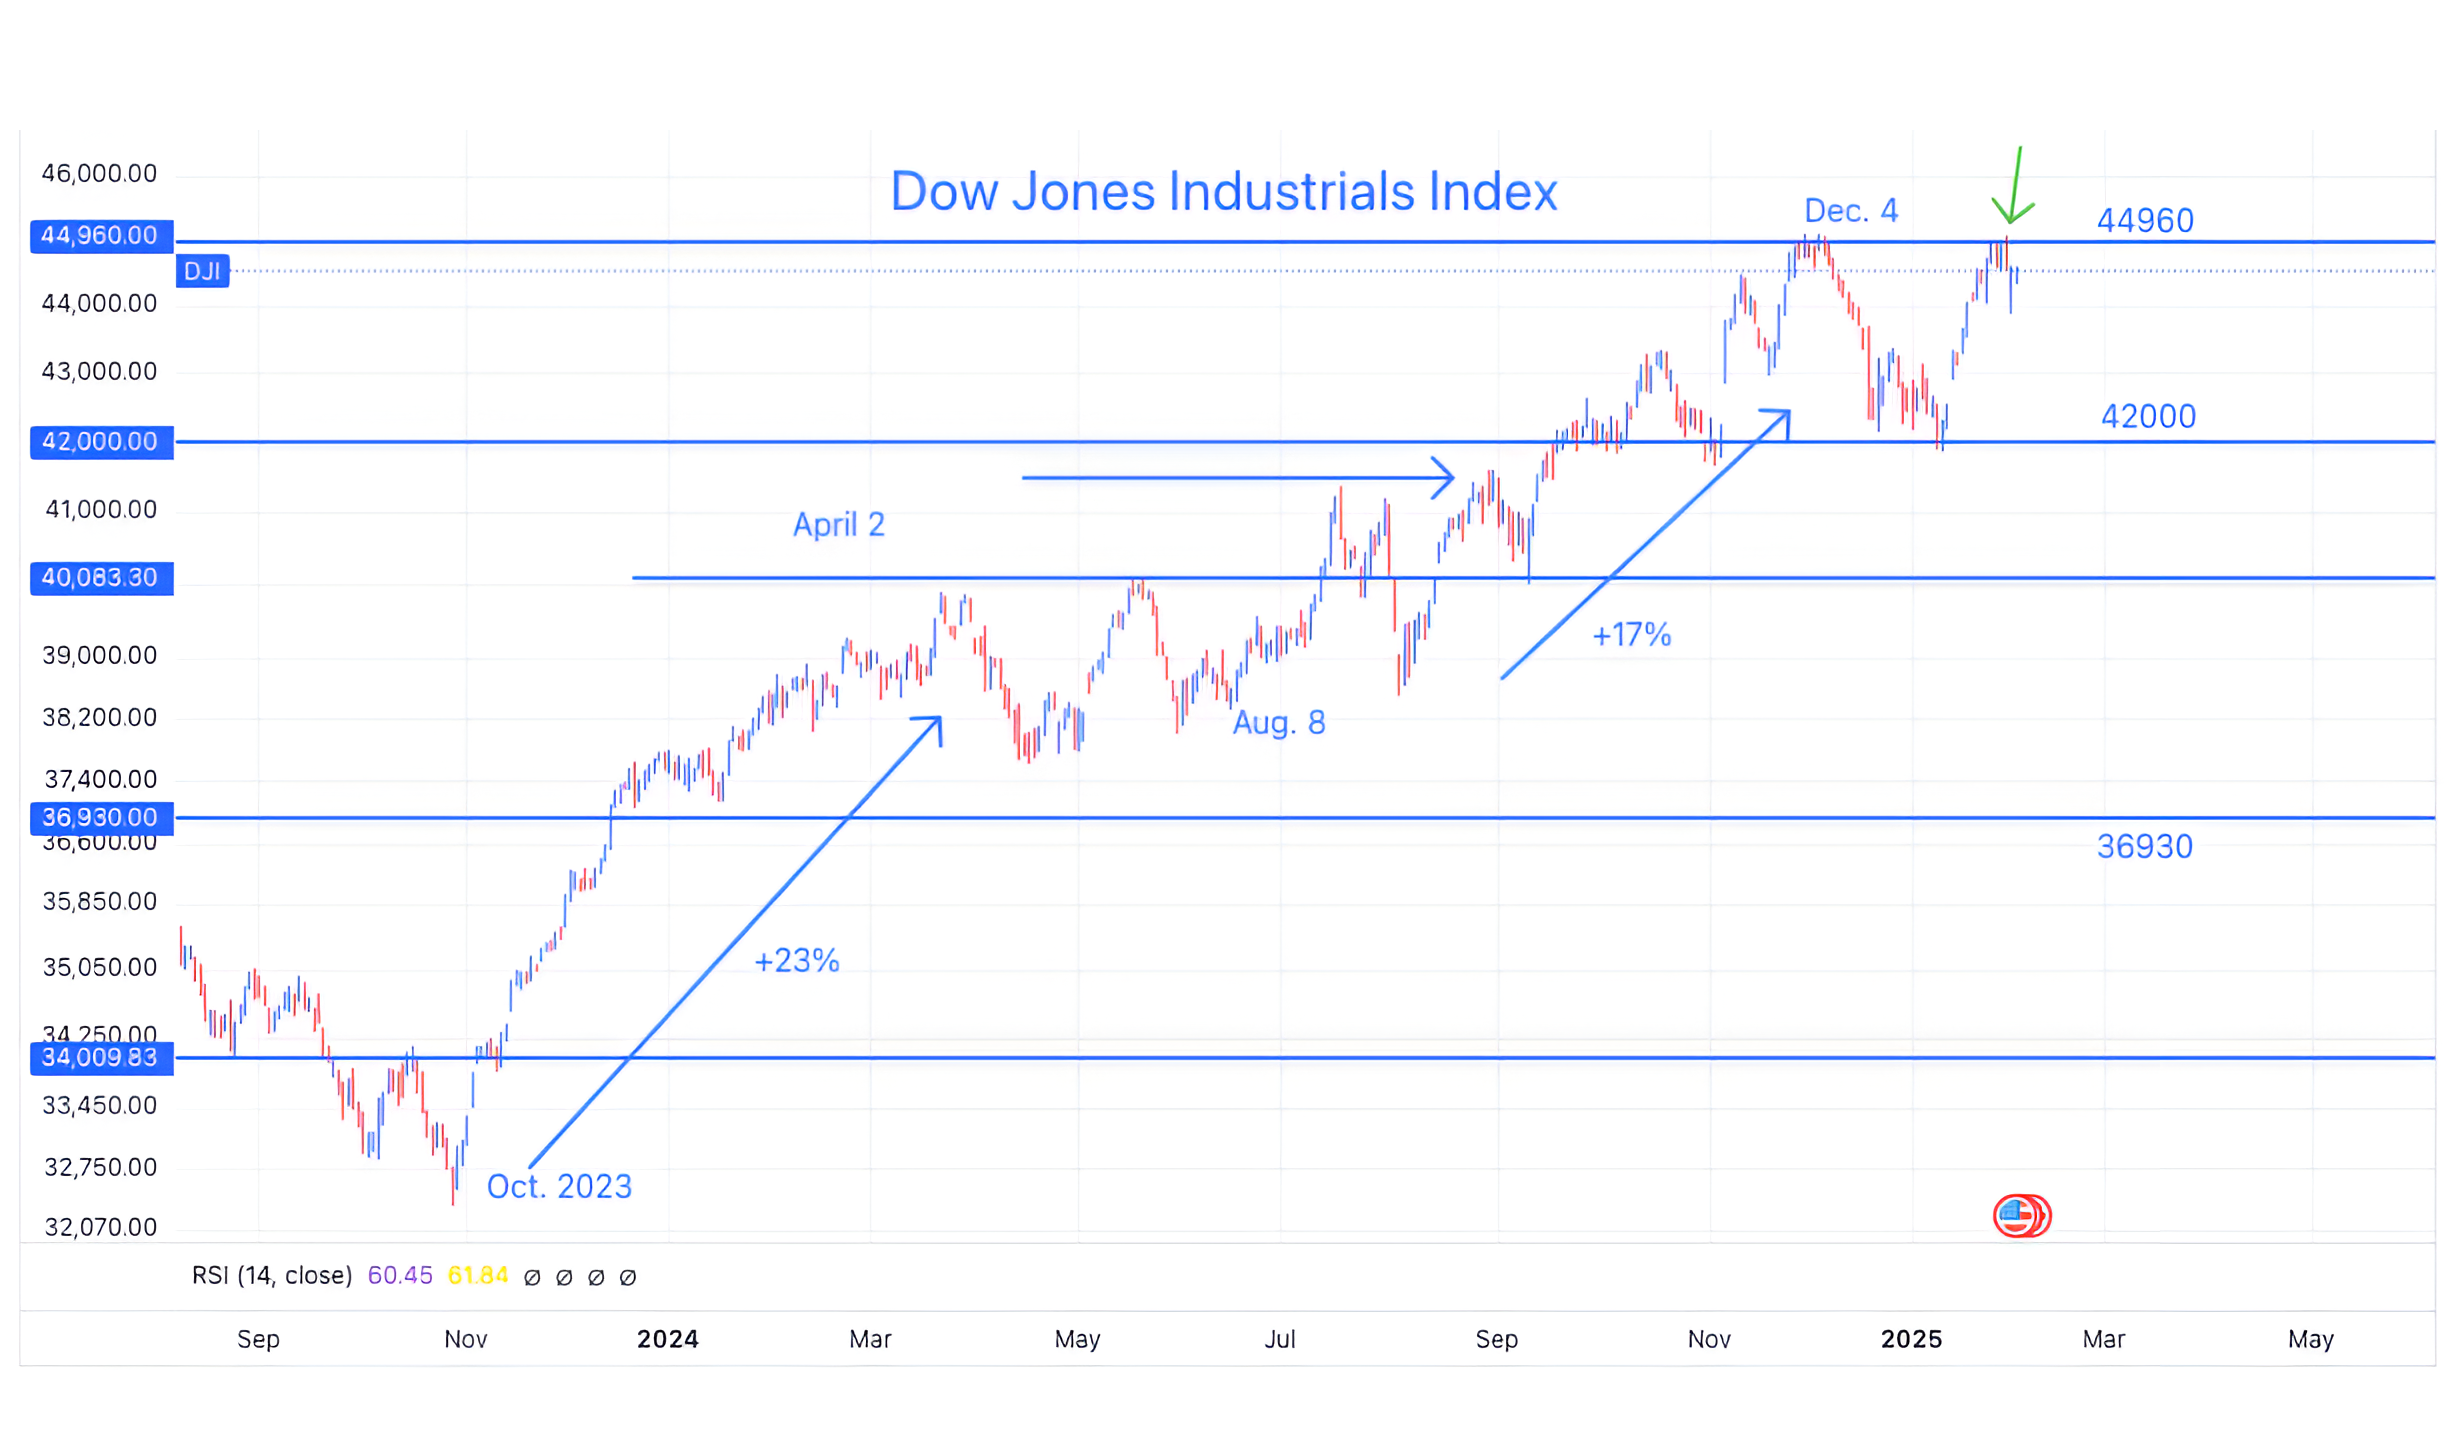
Source: TradingView. Through year-to-date 2025.
The chart above shows the Dow Industrials Index.
We showed this two weeks ago (here).
At the time, the Dow Industrials had jumped off of the 42,000 level and was heading towards its December high at 44960.
We wanted to see how the index reacted at that higher level.
While it’s been turned away, it is closer to its upper bound than the S&P 500.
If the Dow Industrials can convincingly move above its December high, we would consider this a bullish sign for the S&P 500 and likely either foreshadowing or confirming a move above the recent high.
One other characteristic to note: in the introduction, we question whether the recent sideways move in the major US indexes is simply a “pause that refreshes” in the midst of a continued ascent.
In the chart of the Dow Industrials Index, in the period between March and September 2024, there is a good example of a “pause that refreshes” or a sideways consolidation before the next move higher.
(Past performance is not indicative of further results. This is not a recommendation to buy or sell any security and is not investment advice. Please do your own due diligence).
3. 10 Year Treasury Yield

Source: TradingView. Through year to date 2025.
The chart above shows a short-term view of the 10-Year US Treasury Yield.
Whenever we consider market signals or confirmation, there is no other non-equity chart that we refer to more.
We last showed this chart two weeks ago here.
(Prior to that, we show it in: chart 3 here; chart 3 here; chart 4 here; here; in chart 5 here; in the introduction here; chart 2 here; and chart 2 here).
Two weeks ago, we drew in the possible bearish “head and shoulders” (the 3 arcs) on the chart.
If this pattern were to be confirmed, it would suggest a target of 4.20% (light blue dashed line on the chart).
However, we see the possibility of a move higher that would be similar to two characteristics that we’ve seen on the S&P 500 recently:
Many investors came into the year expecting 10-Year Treasury yields to continue there move higher. The move in yields from 4.8% to 4.5% could be similar to the S&P 500 move lower in December that reduced the bullishness in the index and set it up for a move higher.
We saw a failed bearish “head and shoulders” in the S&P 500. At the time, we noted “non-confirmed / failed “head and shoulders” patterns often reverse dramatically.” Could the same thing happen in 10-Year US Treasury yields? It’s too early to tell.
Both of these characteristics - if they were to resolve in the same way that they resolved in the S&P 500, would suggest higher 10-Year US Treasury yields.
If 10-Year US Treasury yields fall convincingly below 4.5%, in our view, this would be bullish for equities and confirm a move higher.
If 10-Year US Treasury yields bounce higher from current levels, this would be a headwind for equities.
(Past performance is not indicative of future results. This is not a recommendation to buy or sell any security and is not investment advice. Please do your own due diligence).
4. Consumer Staples vs. Consumer Discretionary
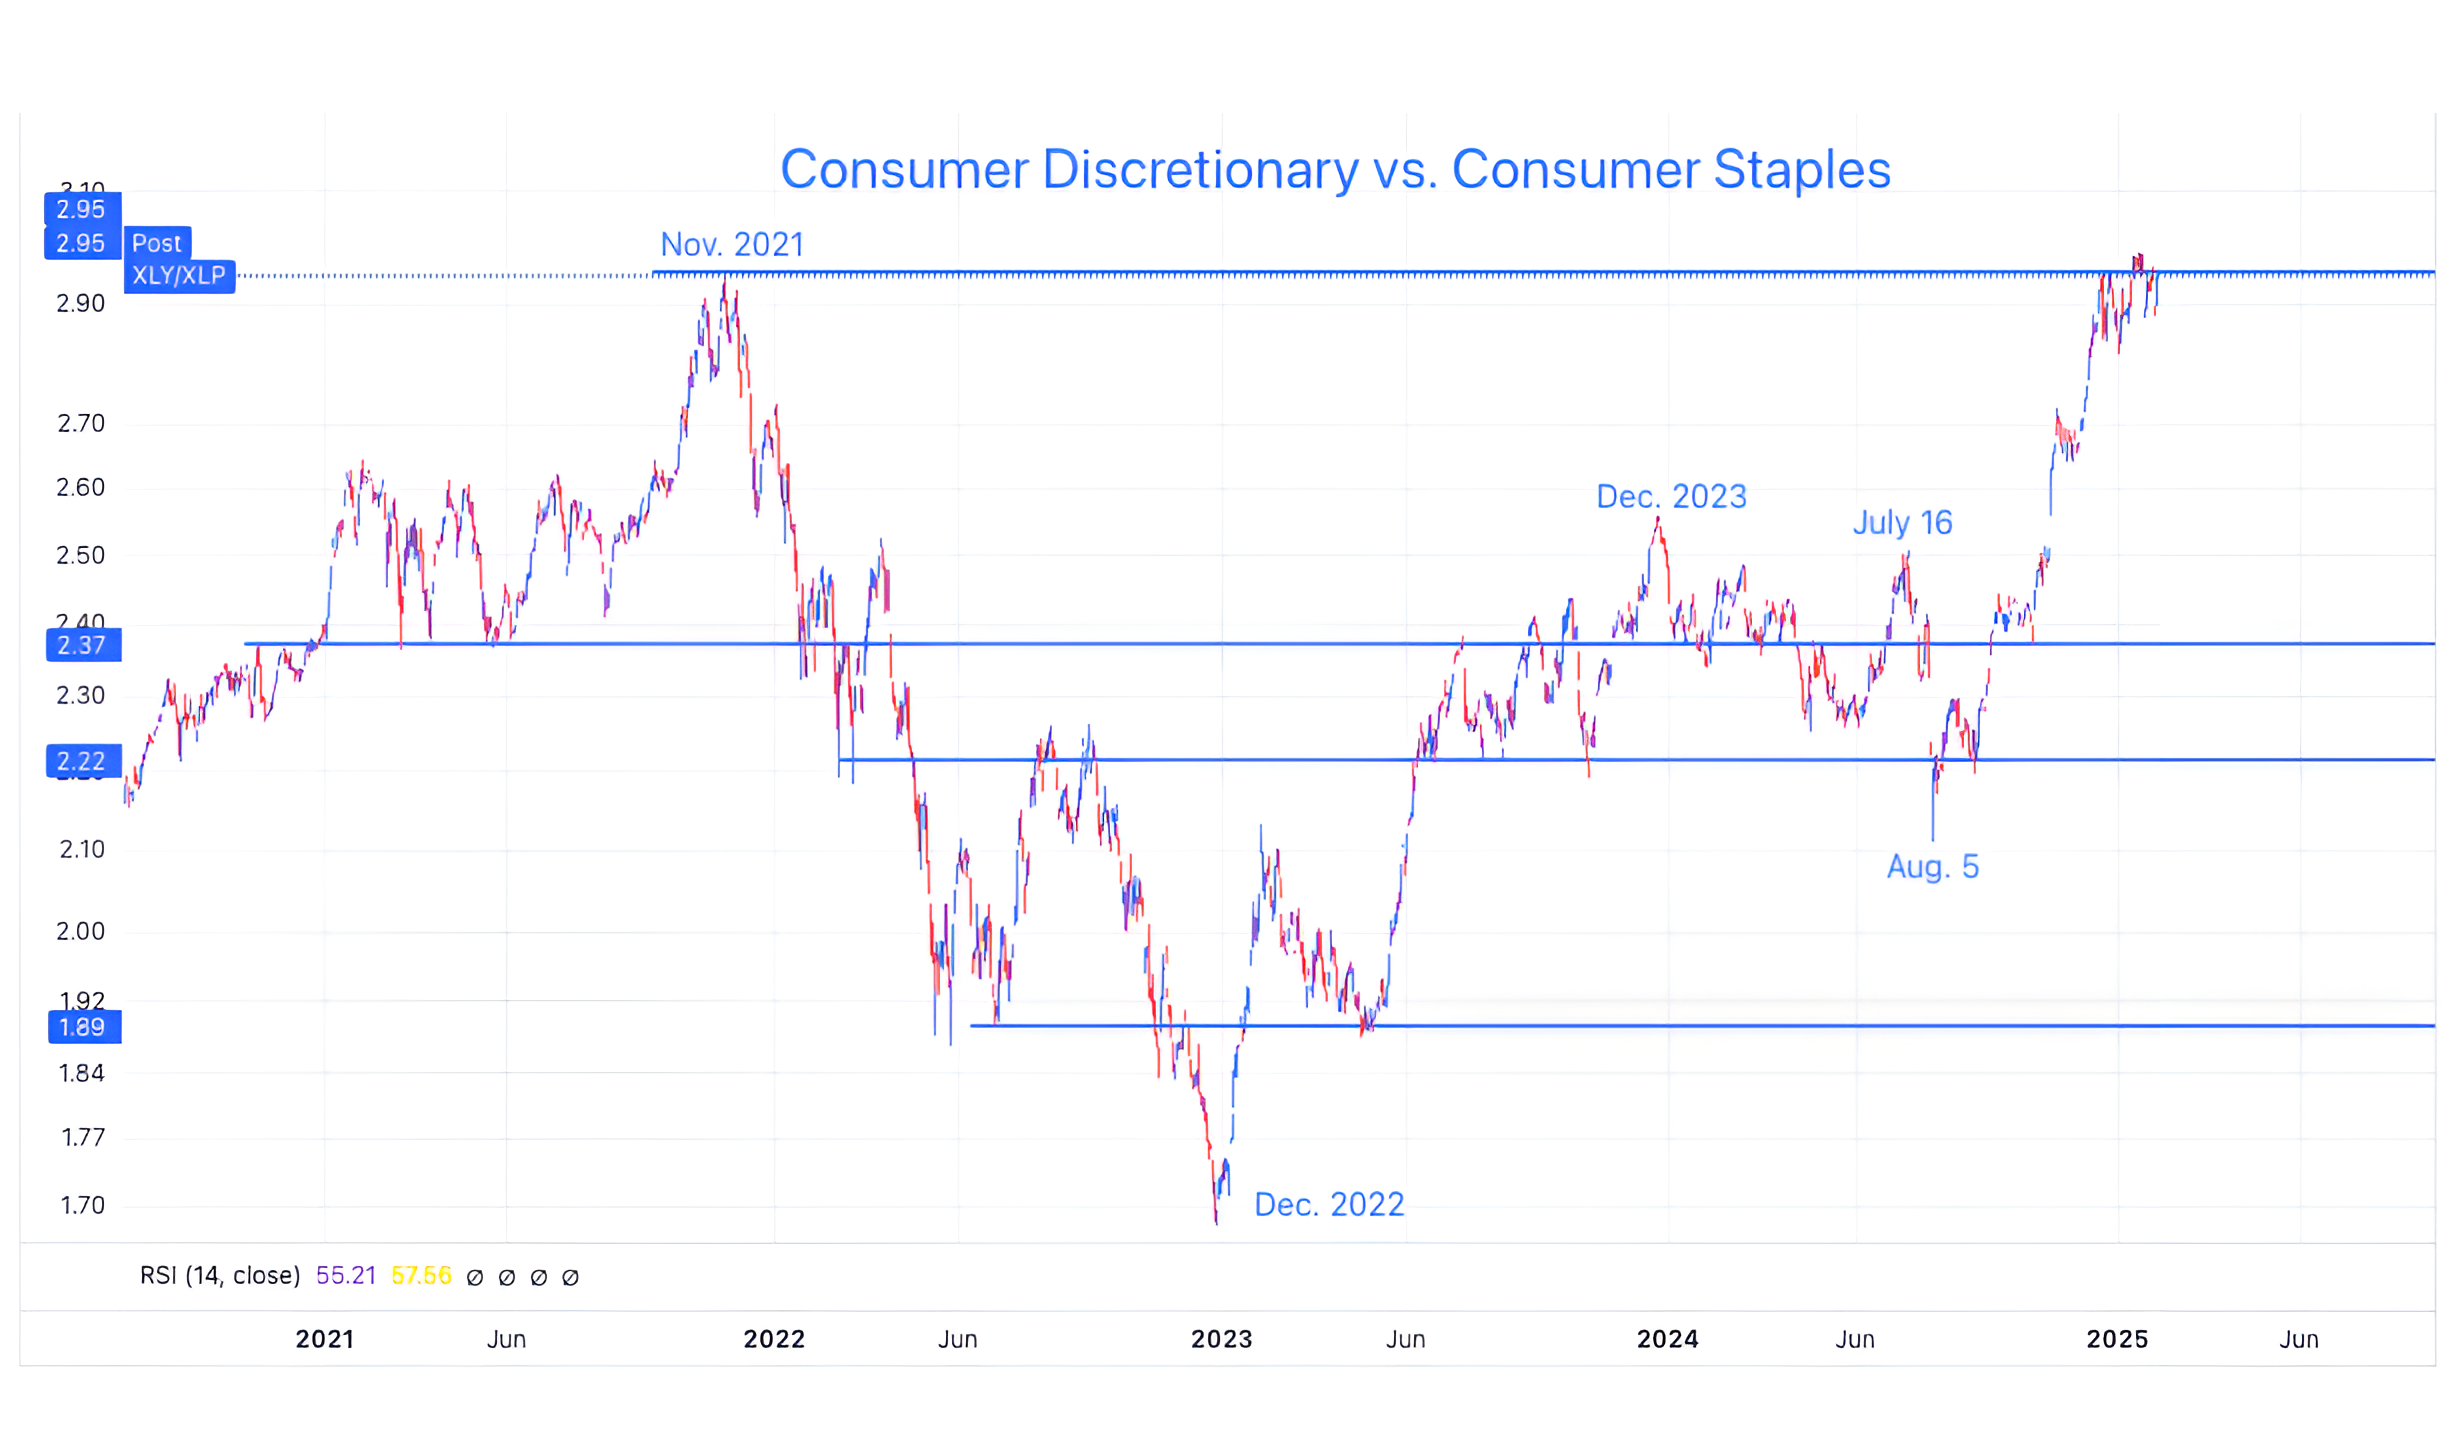
Source: TradingView. Through year-to-date 2025.
The chart above shows the Consumer Discretionary ETF (ticker: XLY) relative to the Consumer Staples ETF (ticker: XLP).
We love this intermarket relationship because it often foreshadows and confirms big turns in the broad markets.
Notice how this relationship peaked in November 2021, six weeks before the peak in the S&P 500.
While the 2022 low in the S&P 500 was in October, the Nasdaq 100 revisited its 2022 low in January 2023.
By January 2023, the turn in the Consumer Discretionary sector relative to the Consumer Staples sector had occurred - which allowed us to “confirm” the overall equity move higher.
We are watching the battle between the Consumer Discretionary sector and the Consumer Staple sector right at the 2021 high.
We believe the resolution will offer us clues as to the direction of the overall market.
(Past performance is not indicative of future results. This is not a recommendation to buy or sell any security and is not investment advice. Please do your own due diligence).
5. What Has Happened in the S&P 500 After a Strong Run?

Source: SubuTrade. Through year-to-date 2025.
The chart above shows the performance in the S&P 500 over different periods after the 11 previous times that the index was up in 12 of the last 15 months with a cumulative gain greater than 40%.
Historically (and past performance is not indicative of future results), the month after this condition has been negative 64% of the time with an average return of -1.9%.
Three months later, the index, on average, has gained 0.2% and has been positive 45% of the time.
One year later, the index has, been up on average 5.4%.
Interestingly, the 5.4% gain (although it would project to February 2026) is consistent with our year-end S&P 500 target of 6300 (+5%).
(Past performance is not indicative of future results. This is not a recommendation to buy or sell any security and is not investment advice. Please do your own research and due diligence).