


Der Kommissar's In Town...
Trump is back and Stan Druckenmiller says that "CEOs are somewhere between relieved and giddy. So we’re a believer in animal spirits." Will fundamentals constrain equity upside? Let's dig in...

Re-reading last Thursday’s note, I recognize that I have started this year more cautious than I was at any time during 2024.
The challenge with a technamental approach (watching both technicals and fundamentals) is knowing when to emphasize each within the context of one’s process.
I have written extensively about my concern with earnings expectations (continually reduced, but assisted by the calendar - see chart chart 2 here); valuations (top decile - see chart 3 here); and the transition from Treasury Secretary Yellen to Treasury Secretary Bessent (see the introduction here).
None of this is a “catalyst” for a market correction and certainly it is not necessarily a framework for an extreme sell-off.
In fact, last week, we reiterated our view of 6200-6300 in the S&P 500 during 2025 (chart 4 here).
That said, there are two commentaries from top investors that have our attention:
The first is from Howard Marks titled “On Bubble Watch.” We referenced this on January in chart 4 here.
In that piece, Marks says, “In my view, a bubble not only reflects a rapid rise in stock prices, but it is a temporary mania.”
For any that watched the extreme rise (and today’s fall) of the crypto tokens launched by President Trump and First Lady Melania over the past few days might think a mania is taking place.
However, I might question whether a crypto / meme coin mania could impact equity markets.
This would only be likely if there were an over-leveraged “crossover” investor that has exposure to both crypto and equity markets. We do not see this.
In fact, when FTX (the crypto exchange) went out of business - in November 2022, it nearly coincided with the start of the current bull market.
With that said, it is possible the mania mentality, could become infectious and begin to dictate the way that equity investors consider risk.
The second commentary is from Stanley Druckenmiller - my personal favorite.
In an interview with CNBC yesterday, Druckenmiller said, “We do a lot of talking to CEOs and companies on the ground. And I’d say CEOs are somewhere between relieved and giddy. So we’re a believer in animal spirits.”
However, he followed by saying:
“In terms of the markets, I would say it’s complicated. It's one of the most unattractive earnings yield to bond yield in 20 years.
You’re going to have this push of a strong economy versus bond yields rising in response to that strong economy, and that kind of makes me not have a strong opinion one way or the other.”
In other words, Druckenmiller sees somewhat of a disconnect between the strong economy - driven partially by optimism and “animal spirits” and the equity market due to valuation.
We would conclude by saying, we do not see a bubble that would suggest an extreme sell-off, but we do still see the risk of a meaningful correction.
That being said, we need to be prepared for anything (and more vigilant, in my opinion) as…
“Der Kommissar’s in Town.”
1. The S&P 500: What Happens When a Head and Shoulders is Rejected?
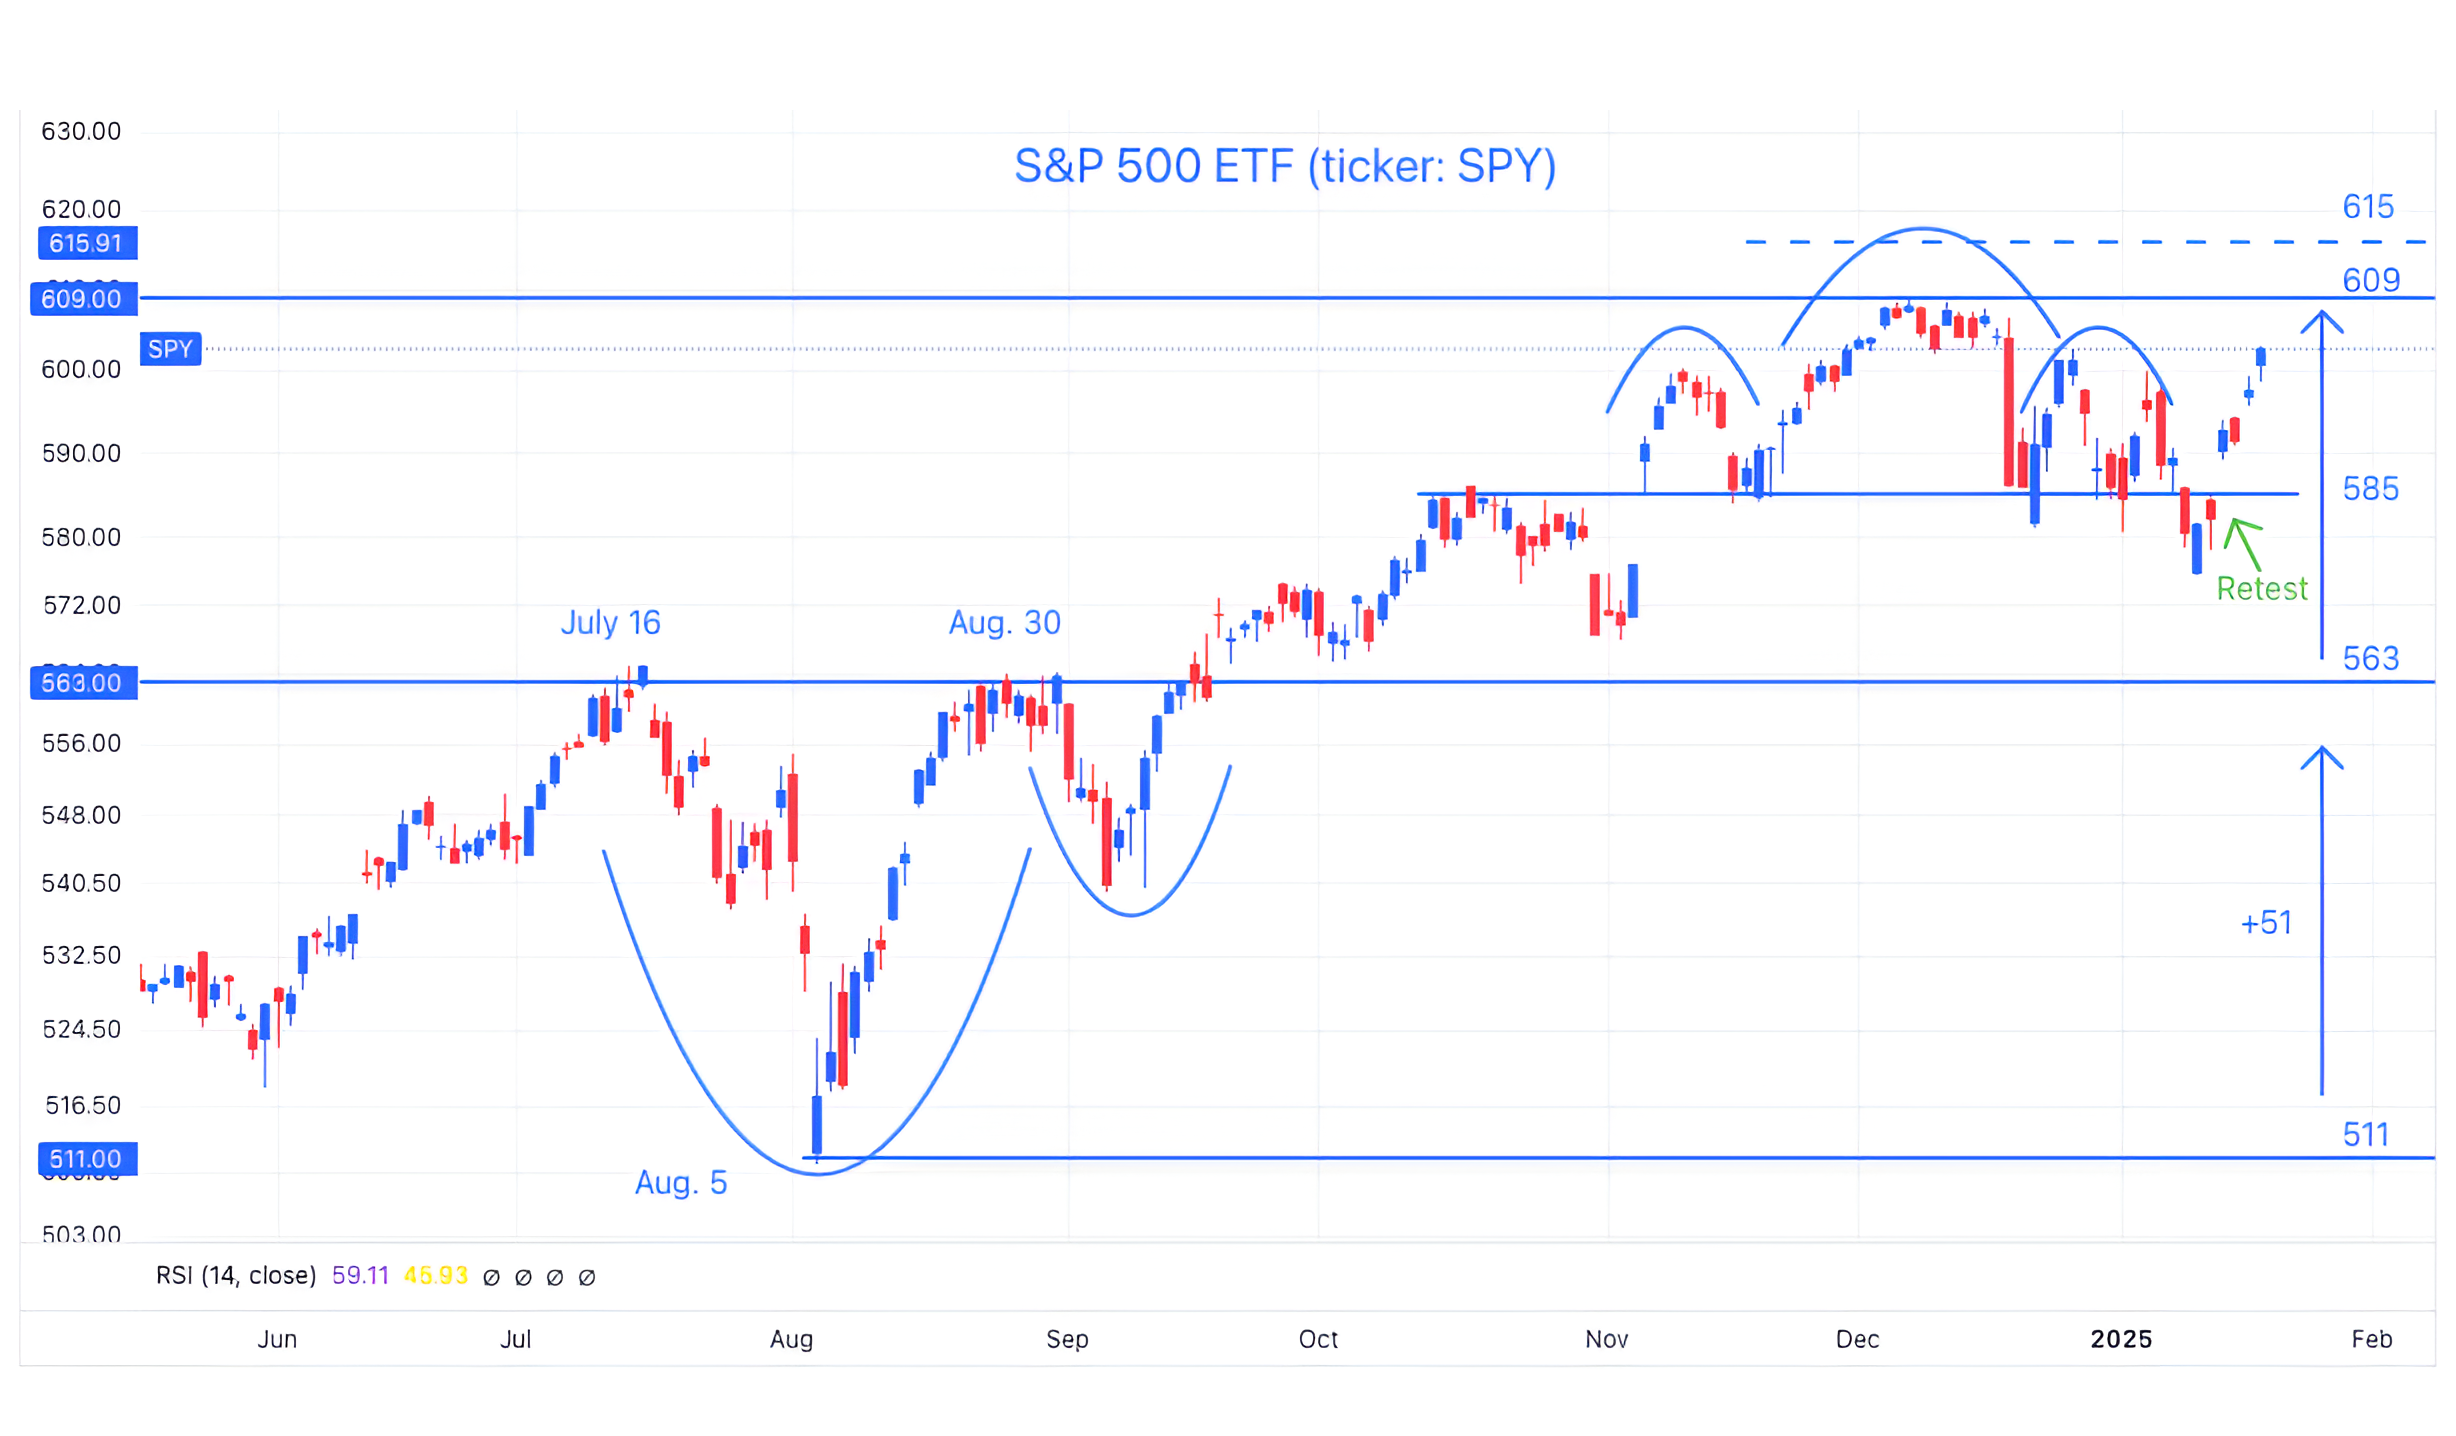
Source: TradingView. Through year-to-date 2025.
The chart above shows the S&P 500 ETF (ticker: SPY).
I spent my holiday weekend the same way I’m sure many of you did - looking at charts over short and long-periods seeing what clues I could find about direction.
Today, I will share my conclusions (or at least theories).
When we last showed the S&P 500 ETF two weeks ago (chart 1 here), we wrote: “It is possible that the S&P 500 has now formed a bearish “head and shoulders” pattern.”
We always look for a “retest” of key levels to “confirm” patterns or direction.
On the chart above, we have written “Retest” to show how after the S&P 500 ETF had fallen below the “neckline,” it climbed back up to it and paused. This was the Retest.
With the CPI (inflation) data, bearish sentiment (went from bullish to bearish very quickly) and some other technical factors (number of stocks at 20 day lows made a positive divergence) at play, the S&P 500 ETF lept back over the “neckline” and has not looked back since.
The “Retest” of was not confirmed and the pattern “failed.”
Non-confirmed / failed “head and shoulders” patterns often reverse dramatically. This is what we’re seeing.
With that in mind, I wanted to establish a near-term target for the S&P 500 ETF.
This led us back to the July / August “cup and handle” formation (the large and smaller arc on the left of the chart).
When we look at the “cup and handle,” it project to a target of 615 or a new all-time high on the S&P 500 ETF.
While that level is only 2.4% above the current price, we believe that a move above the all-time high would potentially undo the “bearishness” that developed as the ETF fell from 609 to 575.
Furthermore, a simultaneous 2.4% move higher in the Dow Industrials and Nasdaq 100 - will lead both of those Indexes right back to their all-time highs where there will likely be resistance (see a chart of the Dow Industrials below).
While our previous thought was that the near-term battle would take place lower, it seems now, it will take place at or around the recent highs.
If the S&P 500 ETF moves above 615 and is confirmed by the other indexes (the Nasdaq 100 and Dow Industrials) moving (convincingly) above their respective all-time highs our next targets would be 650 and 700.
At that point, we would be emphasizing technicals over fundamentals within our process as we did throughout 2024.
(This is not a recommendation to buy or sell any security and is not investment advice. Past performance is not indicative of future results. Please do your own research and due diligence).
2. The Dow Industrials: Won the Battle Lower, Can it Win the War Higher?

Source: TradingView. Through year-to-date 2025.
The chart above shows the Dow Industrials Index.
We showed this a week ago here.
At the time, with the Dow Industrials Index at its 1.618 Fibonacci extension level of 42000, we wrote, “Once again, we are watching the reaction for of the Dow Industrials at the 42000 level to set the tone for the other indexes.”
Since that time, as can be seen, the Dow Industrials, bounced off of the 42000 level and is now headed back to its all-time high.
As noted in chart 1, if the Dow Industrials, Nasdaq 100 and S&P 500 move up 2.4% in lock step, they will all arrive at respective battleground areas simultaneously.
This will present the next test for US equity markets.
(Past performance is not indicative of further results. This is not a recommendation to buy or sell any security and is not investment advice. Please do your own due diligence).
3. The Margin Assumptions Underneath Earnings Expectations
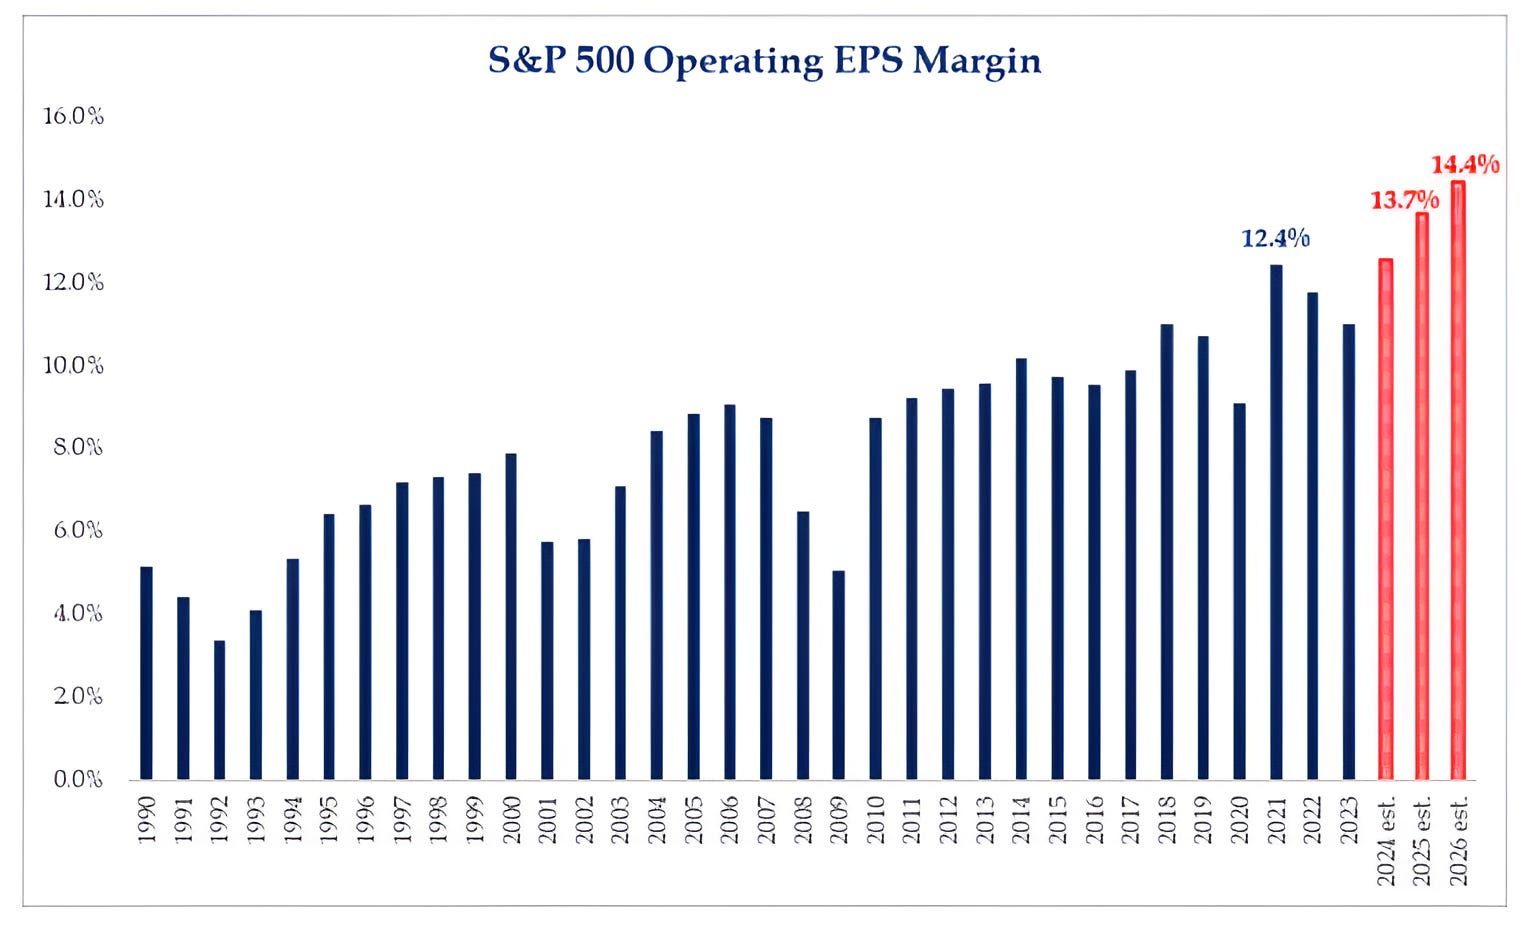
Source: Strategas based on IBES data from Refinitiv. Through year to date 2025.
The chart above shows the actual (blue) and expected (red) S&P 500 Operating Earnings Per Share Margins that are the basis for the earnings expectations that we often cite.
In order to meet current earnings expectations, US equities will need to achieve record operating margins in 2025 and 2026.
Historically, corporate profit margins have been one of the most mean reverting measures in finance.
It stands to reason that if a company is making outsized profits either its employees will ask for a raise or competition will enter the sector.
That said, over the past 25 years, margins have trended higher.
We attribute this to:
the efficiencies and productivity gains from technology;
off-shoring (cheap labor);
larger share of technology and software companies in the index where each new license or seat has very incremental cost;
oligopoly industries (and sometimes quasi monopoly industries) that do not engage in price wars and have high barriers to entry.
While we believe some of these trends will continue, tariffs and more on-shoring may be a headwind to higher margins.
(Past performance is not indicative of future results. This is not a recommendation to buy or sell any security and is not investment advice. Please do your own due diligence).
4. Watching the Dollar
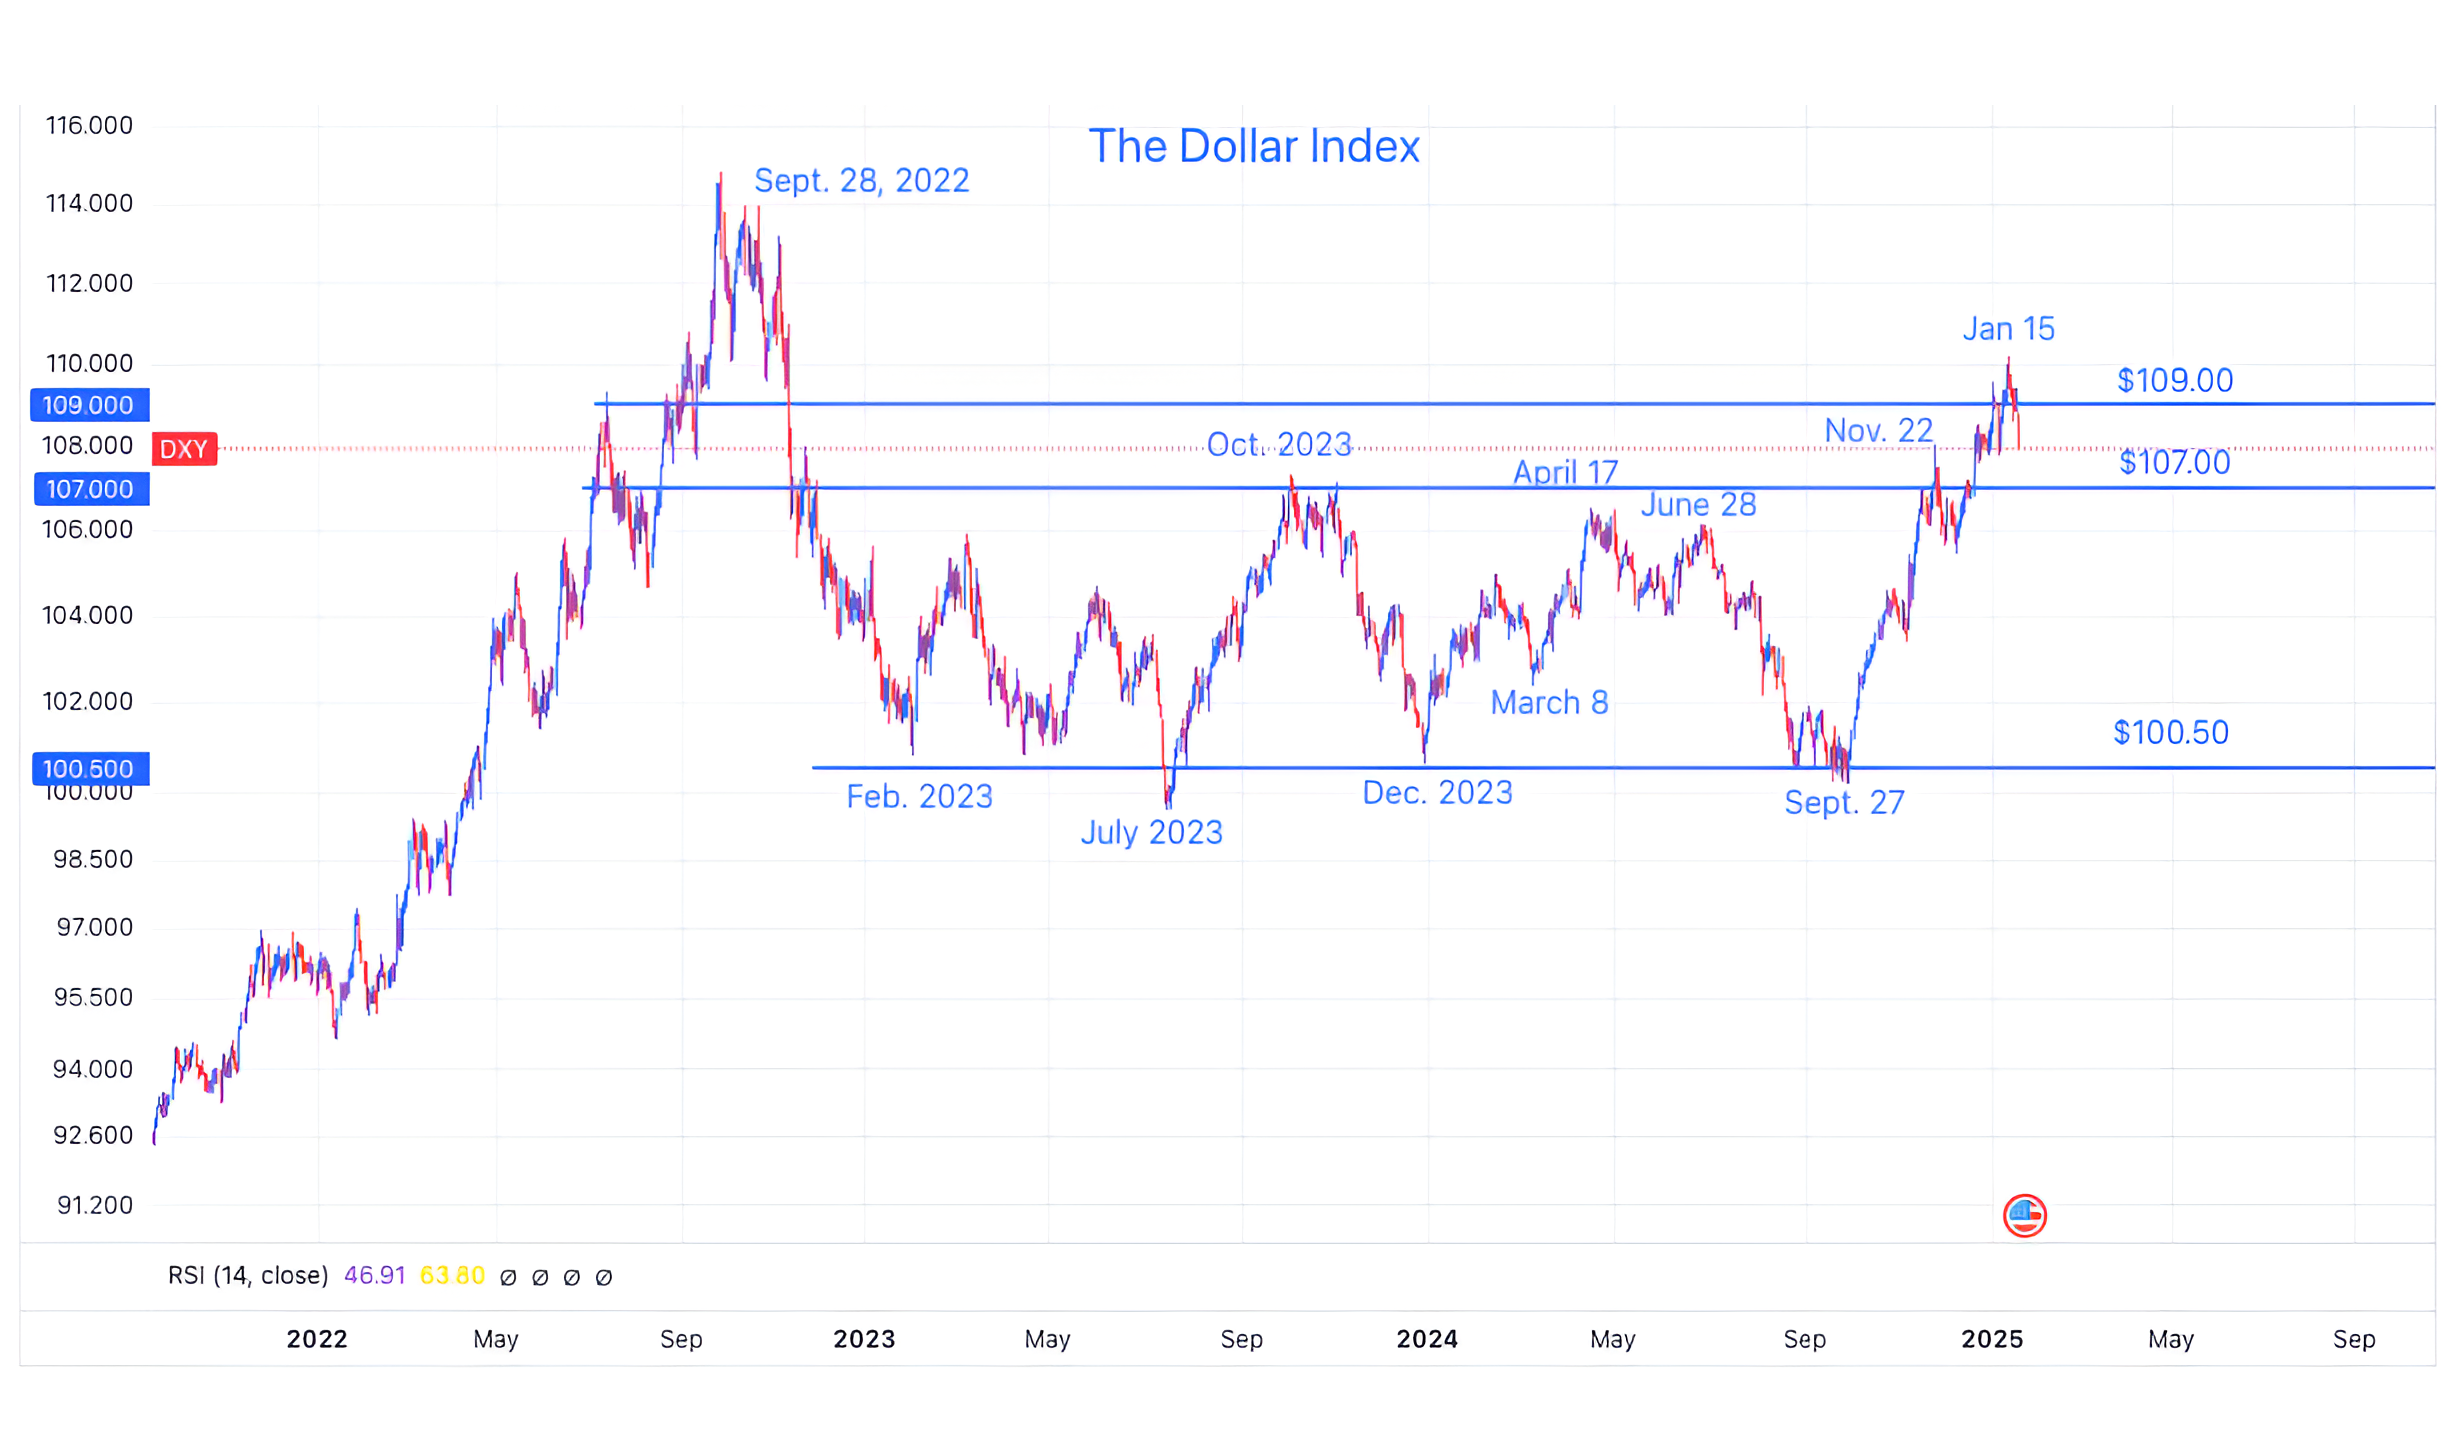
Source: Trading View. Through year-to-date 2025.
The chart above shows the US Dollar.
We last showed this in mid-December (chart 5 here).
At the time, the Dollar Index (DXY) was fighting with the $107 level which represents half of the move from the September 2022 high to the July 2023 low. (Although 50% is not a member of the Fibonacci sequence, we often see price battle at this range).
In general, since 2022 large moves in the US Dollar have been inverse to equity market performance.
In other words, US Dollar strength has often foreshadowed equity weakness and vice versa.
Within that context, it was surprising that as the dollar strengthened from September 27 2024 to January 15 that US equities achieved an all-time high and essentially felt no impact.
In general, from December 2022 to December 2023, the dollar traded in a range between $100.50 and $107.00.
It has now moved above the range.
If we were to apply our view on “symmetry” that we discussed last week (with respect to Chubb and Citigroup) to the Dollar index, we would expect a target of $113.50 or essentially in line with the September 2022 peak. But only if the Dollar successfully re-tests (or bounces off of) the $107.00 level.
If that thesis becomes reality, we believe this will present a headwind to equities.
(Also, for those keeping score at home, the $109 level represent the 0.618 Fibonacci retracement of the September 2022 high to the July 2023 low. In our work, this is an obvious place for a pause and / or battle.)
(Past performance is not indicative of future results. This is not a recommendation to buy or sell any security and is not investment advice. Please do your own due diligence).
5. Checking in on Japanese Equities
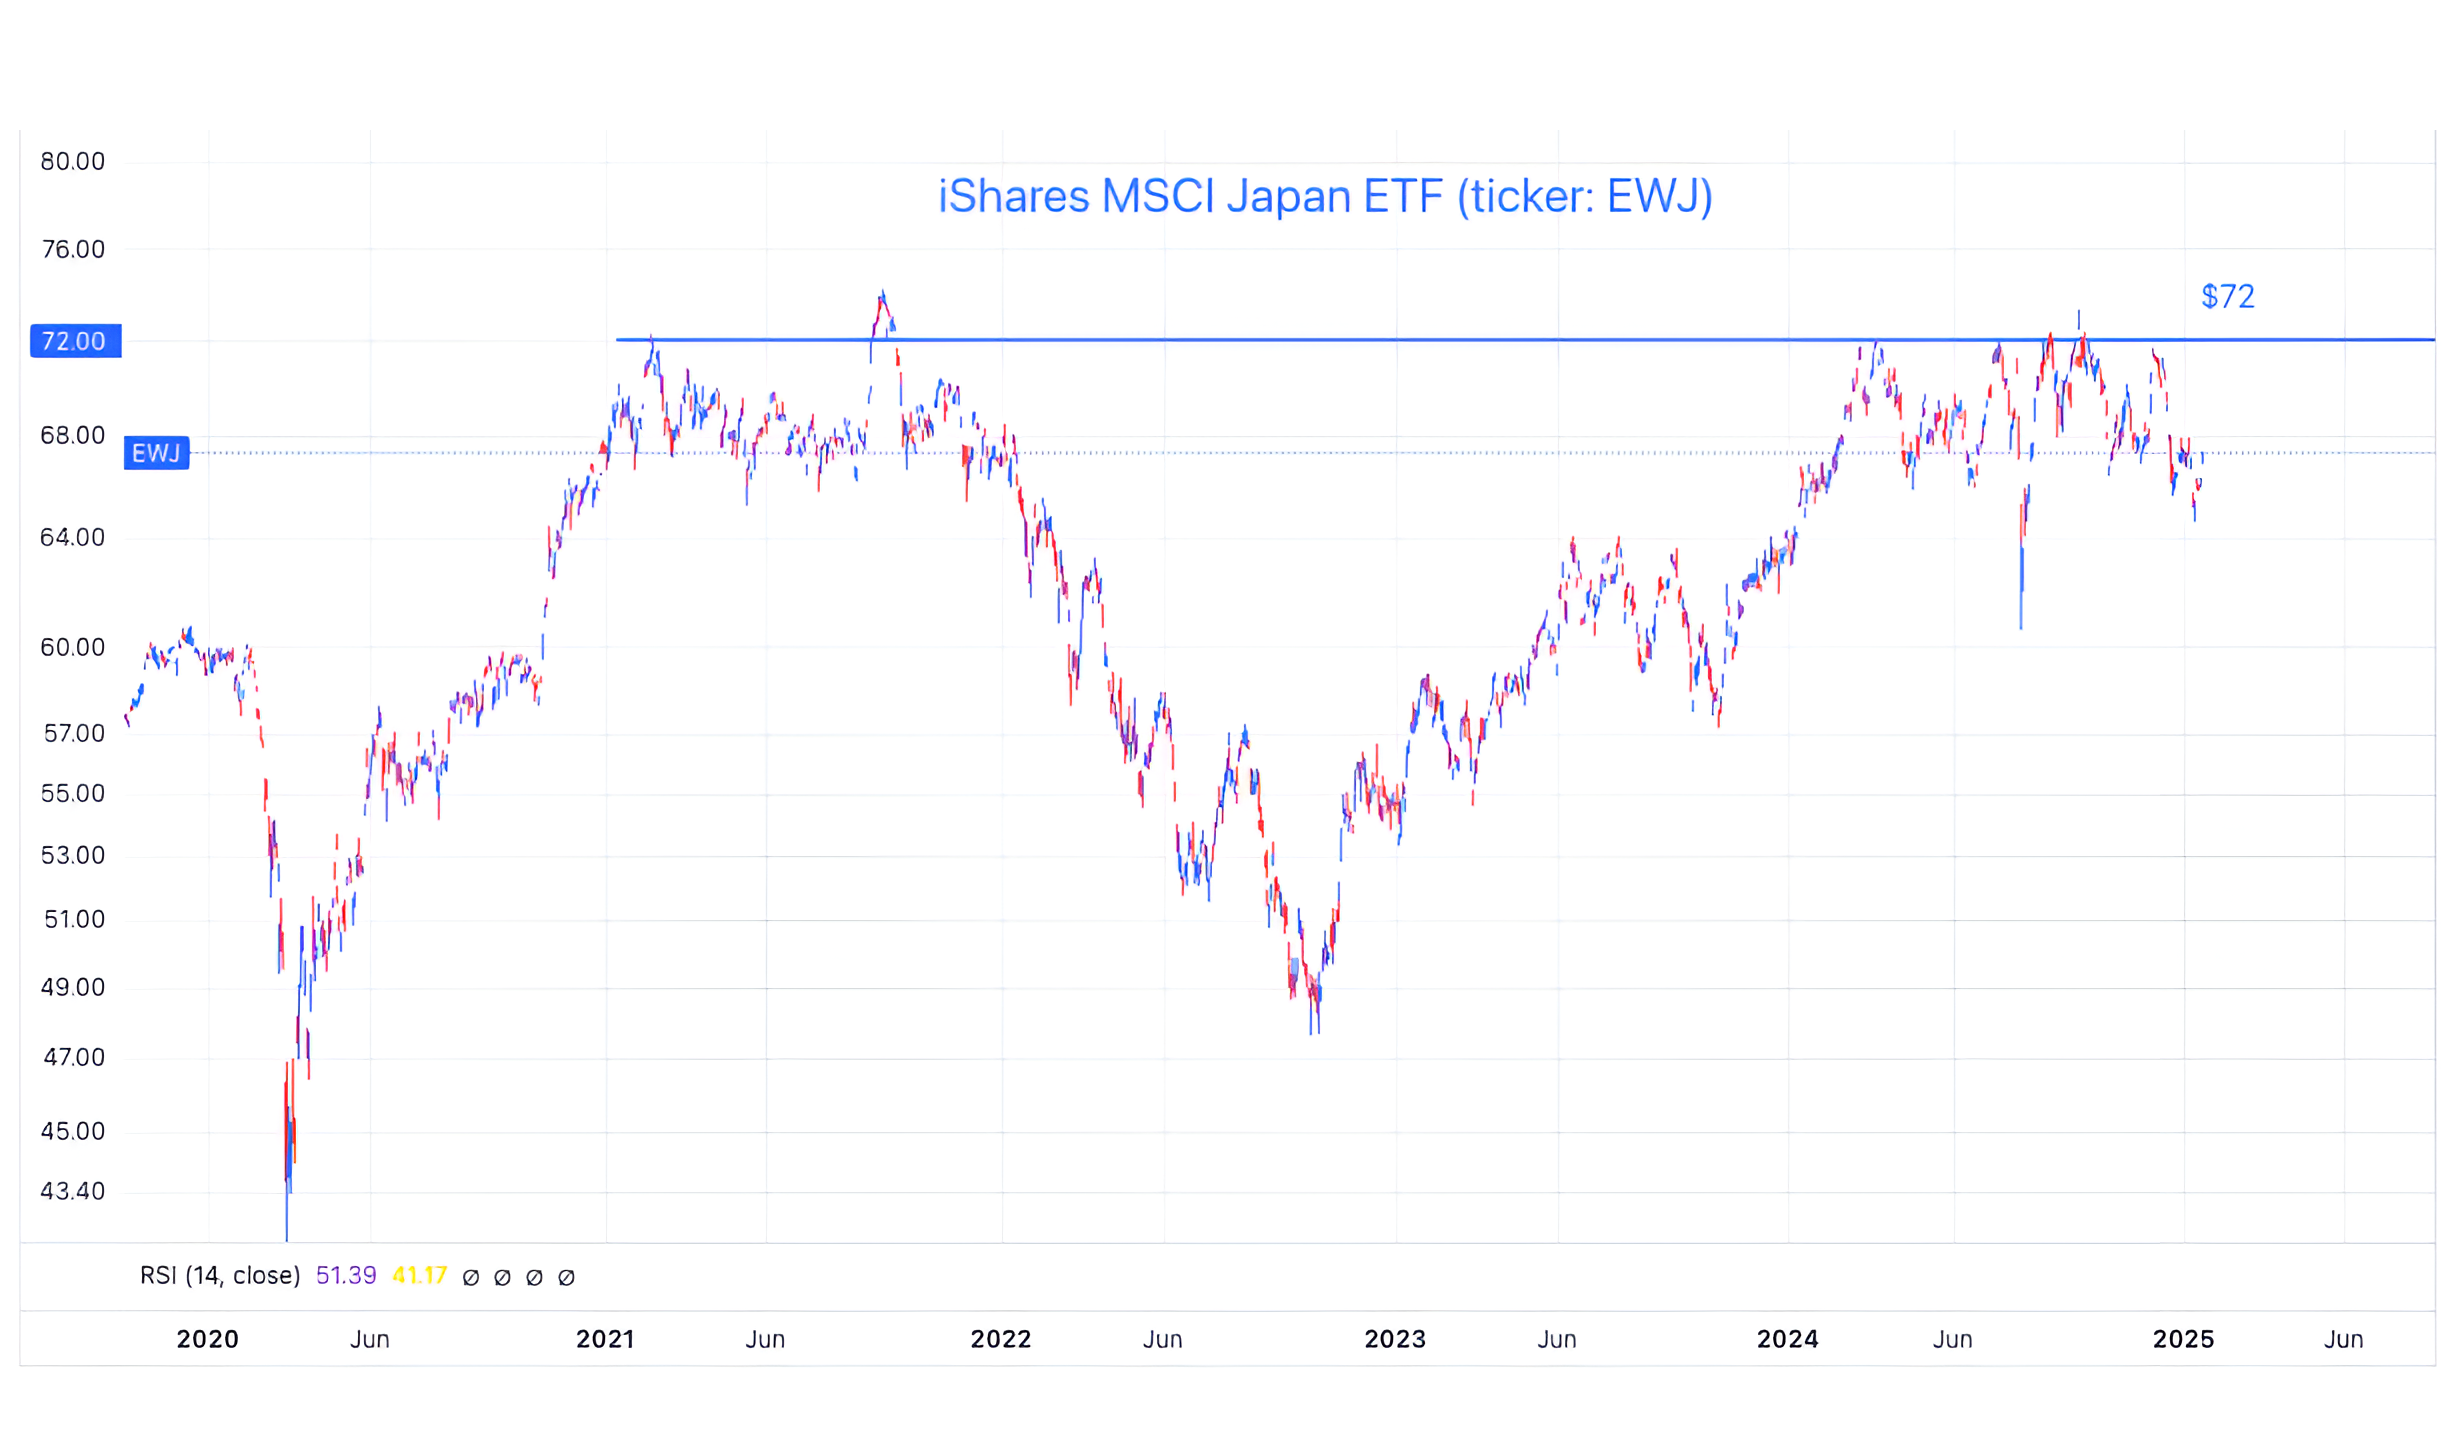
Source: Trading View. Through year-to-date 2025.
The chart above shows the iShares MSCI Japan ETF (ticker: EWJ).
Last Thursday, we showed the German Dax Index which was making new all-time highs despite poor economic growth.
Today, we’re showing Japanese equities which has essentially been trapped under a ceiling of $72 since first achieving the level four years ago.
Unlike, the German economy, the Japanese economy is continuing to do well.
In our view, if the MSCI Japan ETF can move convincingly above $72, the next stop would likely be between $95-100.
We will be watching.
(Past performance is not indicative of future results. This is not a recommendation to buy or sell any security and is not investment advice. Please do your own research and due diligence).