


I Can Feel It All Over...
Something's not right. Trump is supposed to be great for the economy, yet earnings expectations are coming down. Q4 earnings have been strong so far, but indexes are below their highs. Let's dig in...

Maybe, we’ve been too pessimistic since mid-December.
Maybe, we’re too “old school” focusing on fundamentals like earnings, earnings growth and valuation.
Maybe, we’ve been right.
Maybe, US equity markets (the S&P 500 and Nasdaq 100) haven’t moved anywhere in a month.
Maybe, there are too many complications as we switch US Presidential administrations, with new policies and priorities and we hand the baton from one Treasury Secretary to the next (see the introduction here) with the S&P 500 trading at a top decile valuation.
We have reduced our equity exposure by 10-15% (taking some of those 2024 gains) and have added some puts and put spreads to portfolio.
Maybe, everything will be ok.
But maybe, it will pay to be vigilant.
The real battle has begun…
“I can feel it all over.” (Sir Duke (I had no idea this was the title) from Stevie Wonder).

1. The Nasdaq 100: The Battle has Begun
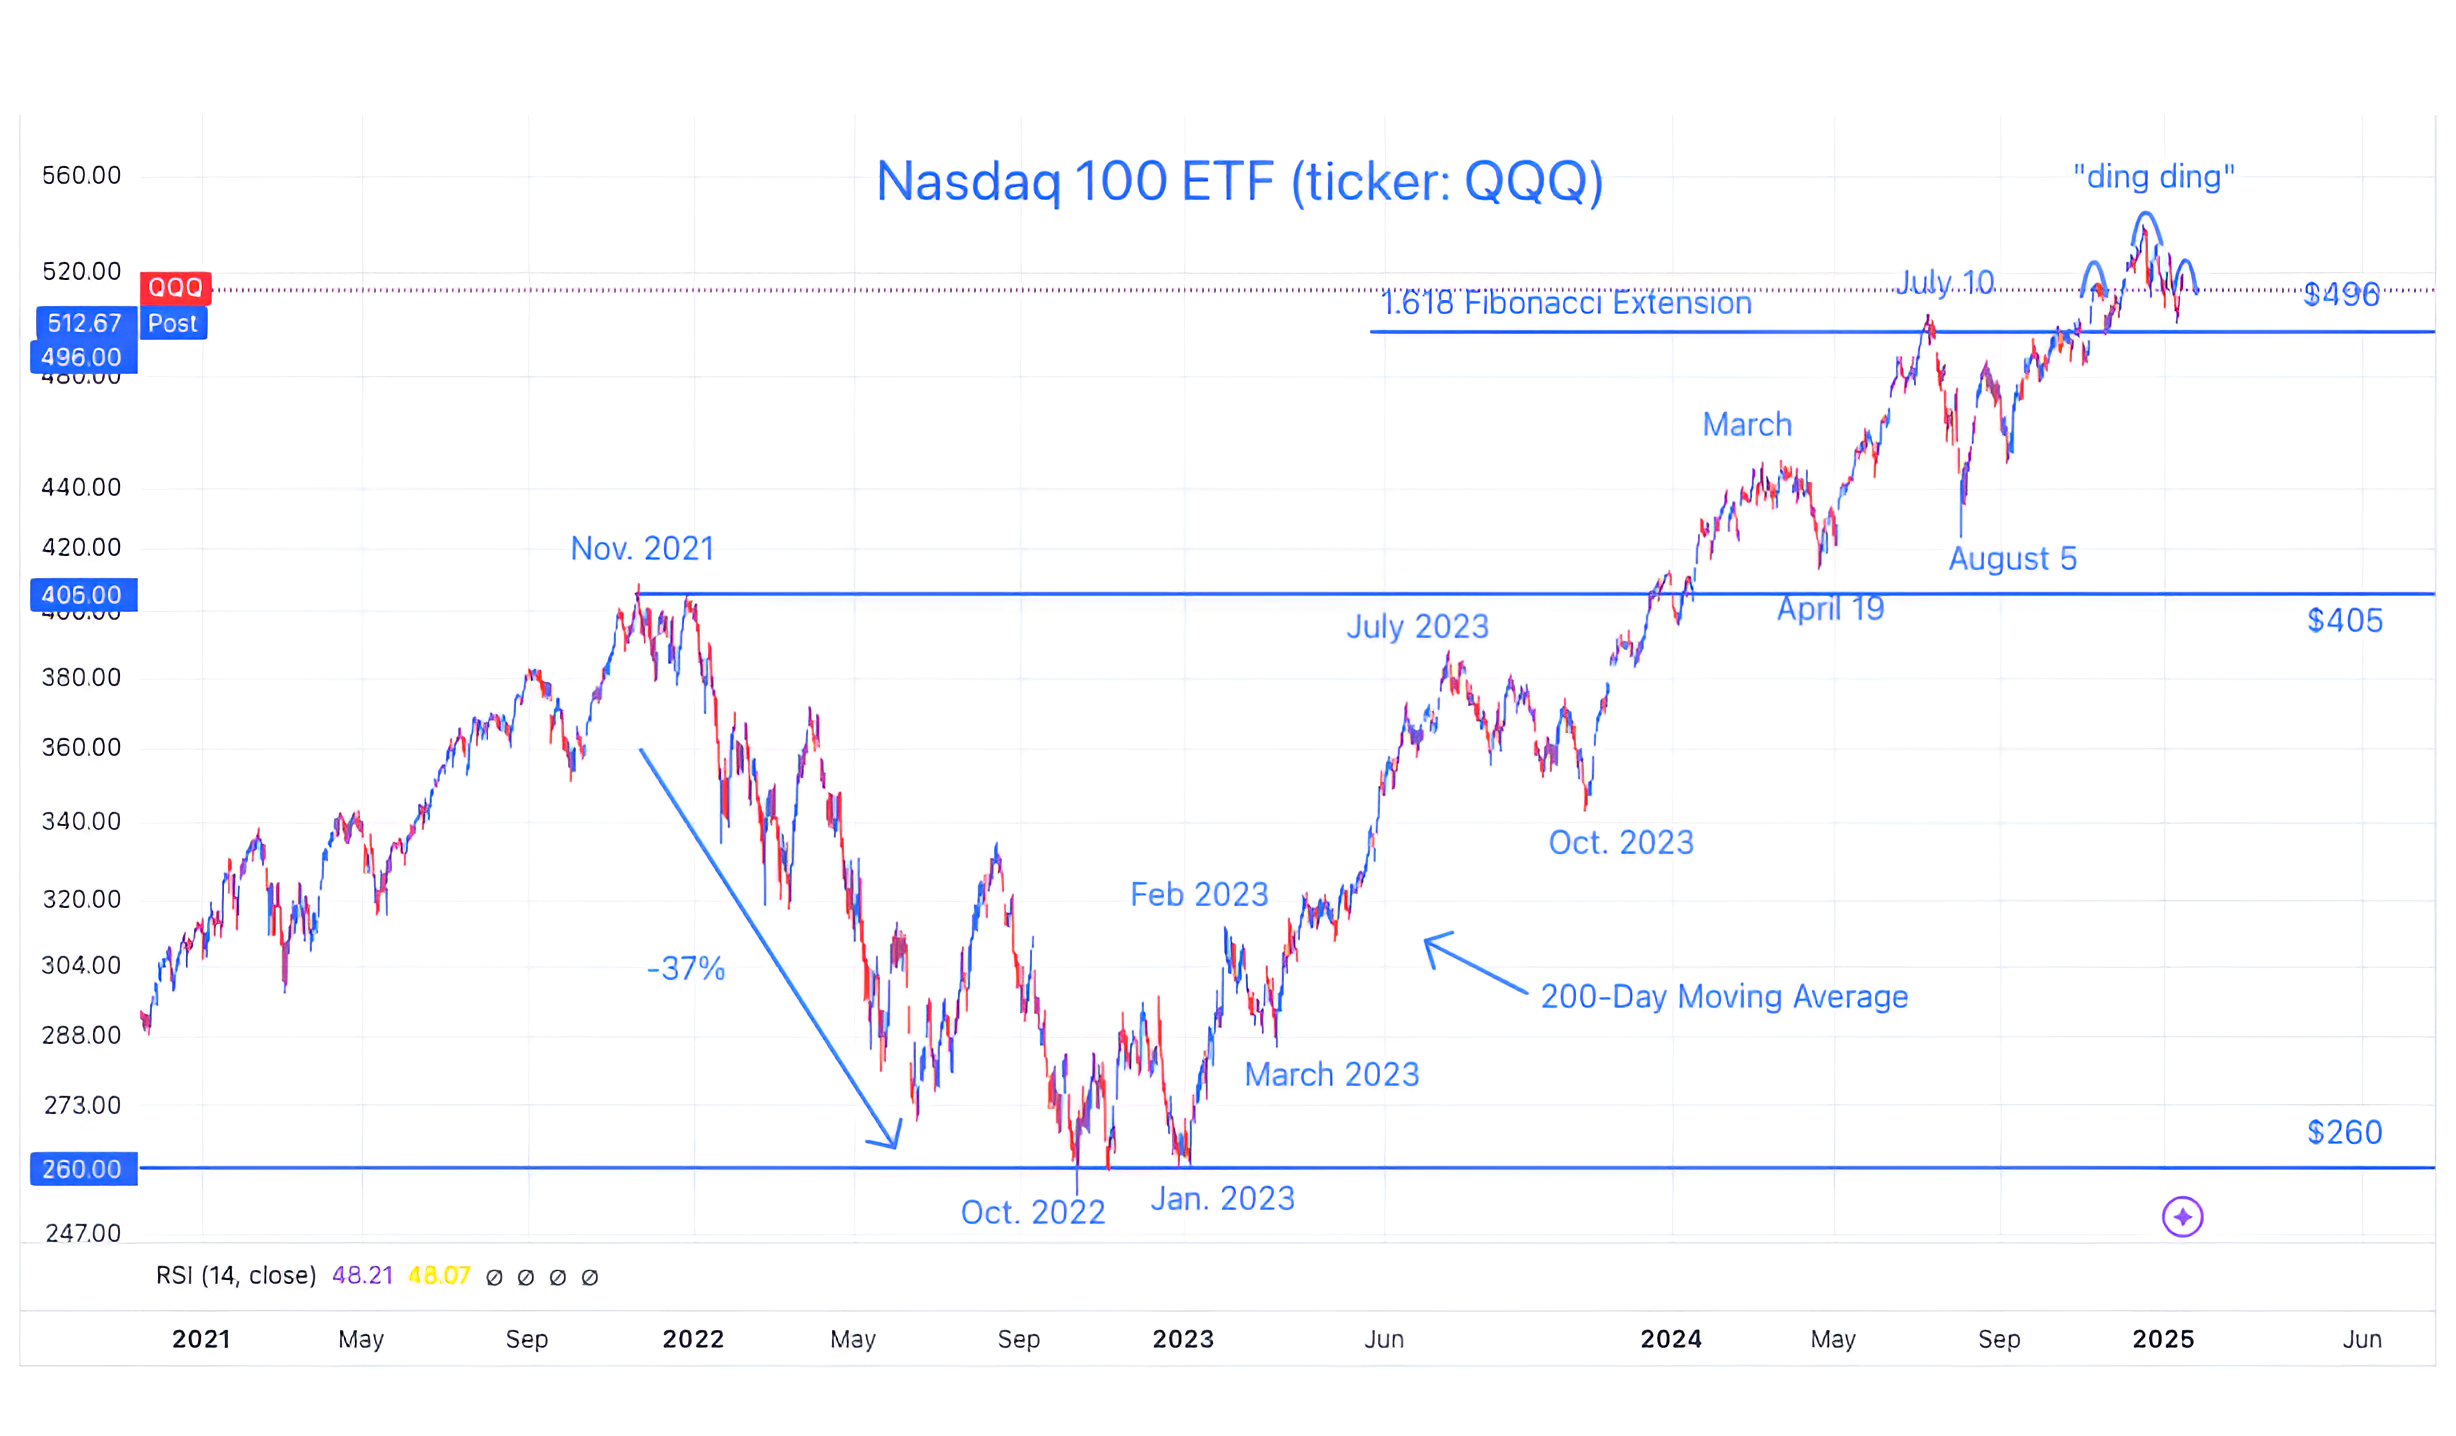
Source: TradingView. Through year-to-date 2025.
The chart above shows the Nasdaq 100 ETF (ticker: QQQ).
When we showed the chart last week (here), we wrote “we expect the real battle to occur (once again) at the 1.618 Fibonacci extension level.”
Since that time, the Nasdaq 100 have moved back down to the 496 neighborhood (the price that we view as the 1.618 Fibonacci extension level) and has bounced.
The battle has begun.
There is now the potential for a bearish “head and shoulders” formation to be developing.
If a bearish “head and shoulders” formation were to be confirmed in the Nasdaq 100 ETF, we would expect the target to be in the $470 - $475 range which is ~7-9% lower than today’s closing level and is ~12-13% below where we “rang the bell.” (here).
Interestingly, tech earnings - with exception of Taiwan Semiconductor - which dominate the Nasdaq 100 have yet to come out.
As we wrote on Tuesday with respect to the Dow Industrials:
“We believe the odds that the Dow Industrials Index falls through its 1.618 Fibonacci extension level and enters a more significant correction are higher than typical.”
We would apply the same thinking to the Nasdaq 100 (and the S&P 500).
We also noted on Tuesday, that it always amazes us how the indexes seem to be in the neighborhood of important levels on the eve of critical news.
We have our view and positioning, we will see how this plays out.
(This is not a recommendation to buy or sell any security and is not investment advice. Past performance is not indicative of future results. Please do your own research and due diligence).
2. Establishing an Earnings “Baseline” for Q4
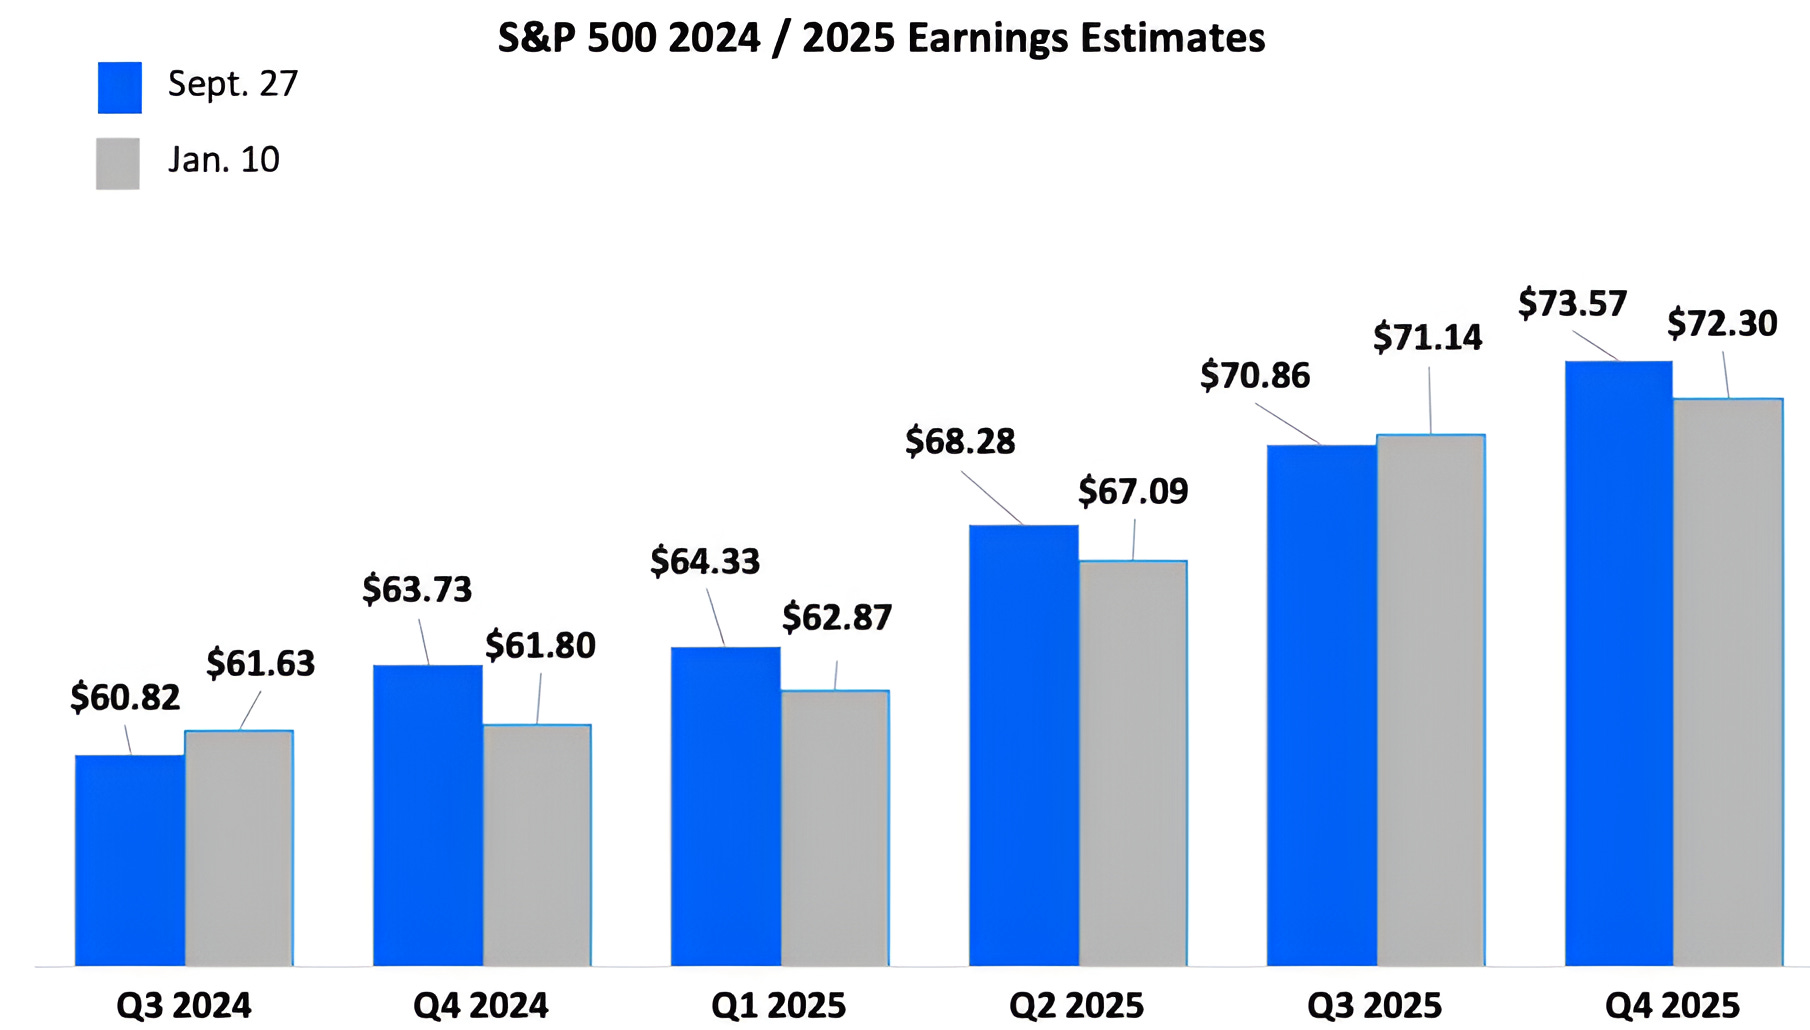
Source: FactSet, Luminos Advisors. Through year-to-date 2025.
The chart above shows S&P 500 earnings at the start of Q4 (September 27) and the beginning of Q4 earnings season (January 10).
In general, Q4 and 2025 S&P 500 earnings have drifted down throughout the fourth quarter.
Q4 earnings expectations have moved from $63.73 at the beginning of the quarter to $61.80 at the beginning of Q4 earnings season. 2025 earnings have $277.04 to $273.40 over the same period.
This reduction in expectations has occurred despite the heightened enthusiasm around the US economy that some have embraced with the Trump administration. This is the same enthusiasm that many investors are applying to small caps.
Our expectation is that Q4 earnings will exceed the reduced (current) estimate, but will likely fall short of the expectations from the beginning of the quarter (September 27).
This “jumping over a lowered bar” phenomena has been relatively consistent in US earnings since the financial crisis and is similar to what happened during Q3.
That said, the most important factor in the earnings season is that next 12 months earnings will increase.
This will not be because earnings projections for 2025 will increase, it is because the calendar will “roll” and next 12 months earnings will incorporate Q4 2025 rather than Q4 2024.
What does this mean?
Three months ago - next 12 months earnings, that incorporated Q4 2024 earnings, were $267.20. Once Q4 results are in, barring any changes, next 12 months earnings - which will capture expectations for Q4 2025 rather than those from 2024 - will be $273.40.
If the S&P 500 were to remain at last night’s closing level of 5950 through earnings season - simply because of the roll of the calendar, the price to forward earnings multiple would decline from 22.3x to 21.8x.
This is a 0.5x multiple decline just for standing still and letting the calendar do the work.
In other words, despite air slowly leaking out of the earnings forecast balloon, as long as investors can continue to “roll” their next twelve months earnings expectations into consistently higher results, there is no earnings catalyst for a market correction.
The biggest risk to earnings, in our view, is that we have a “metaverse moment.”
As a reminder, in late 2021, investors began to push back against Facebook because of what they considered to be too much spending on the metaverse without the prospect of returns.
The hyperscalers are spending over $250 billion in 2025 on data center capex with limited incremental revenues that we can see. (I don’t see co-pilot driving Microsoft’s results, but maybe I’m wrong).
If investors once again push back - as they did with Facebook and the Metaverse - and data center capex slows or declines, we would envision earnings, economic and market volatility.
We do not currently see a “metaverse moment,” but are watching for it.
(Past performance is not indicative of further results. This is not a recommendation to buy or sell any security and is not investment advice. Please do your own due diligence).
3. A Long Look at Citibank

Source: TradingView. Through year to date 2025.
The chart above shows the price of Citigroup (ticker: C) shares beginning in 2007.
This is not a recommendation to buy or sell Citigroup shares, nor is it an evaluation of the different management teams over the past 17 years (Chuck Prince, Vikram Pandit, Michael Corbat, Jane Fraser).
It is simply to put yesterday’s earnings (by all accounts solid - progress being made, large buyback etc.) and the share price reaction (+6%) into perspective.
Citi is now back to the top of an eight year range and at a level, that after the 98% financial crisis sell-off, shares first reached in 2018, seven years ago.
Citi shares have been dead money for seven years!
It has not been a great buy and hold investment.
That’s the bad news.
The good news is that if Citi shares were to meaningfully move out of their eight year range, we would expect that they would head towards $141 based on the symmetry that we described on Tuesday.
While a 76% upside target (no timeline) may sound aggressive, it is important to remember that Citi shares are currently trading at 10.7x forward earnings and 0.8x price to book value.
The first step is to move above $80 which has clearly been a challenge. We’ll see.
(Past performance is not indicative of future results. This is not a recommendation to buy or sell any security and is not investment advice. Please do your own due diligence).
4. Different 2025 Year-End Earnings and Multiple Scenarios

Source: Luminos Advisors. Through year-to-date 2025.
The chart above shows different year-end 2025 S&P 500 levels based on differing 2026 earnings expectations and price to forward earnings scenarios.
In mid-November (in the introduction here), we provided our base case view for the S&P 500 for 2025:
“We see muted gains in 2025 to a level of around 6200-6300 as a combination of liquidity and the expectation of a better 2026 helps US equities to recover from a first half sell-off.”
Our outlook is less than that of the consensus (see chart 3 here and here).
While we don’t know if we’ll have a first half sell-off (still to be determined), we wanted to show 2026 earnings and forward multiple assumptions around our year-end expectation.
As a reminder, 2025 earnings are currently expected to be $274.
Similar to 2024 earnings which were at one point expected to be $245 and will end up around $240, in a non-recessionary environment, we would expect 2025 earnings to come in around $270.
If or current 2025 expectation were to occur, this would represent 12.5% growth from 2024 earnings.
To grow from $270 in 2025 earnings to $300 in 2026 earnings would be 11% growth. This would represent the first back to back years of double digit S&P 500 earnings growth since 2017 / 2018 - the first two years of Trump 1.0. (See chart 4 here).
As a reminder, 2018 S&P 500 earnings growth was catalyzed by the Trump corporate tax cut. Another corporate tax cut is possible but may be a challenge given the current fiscal situation.
From a valuation perspective, we see the scope for further multiple expansion as constrained (see chart 3 here).
However, as we’ve written several times, there is no “reason” that valuation must contract.
(Past performance is not indicative of future results. This is not a recommendation to buy or sell any security and is not investment advice. Please do your own due diligence).
5. From Germany with Love

Source: Trading View. Through year-to-date 2025.
The chart above shows the German Dax Index - it is making new highs.
Why am I showing this?
For anyone who follows the German economy (new hobbies are on my list of new year’s resolutions), Germany has just experienced its second consecutive year of negative GDP growth.
As a reminder a recession is two consecutive quarters of negative growth - Germany has experienced two consecutive years (interesting analysis from Goldman here).
Despite this, the German equity market is making new all-time highs.
One reason is that the largest companies in the Dax include Siemens, SAP, Allianz and Mercedes-Benz - are all multinational companies that do not rely on the German economy.
The weaker Euro has most likely aided German companies by either making them more competitive in non-Euro countries (able to reduce prices) or by helping increase profit margins (able to sell at the same price).
A second reason may be that many economists are looking forward to growth in 2025 - however, this would not explain the performance of German equities in 2024.
All of that said, when we look at the chart above - we see a “cup and handle” pattern (the large arce and the smaller arc) that has a measured target to 20,640 (16270 - 11900 + 16270) which is approximately where the index is today.
Again, we are simply showing this because given the news we have read out of Germany (both economic and political), it was a surprise that German equities were making a new all-time high.
(Past performance is not indicative of future results. This is not a recommendation to buy or sell any security and is not investment advice. Please do your own research and due diligence).