


Sitting in Limbo...
US equities have continued to absorb everything that's been thrown at them. It often pays to listen to strength (or weakness) in the market, but we're watching for confirmation. Let's dig in...

We’re at the point in the market cycle when we are more dependent on technicals than fundamentals.
Why?
Very simply, it seems the micro and macro fundamentals seem to have been absorbed by the market.
Q4 earnings season has been ok.
Based on the numbers that we track (FactSet), Q4 earnings have come in 1% above expectations from mid-December and 0.5% below expectations from the beginning of the Q4.
Since mid-December, Q1 2025 and full year 2025 earnings projections have been reduced 1.7% and 0.5%, respectively.
The Fed, which in mid-December was expected to cut rates four times during 2025, is now expected to cut only once.
In addition, the Magnificent Seven have not been leading this year (I’m being kind), we have had a policy hurricane out of Washington and the introduction of DeepSeek.
While we could (and have) continued to be concerned about valuation, with:
continued economic growth (no recession in the near-term);
ok earnings growth; and
the Fed stable, but prepared to cut if needed…
…heightened valuation can be justified.
While I am not calling for multiple expansion, my point is that if valuations have not reacted to the factors cited above, there is not a current identifiable reason for contraction.
This leads us to the technicals - money flow, investor psychology and sentiment.
Currently, the major US equity indexes have maintained their post-election sideways move.
Today, we are continuing to highlight the charts that we believe will be indicators or barometers for the direction of the overall market.
In general, the major indexes are…
“Sitting in Limbo, but I Know it Wont Be Long,” (Jimmy Cliff. This song is from “The Harder They Come” album cover, from the days when cover art was real art, below…)

1. The Nasdaq 100: Bent But Not Broken
Source: TradingView. Through year-to-date 2025.
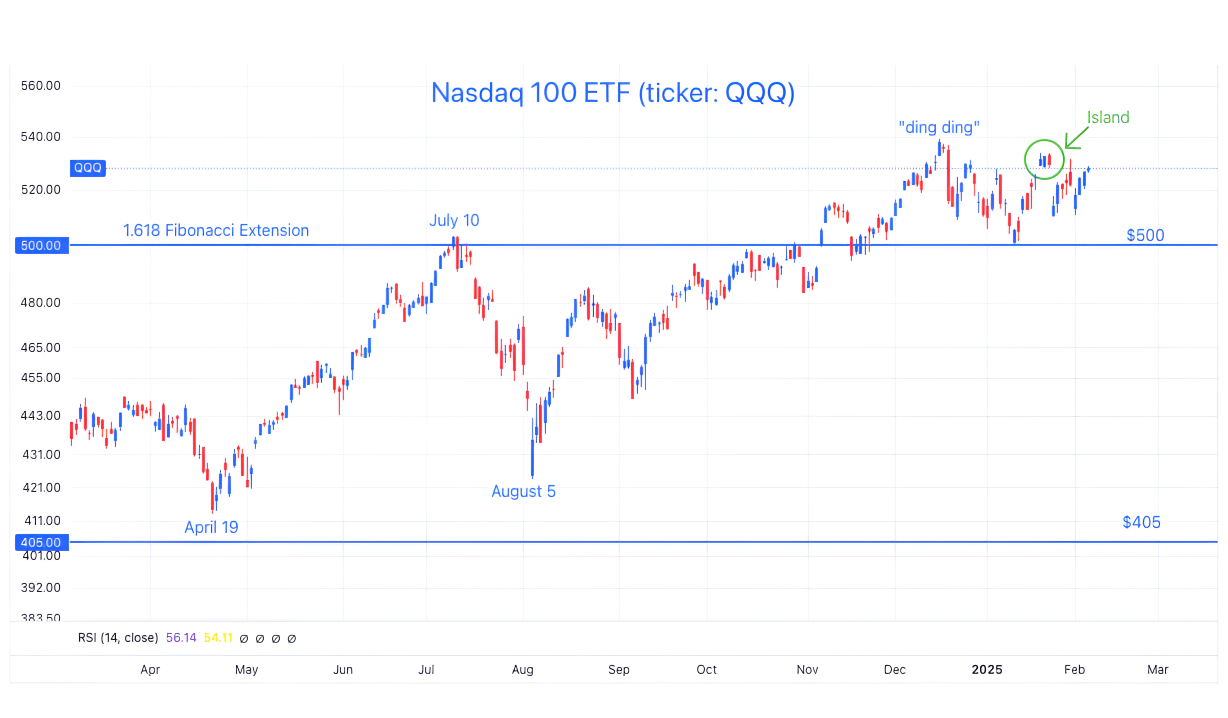
The chart above shows the Nasdaq 100 ETF (ticker: QQQ).
There are some notable differences from the chart of the S&P 500 that we showed on Tuesday (here) and the Nasdaq 100 ETF chart above:
Unlike the S&P 500, the Nasdaq 100 has not made it back to its mid-December high (“ding ding” on the chart).
As we highlighted last week (here), the Nasdaq 100 formed an “island” pattern. The pattern has not yet been confirmed as bearish (as many island formations are) but it has not been invalidated either.
That said, similar to the S&P 500, the Nasdaq 100 has been spending time moving sideways in it’s post election range. In the case of the Nasdaq 100 ETF, this has been above $500.
The Nasdaq 100, like the S&P 500, has been able to withstand DeepSeek, potential tariffs, disappointing results from Google and other news that in other environments may have had a more negative impact.
As we wrote in the introduction on Tuesday: “If the market or an asset does something you wouldn’t expect given the conditions, it’s important to pay attention.”
We have been paying attention to the resilience of this market.
Despite our concerns with respect to fundamentals and valuation, the underlying strength (or absence of significant weakness) needs to be respected.
For now, on the Nasdaq 100 ETF, we are focused on two levels: 500 (the post-election floor / 1.618 Fibonacci extension) and 538 (the post election high).
A convincing move above or below either of these, confirmed by other factors will have our attention.
(This is not a recommendation to buy or sell any security and is not investment advice. Past performance is not indicative of future results. Please do your own research and due diligence).
2. The Dow Jones Transportation Index as a Signal

Source: TradingView. Through year-to-date 2025.
The chart above shows the Dow Transportation Index.
On Tuesday, we showed the Dow Industrials Index.
“Dow Theory” is one of the earliest adopted technical signals and says that a new high in the Industrials Index needs to be “confirmed” by a new high in the Transport Index to warrant conviction in the overall strength of the market.
From an economic perspective, the idea is that we want to see both that goods are being produced (historically the industrials) and that raw materials and finished products are being shipped (the transports).
Although we don’t limit ourselves to the Dow Industrials and Transports, conceptually, the idea of confirming moves higher by viewing other indicators and relationships is how we approach our market views.
All of that said, in early December, when the Dow Industrials were hitting new highs, it coincided with new highs in the Transport Index and it proved to be a false indicator.
Since their respective early December highs, the Dow Industrials have exhibited more strength than the Transports.
The Transportation Index has fallen back into its 2021 - 2024 range and now finds itself fighting with its sub-ceiling (dashed blue line).
We are watching to see if the Transportation Index can make another move above its November 2021 to November 2024 ceiling (higher solid blue line).
If that were to occur in conjunction with a new high in the Dow Industrials, we would see it as a sign of broad market strength.
(Past performance is not indicative of further results. This is not a recommendation to buy or sell any security and is not investment advice. Please do your own due diligence).
3. Semis vs. the S&P 500: An Update

Source: TradingView. Through year to date 2025.
The chart above shows the Semiconductor ETF (ticker: SMH) relative to the S&P 500.
We last showed this chart two weeks ago (here) and referred to it as one of the market signals we were watching to determine the overall market character and direction.
When we last showed the chart, it was shortly after the release of DeepSeek and we noted that the relationship between Semiconductors and the S&P 500 had fallen through its 2024 floor.
The Semiconductors relative to the S&P 500 have now moved back up to “retest” the floor. (Similar to a chart moving above a ceiling level and coming down for a “retest”).
Can Semiconductors outperform and push this relationship higher to invalidate the drop through the floor?
Or, will the Semiconductors relative to the S&P 500 touch the floor level from below and collapse?
As we said - we see this relationship as a market barometer, and we will continue to watch and update.
(Past performance is not indicative of future results. This is not a recommendation to buy or sell any security and is not investment advice. Please do your own due diligence).
4. Financials: A Sector of Strength, but Approaching Our Target

Source: TradingView. Through year-to-date 2025.
The chart above shows the Financials Sector ETF (ticker: XLF).
We showed Financials two weeks ago (chart 2 here).
As Financials are approaching the target we established in November (chart 2 here), we view this as an significant level in one of the strongest charts we’re watching and wanted to highlight the chart again.
In general, it’s healthy for the market (and the economy) when Financial shares are moving higher.
From a fundamental perspective, earnings in the Financial sector were strong.
A significant earnings driver for the larger financial institutions in the last quarter was “net interest income.” This is essentially the money that banks earn on their deposits by “lending” to the Fed (overnight).
As banks receive the Fed Funds rate for their deposits, the fact that the Fed raised rates significantly and has been lowering them more slowly than previously thought is bullish for bank earnings.
In addition, as a recession has been priced out of most economic forecasts and the prospect for growth has increased, expectations for banks’ ability to lend has improved.
In other words, there continues to be a positive fundamental backdrop for the banks.
As the Financials move towards our “symmetric” target at $52.50, we want to see how they react.
Will they break through, will they move sideways or will they drop?
(Past performance is not indicative of future results. This is not a recommendation to buy or sell any security and is not investment advice. Please do your own due diligence).
5. Brazilian Real at an Important Level

Source: TradingView. Through year-to-date 2025.
The chart above shows the Brazilian Real (BRL) / US dollar cross from mid- 2020.
As I write every time I show this chart (the last time was here): although I have spent considerable time in Brazil (and I love the country), it would be naive of me to say that I understand all of the factors that feed into the Brazilian Real (BRL) / US dollar exchange rate.
Our view (based entirely on the chart) has been that the Brazilian Real would weaken.
As the Real exited its 2020-2024 (4.85 - 5.75) range our thesis seemed to be correct.
Now the Real is re-testing the top of the range.
We see this as a key area.
If it bounces, and the new higher level is confirmed (above 5.75), we would expect 6.45 as the next target based on the longer-term cup and handle formation (shown here) and 6.65 the longer-term target based on symmetry (revised lower from 6.70).
If the Real falls through the ceiling, we would expect strength back to the 5.40-5.45 area (middle blue line).
(Past performance is not indicative of future results. This is not a recommendation to buy or sell any security and is not investment advice. Please do your own research and due diligence).