


The Union of the Snake...
When your mother, son and wife each ask about a new technology, it could be a sign of a seismic shift. What's the reality? What are the implications? Does it change our view? Let's dig in...

For those that have been focused on other topics, on the eve of the Lunar and Chinese New Year of the Snake, within the financial community, it’s been all DeepSeek all of the time…
I will try to provide a summary of the most important characteristics of DeepSeek and go through what we believe are the implications.
To provide context, he first thing to remember is that if we were to look back at the US equity market in 2024, it was nearly completely driven by AI including the required data centers and energy infrastructure.
On January 9 (here), when we reduced our equity exposure by 10-15%, we wrote:
“What if a the hyper-scalers that are spending $250 billion on AI capex announce or are forced by the market to announce that they are slowing spending?
With one hiccup in the spending cycle, we could see a re-rating of the whole data center eco-system from chips, to modular nuclear power infrastructure, to cooling systems to data center REITs.
As a reminder, the AI trend and the adjacent beneficiaries represented a disproportionate portion of US equity returns in 2024.”
One week later (here), we wrote:
“The biggest risk to earnings, in our view, is that we have a “metaverse moment.”
As a reminder, in late 2021, investors began to push back against Facebook because of what they considered to be too much spending on the metaverse without the prospect of returns.
The hyperscalers are spending over $250 billion in 2025 on data center capex with limited incremental revenues that we can see. (I don’t see co-pilot driving Microsoft’s results, but maybe I’m wrong).
If investors once again push back - as they did with Facebook and the Metaverse - and data center capex slows or declines, we would envision earnings, economic and market volatility.”
Last week, China-based AI lab DeepSeek introduced its first “reasoning” model, R1.
DeepSeek’s R1 challenges current AI models including Open AI’s GPT 4, Anthropic’s Claude and Xai’s Grok in terms of performance but there are significant differences:
- The training cost: $100M → $5M
- GPUs needed: 100,000 → 2,000
- API costs: 95% cheaper
- Can run on gaming GPUs instead of data center hardware.
Furthermore, it R1 is open-source, meaning it can be tested and used by anyone.
Now the conspiracies:
Did DeepSeek really achieve this for the cost it said? ("DeepSeek DID NOT 'build OpenAI for $5 million,'" wrote Stacy Rasgon of Bernstein.)
What sorts of chips the company had access to despite the effect of sanctions?
Was this a retaliation plan by the Chinese Government to “crash” the US AI hegemony?
But the real questions are:
Do companies need to spend hundreds of billions on vast data centers powered by hugely expensive chips from Nvidia and others?
If not, is the upgrade in power and US infrastructure that many considered necessary still required?
Do the hyper-scalers, whose valuations have been at a premium partially because of the promise of AI, still have a competitive advantage?
Was this the “metaverse” moment?
At first glance, this looks more like a rotation within equities rather than a broad based rotation out of equities.
On Thursday, we will highlight a piece we wrote a year ago that considered the transition from AI 1.0, Semiconductors and Infrastructure; to AI 2.0, proprietary data and software. (Clearly we were early.)
Happy Chinese New Year of the Snake to those that observe.
For us, the combination of the new year and DeepSeek might be “The Union of Snake.” (Duran Duran).

1. The S&P 500: No Major Trend Change
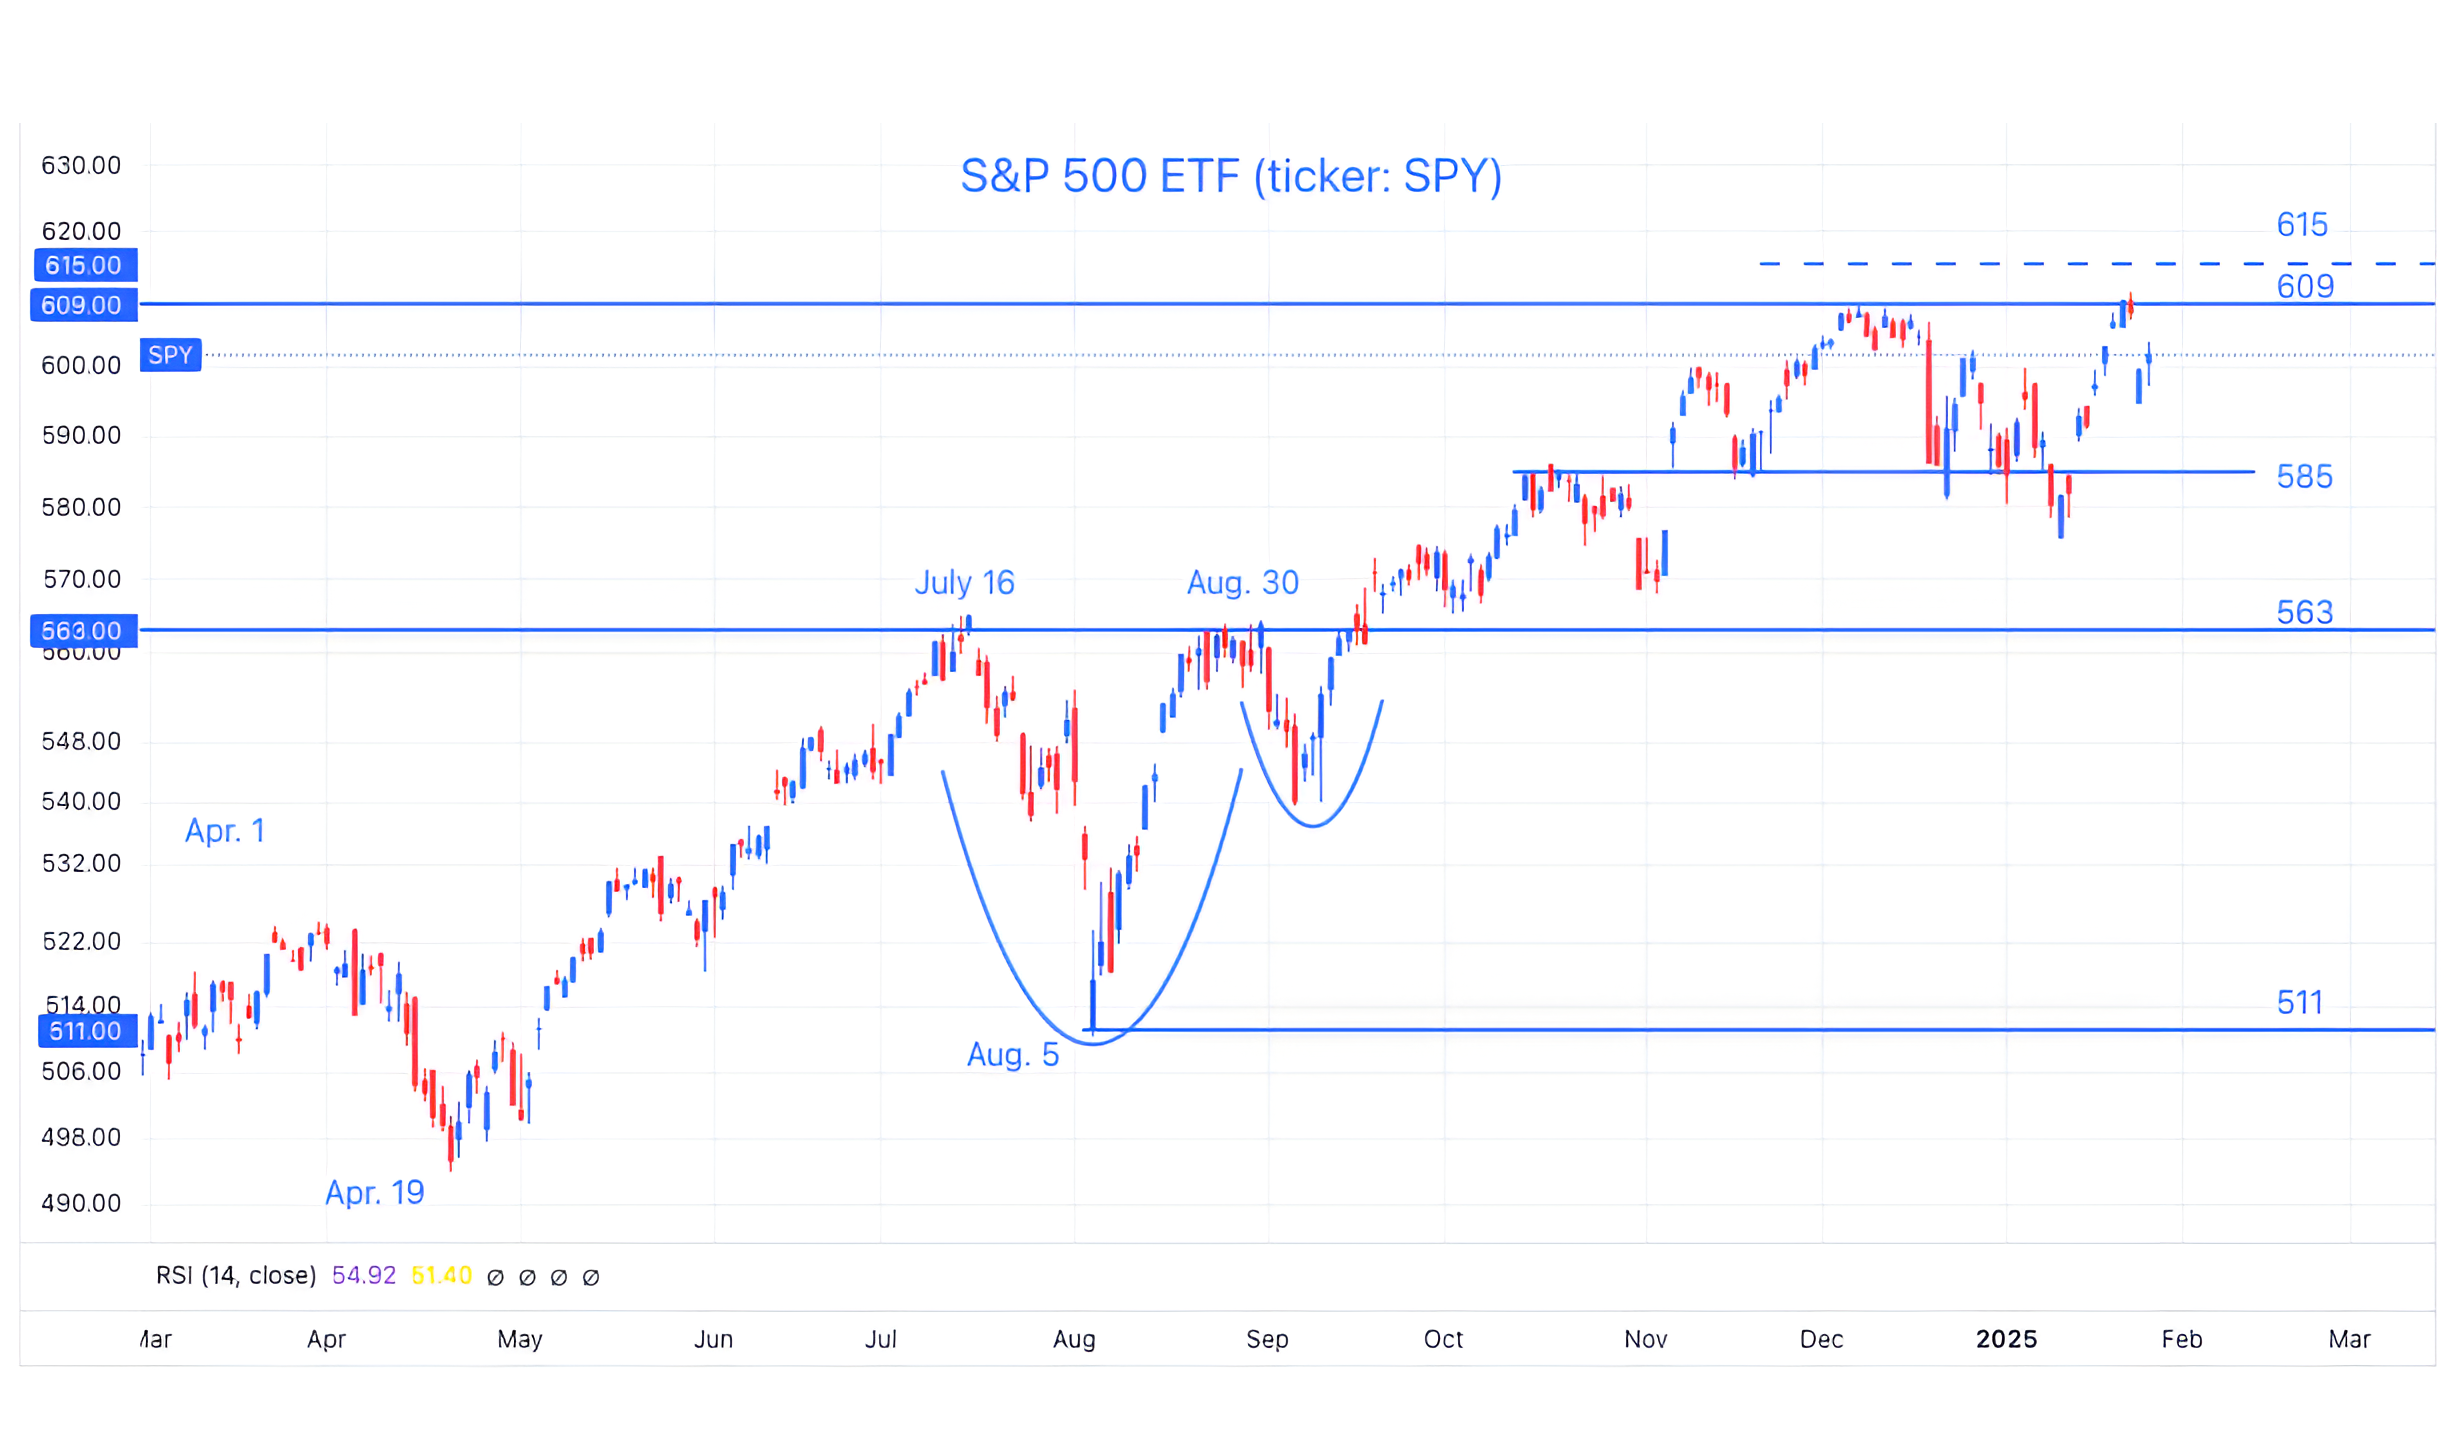
Source: TradingView. Through year-to-date 2025.
The chart above shows the S&P 500 ETF (ticker: SPY).
When we showed this chart last week (here), we highlighted the accelerated move higher off of the failed bearish “head and shoulders” formation. (We’re not showing the failed “head and shoulders” formation today).
Although the S&P 500 did achieve a new all-time high, it stopped 0.7% short of the 615 level that we highlighted.
Despite being slightly off with our target, our commentary, in retrospect, may have been accurate: “we believe that a move above the all-time high would potentially undo the “bearishness” that developed as the ETF fell from 609 to 575.”
The S&P 500 now finds itself in the middle of the post-election trend channel.
We will look for inter-market clues to determine whether the move out of the trend channel is likely to be to the north or south.
(This is not a recommendation to buy or sell any security and is not investment advice. Past performance is not indicative of future results. Please do your own research and due diligence).
2. Semiconductors Relative to the S&P 500: A Bearish Signal?
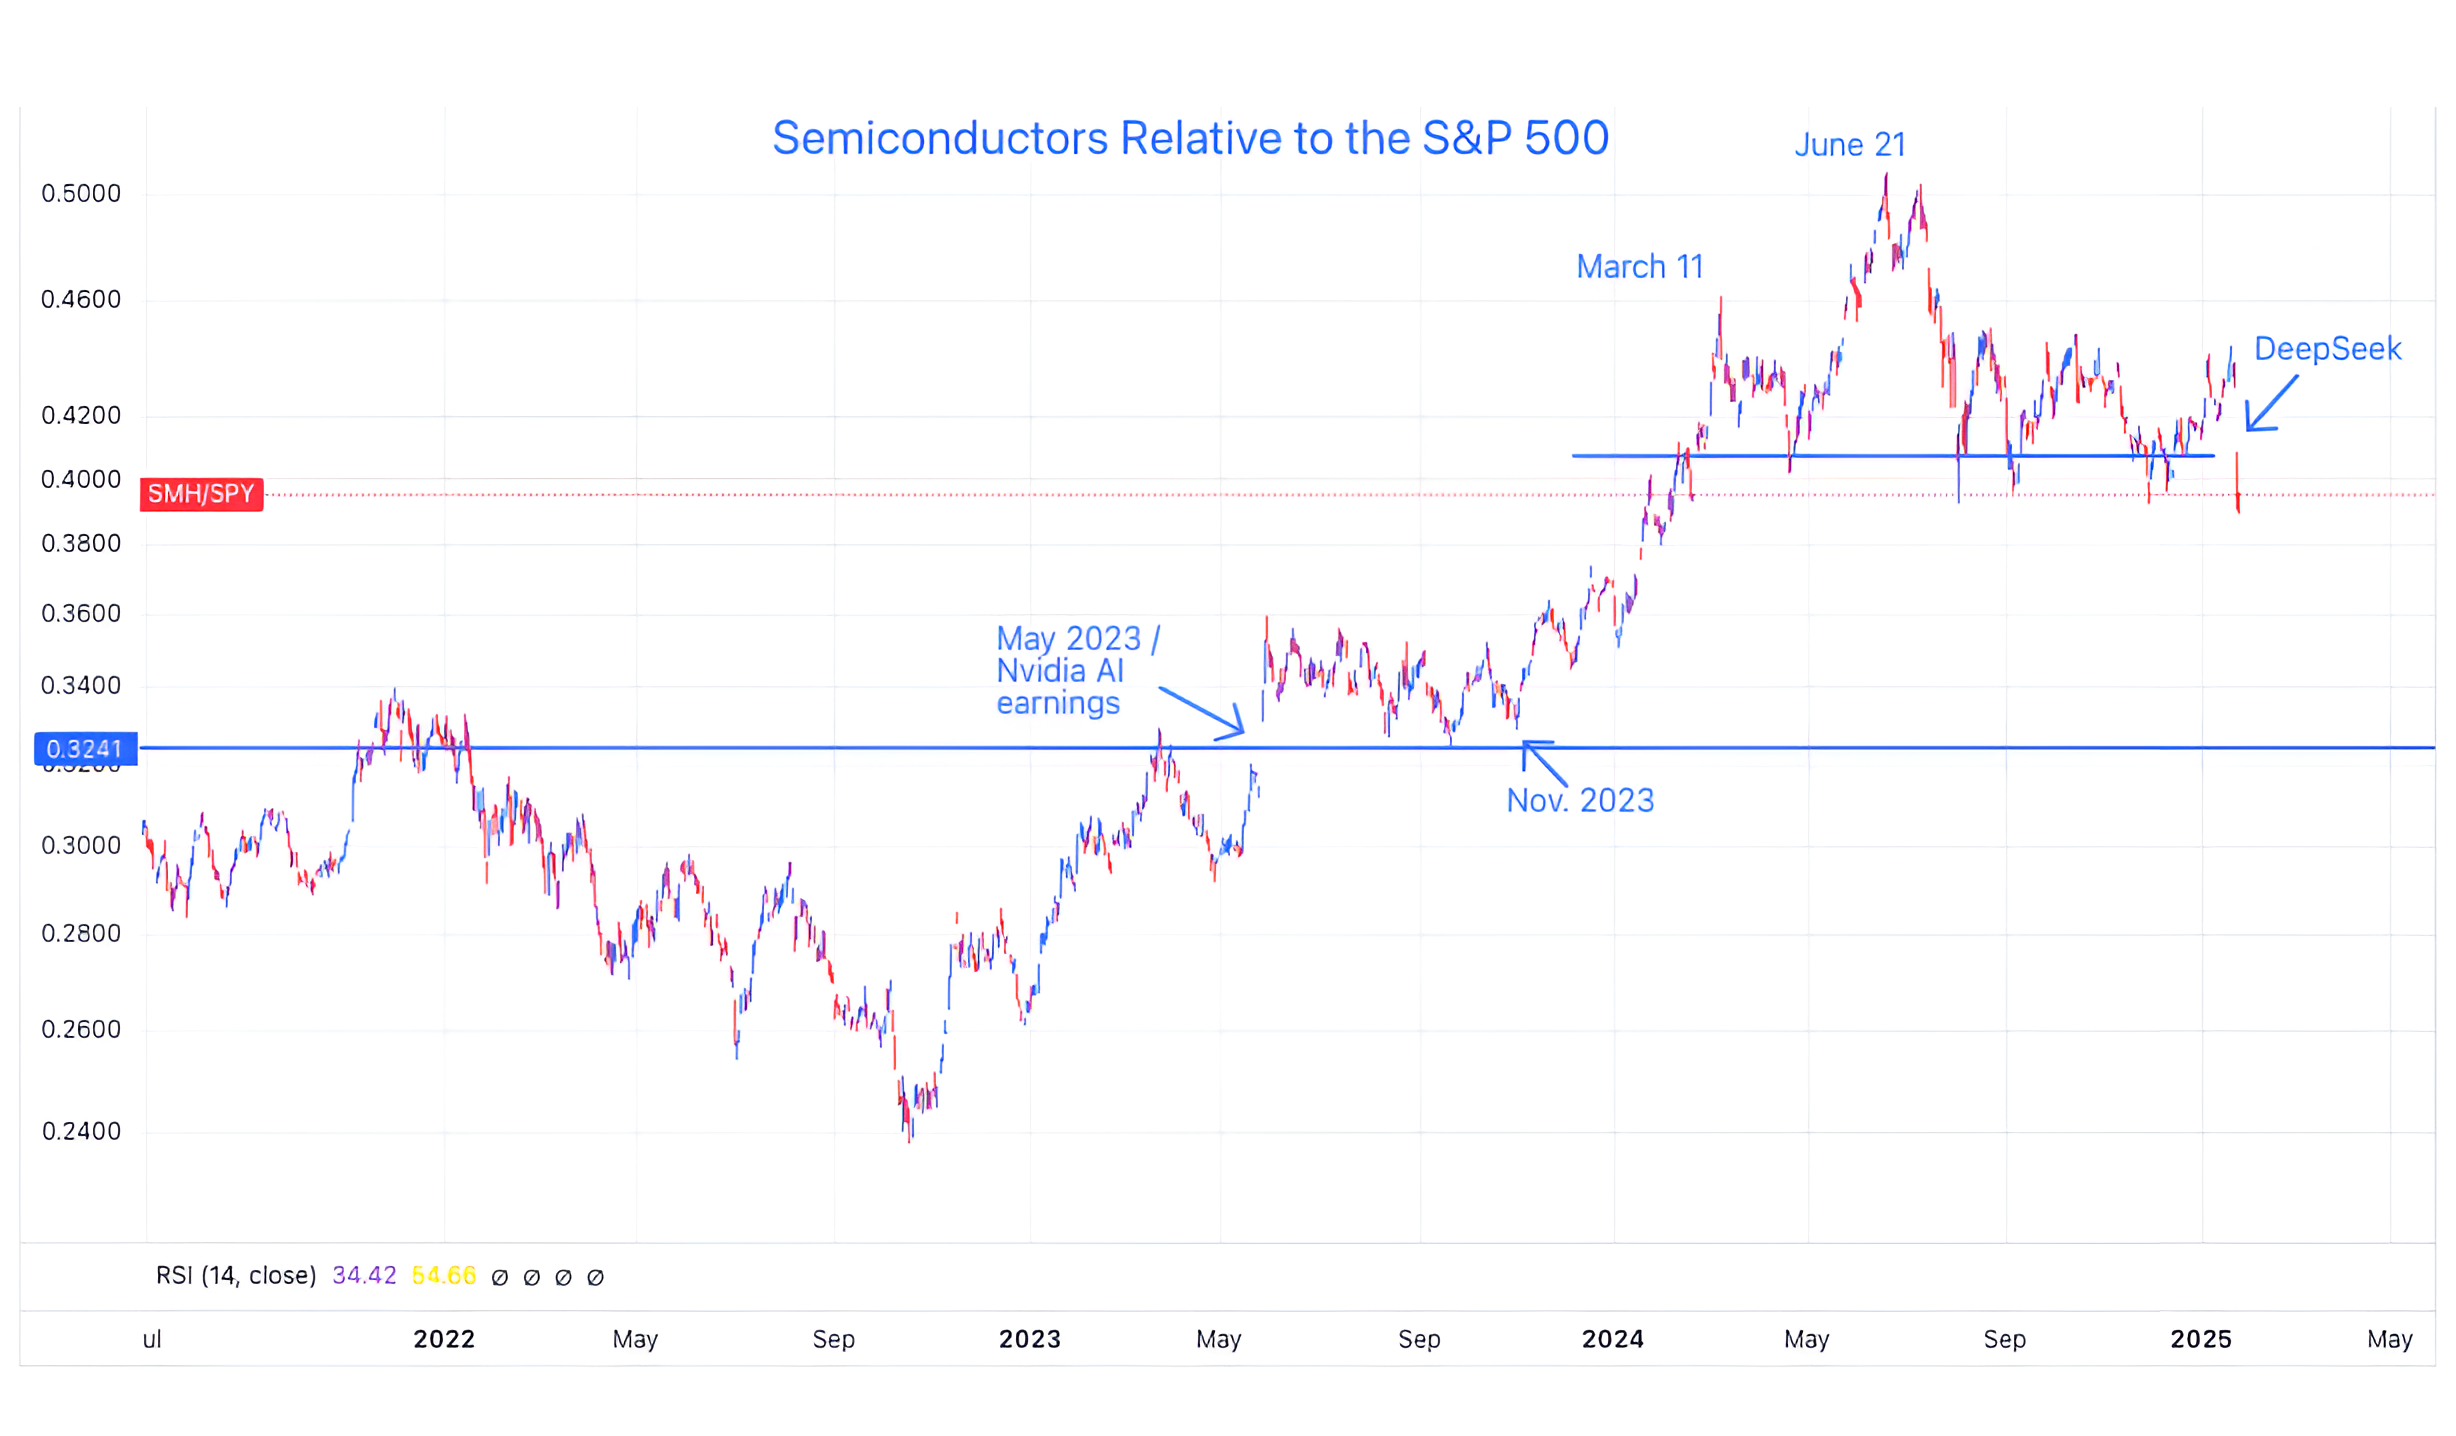
Source: TradingView. Through year-to-date 2025.
The chart above shows the Semiconductor ETF (ticker: SMH) relative to the S&P 500.
We last showed this chart on December 3 (here) and referred to it as one of the market signals we were watching to determine market character and direction.
At the time, we acknowledged:
“The recent peaks in the relationship between Semiconductors and the S&P 500 in March and June occured two to three weeks before the two periods of volatility in US equities this year (April and July).”
With important earnings and the Fed announcement (tomorrow) coming, could the break below the 2024 floor in the relationship between Semiconductors and the S&P 500 be an early warning sign of upcoming volatility in the broad market?
We will look for confirmation from other signals.
(Past performance is not indicative of further results. This is not a recommendation to buy or sell any security and is not investment advice. Please do your own due diligence).
3. A Quick Look at Earnings Season
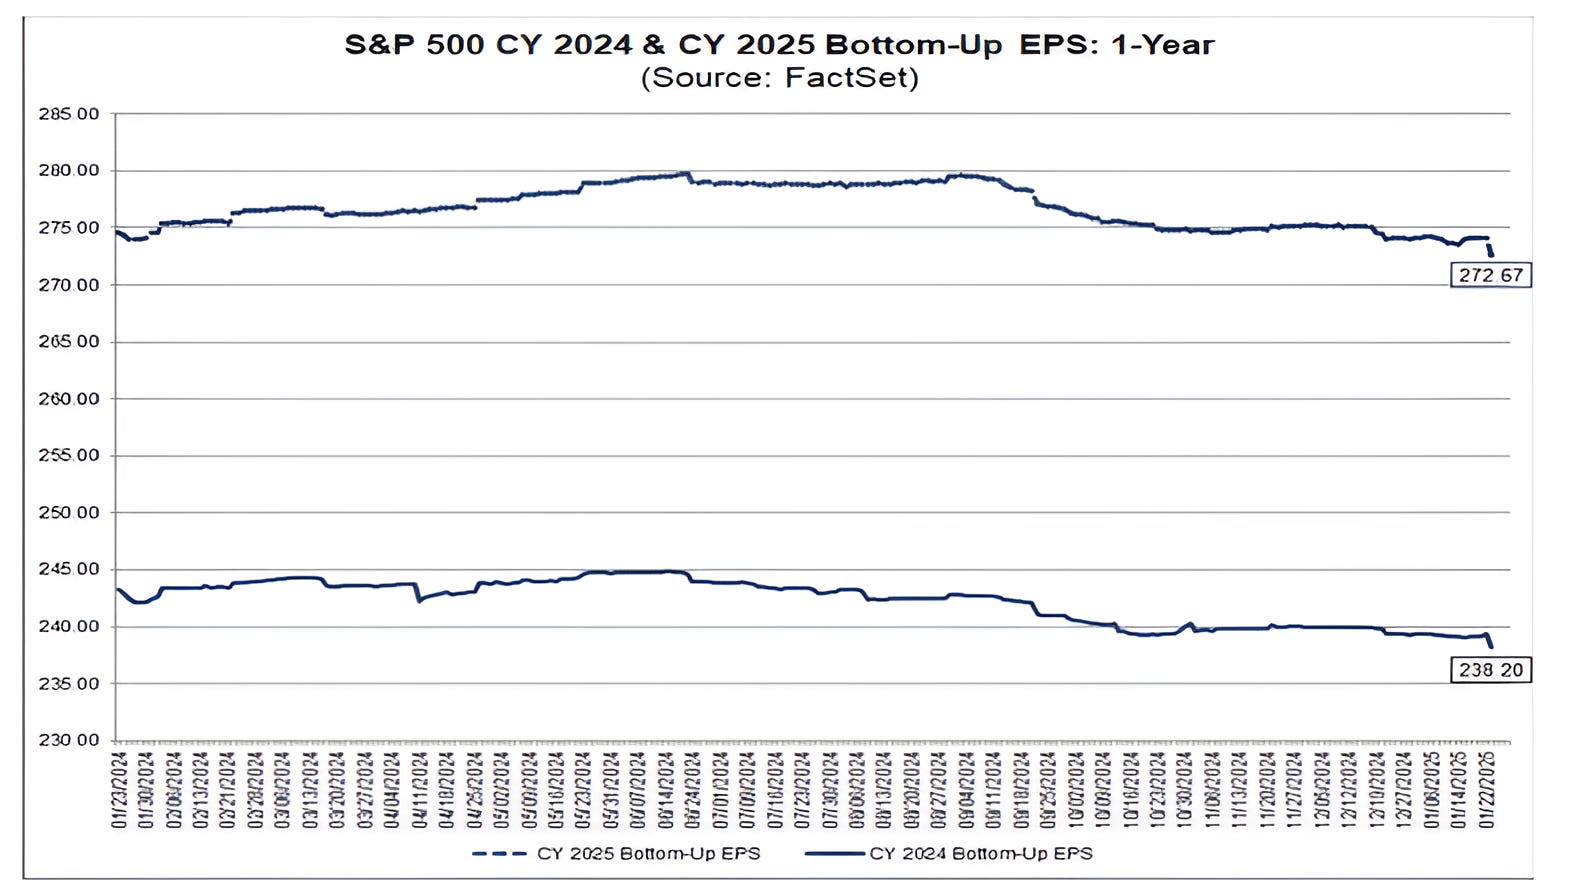
Source: FactSet. Through year to date 2025.
The chart above shows evolution of bottom-up S&P 500 earnings expectations for 2024 and 2025.
(Bottom-up earnings expectations take median analyst earnings per share for each company in the S&P 500, weigh them by each company’s weight in the index and track them over time).
We last looked at earnings in chart 2 here; and before that chart 4 here; see chart 3 here; chart 3 here; here; here; here; here; chart 3 here; chart 3 here; charts 2, 3 and 4 here; chart 3 here; and chart 3 here.
To be clear, I read the same things you do which has consistently been along the lines of “earnings season has been great” or “above expectations.”
However, when I look at the chart above and specifically the drop at the far right for both 2024 and 2025 earnings, it seems contrary to what I’ve read.
This is why we show the charts and look at the data.
We will continue to look at various earnings metrics throughout earnings season.
From a valuation perspective, based on $273 in 2025 earnings and a current price of 6050, the S&P 500 is trading at 22.1x forward earnings.
In my view, we can go up to 23x forward earnings (to about 6300) in the near-term (not a target) before there would be very little remaining upside. This would require earnings expectations to remain stable at about 13-14% growth.
We still see upside as constrained based on fundamentals.
(Past performance is not indicative of future results. This is not a recommendation to buy or sell any security and is not investment advice. Please do your own due diligence).
4. The Liquidity Bazooka 2025

Source: Strategas. Through year-to-date 2025.
The chart above shows the Treasury General Account.
The Treasury General Account has been one of the tools that we believe Treasury Secretary Yellen used to provide liquidity to the economy and market to offset the impact of higher Fed Funds rates and quantitative tightening.
Combined with using Reverse Repos and issuing shorter-term rather than long-term debt, accessing the Treasury General Account has been central to what we have called stealth liquidity.
(See here, here, here, here, here, here, here, chart 4 here and here).
This has been one of our major themes and, stealth (or non-traditional) liquidity from the Treasury that has offset Fed tightening, in our view, is a core reason why the S&P 500 has moved up 20%+ in each of the past two years.
What the chart above shows is that at least the Treasury General Account portion of the Stealth Liquidity Bazooka has been reloaded.
This is right in time for the Treasury Secretary Bessent (confirmed yesterday) to access it as the debt ceiling has once again been hit.
If Treasury Secretary Bessent drains the Treasury General Account in the face of the debt ceiling like Treasury Secretary Yellen did, the liquidity could provide significant support for the equity market.
(Past performance is not indicative of future results. This is not a recommendation to buy or sell any security and is not investment advice. Please do your own due diligence).
5. The Year of the Snake….
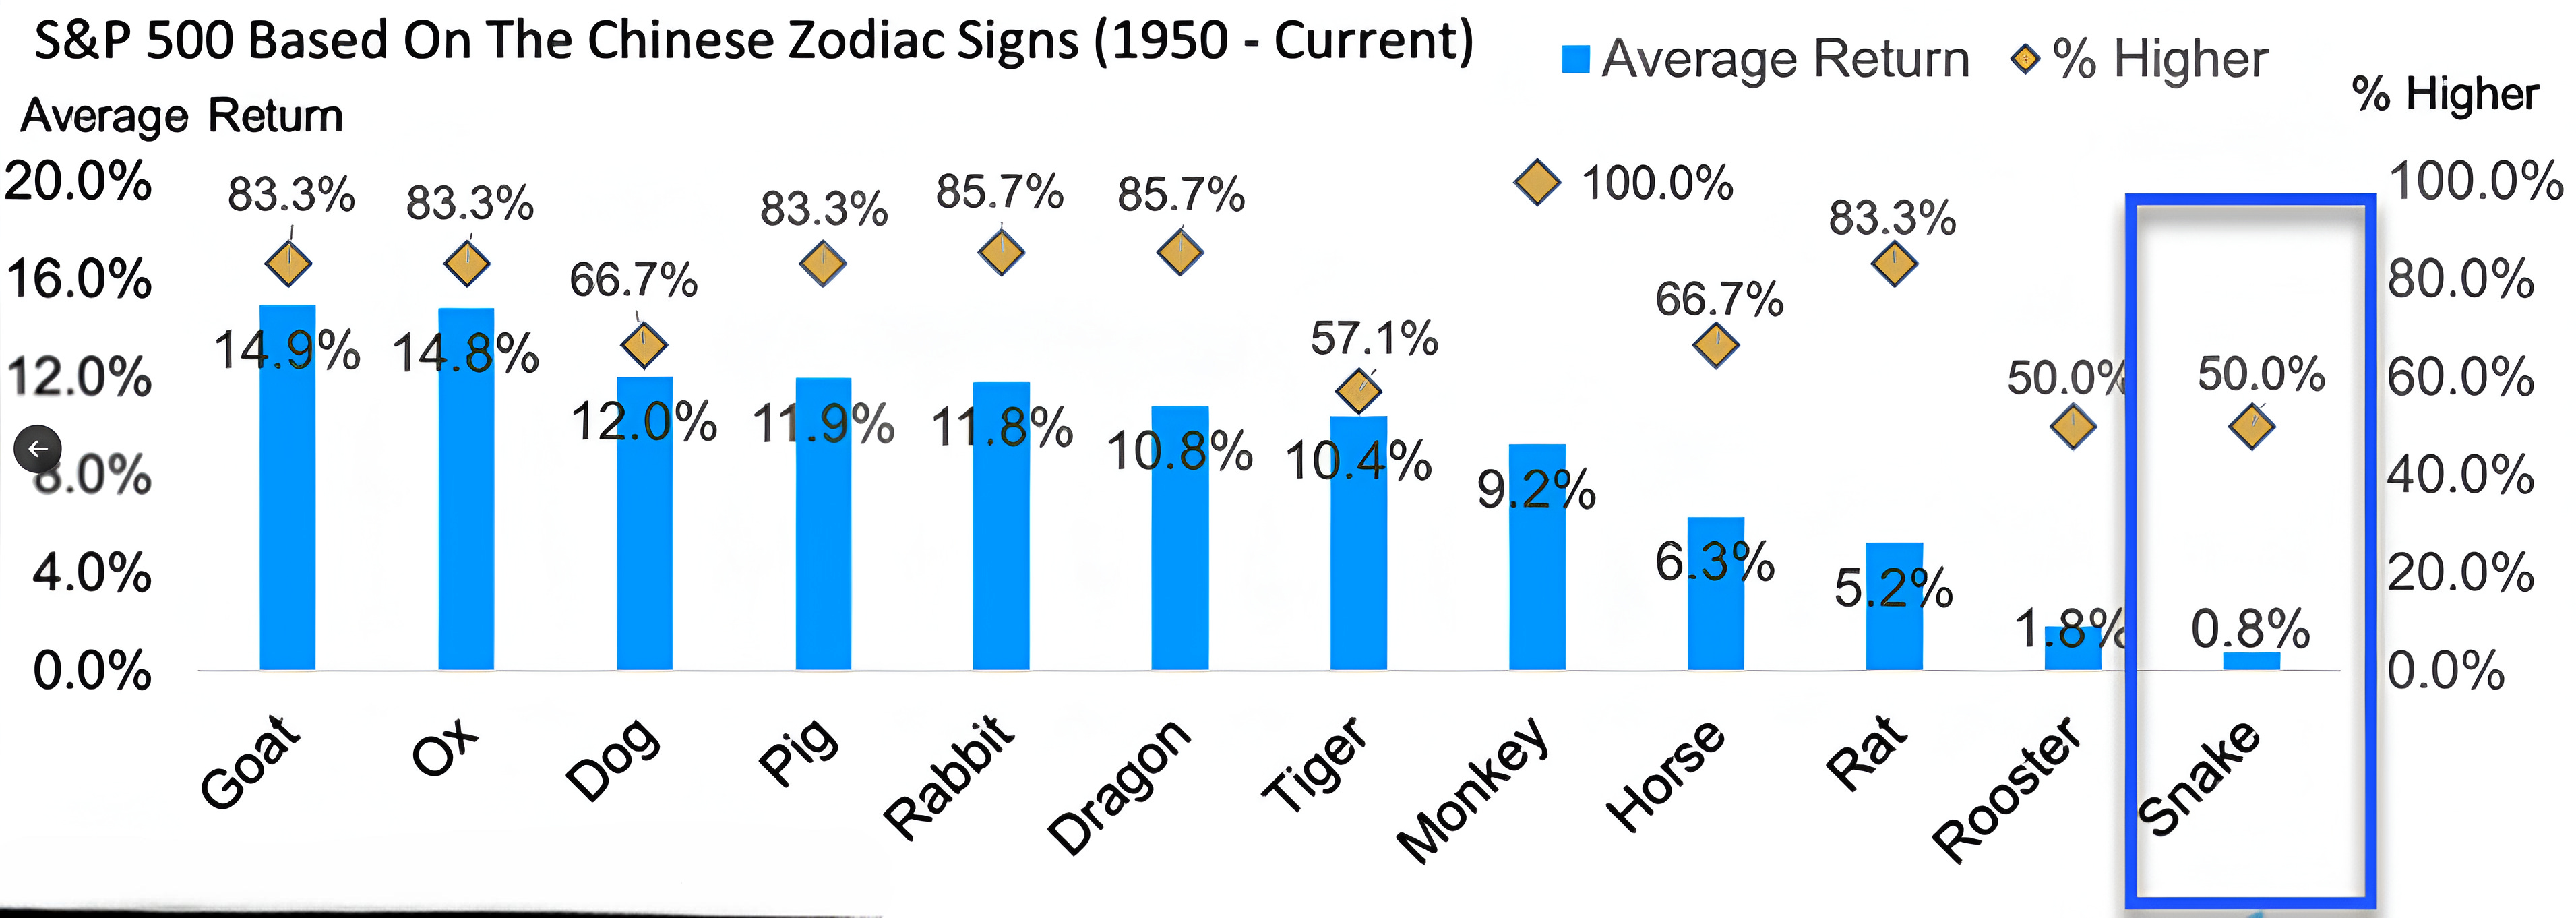
Source: Carson Investment Research / Ryan Detrick. Through year-to-date 2025.
The chart above shows the S&P 500 returns and frequency of positive returns from February to February based on the 12 years of the Chinese Zodiac.
Tomorrow marks the beginning of the Year of the Snake.
The Year of the Snake has historically had the lowest returns and is tied for the lowest percent of positive returns in the Chinese Zodiac.
We would not make investment decisions based on this.
(Past performance is not indicative of future results. This is not a recommendation to buy or sell any security and is not investment advice. Please do your own research and due diligence).