


Mysterious Ways
Is the AI super-cycle set to lead US equities into another 1990s boom? While the S&P 500 and Nasdaq 100 are fighting with their all-time highs, the Equal Weight Nasdaq 100 is rallying. Let's dig in...

This is a complicated investment environment.
US equities remain expensive, but continue to flirt with, if not achieve, record levels.
With the transition in US leadership, whether you agree or disagree with policy, there has been an increase in macro uncertainty.
Typically, in our view, uncertainty has been expressed through valuation. Not in the current environment.
As we’ve written several times, when the market exhibits strength in the face of what could be perceived as challenging news, it often pays to listen.
Over the weekend, JP Morgan wrote:
“the risk of being a serious bear on US mega-cap tech is still considerably higher than the risk of being a bull….if you were one month early in calling the top of the tech bubble circa March of 2000, the Nasdaq 100 rallied 13% against you, if you were three months early, it rallied 31% and if you were six month early, it rallied a full 94%.”
While it would be easy to file this in the “things you hear (or read) near the top,” we have tried to respect the strength in the current environment, particularly given the questionable news (and fundamentals).
It is notable in our view, that JP Morgan referencing the dot-com bubble as a reason not to sell.
On Tuesday, we showed the market analogy between today, with the launch of Open AI 27 months ago and the launch of Netscape the internet browser in 1994.
In many ways, the Netscape started the dot-com boom that persisted through a rate hike cycle (and subsequent soft-landing). Could the AI cycle be similar?
Rather than simply rely on fundamentals (earnings, earnings growth and valuation), we have taken many of our signals and direction from the market action.
Although we have been a little more defensive this year than last, we remain flexible in our outlook.
We recognize that the market works in…
Mysterious Ways

1. The Equal Weight Nasdaq 100: Bullish
Source: TradingView. Through year-to-date 2025.
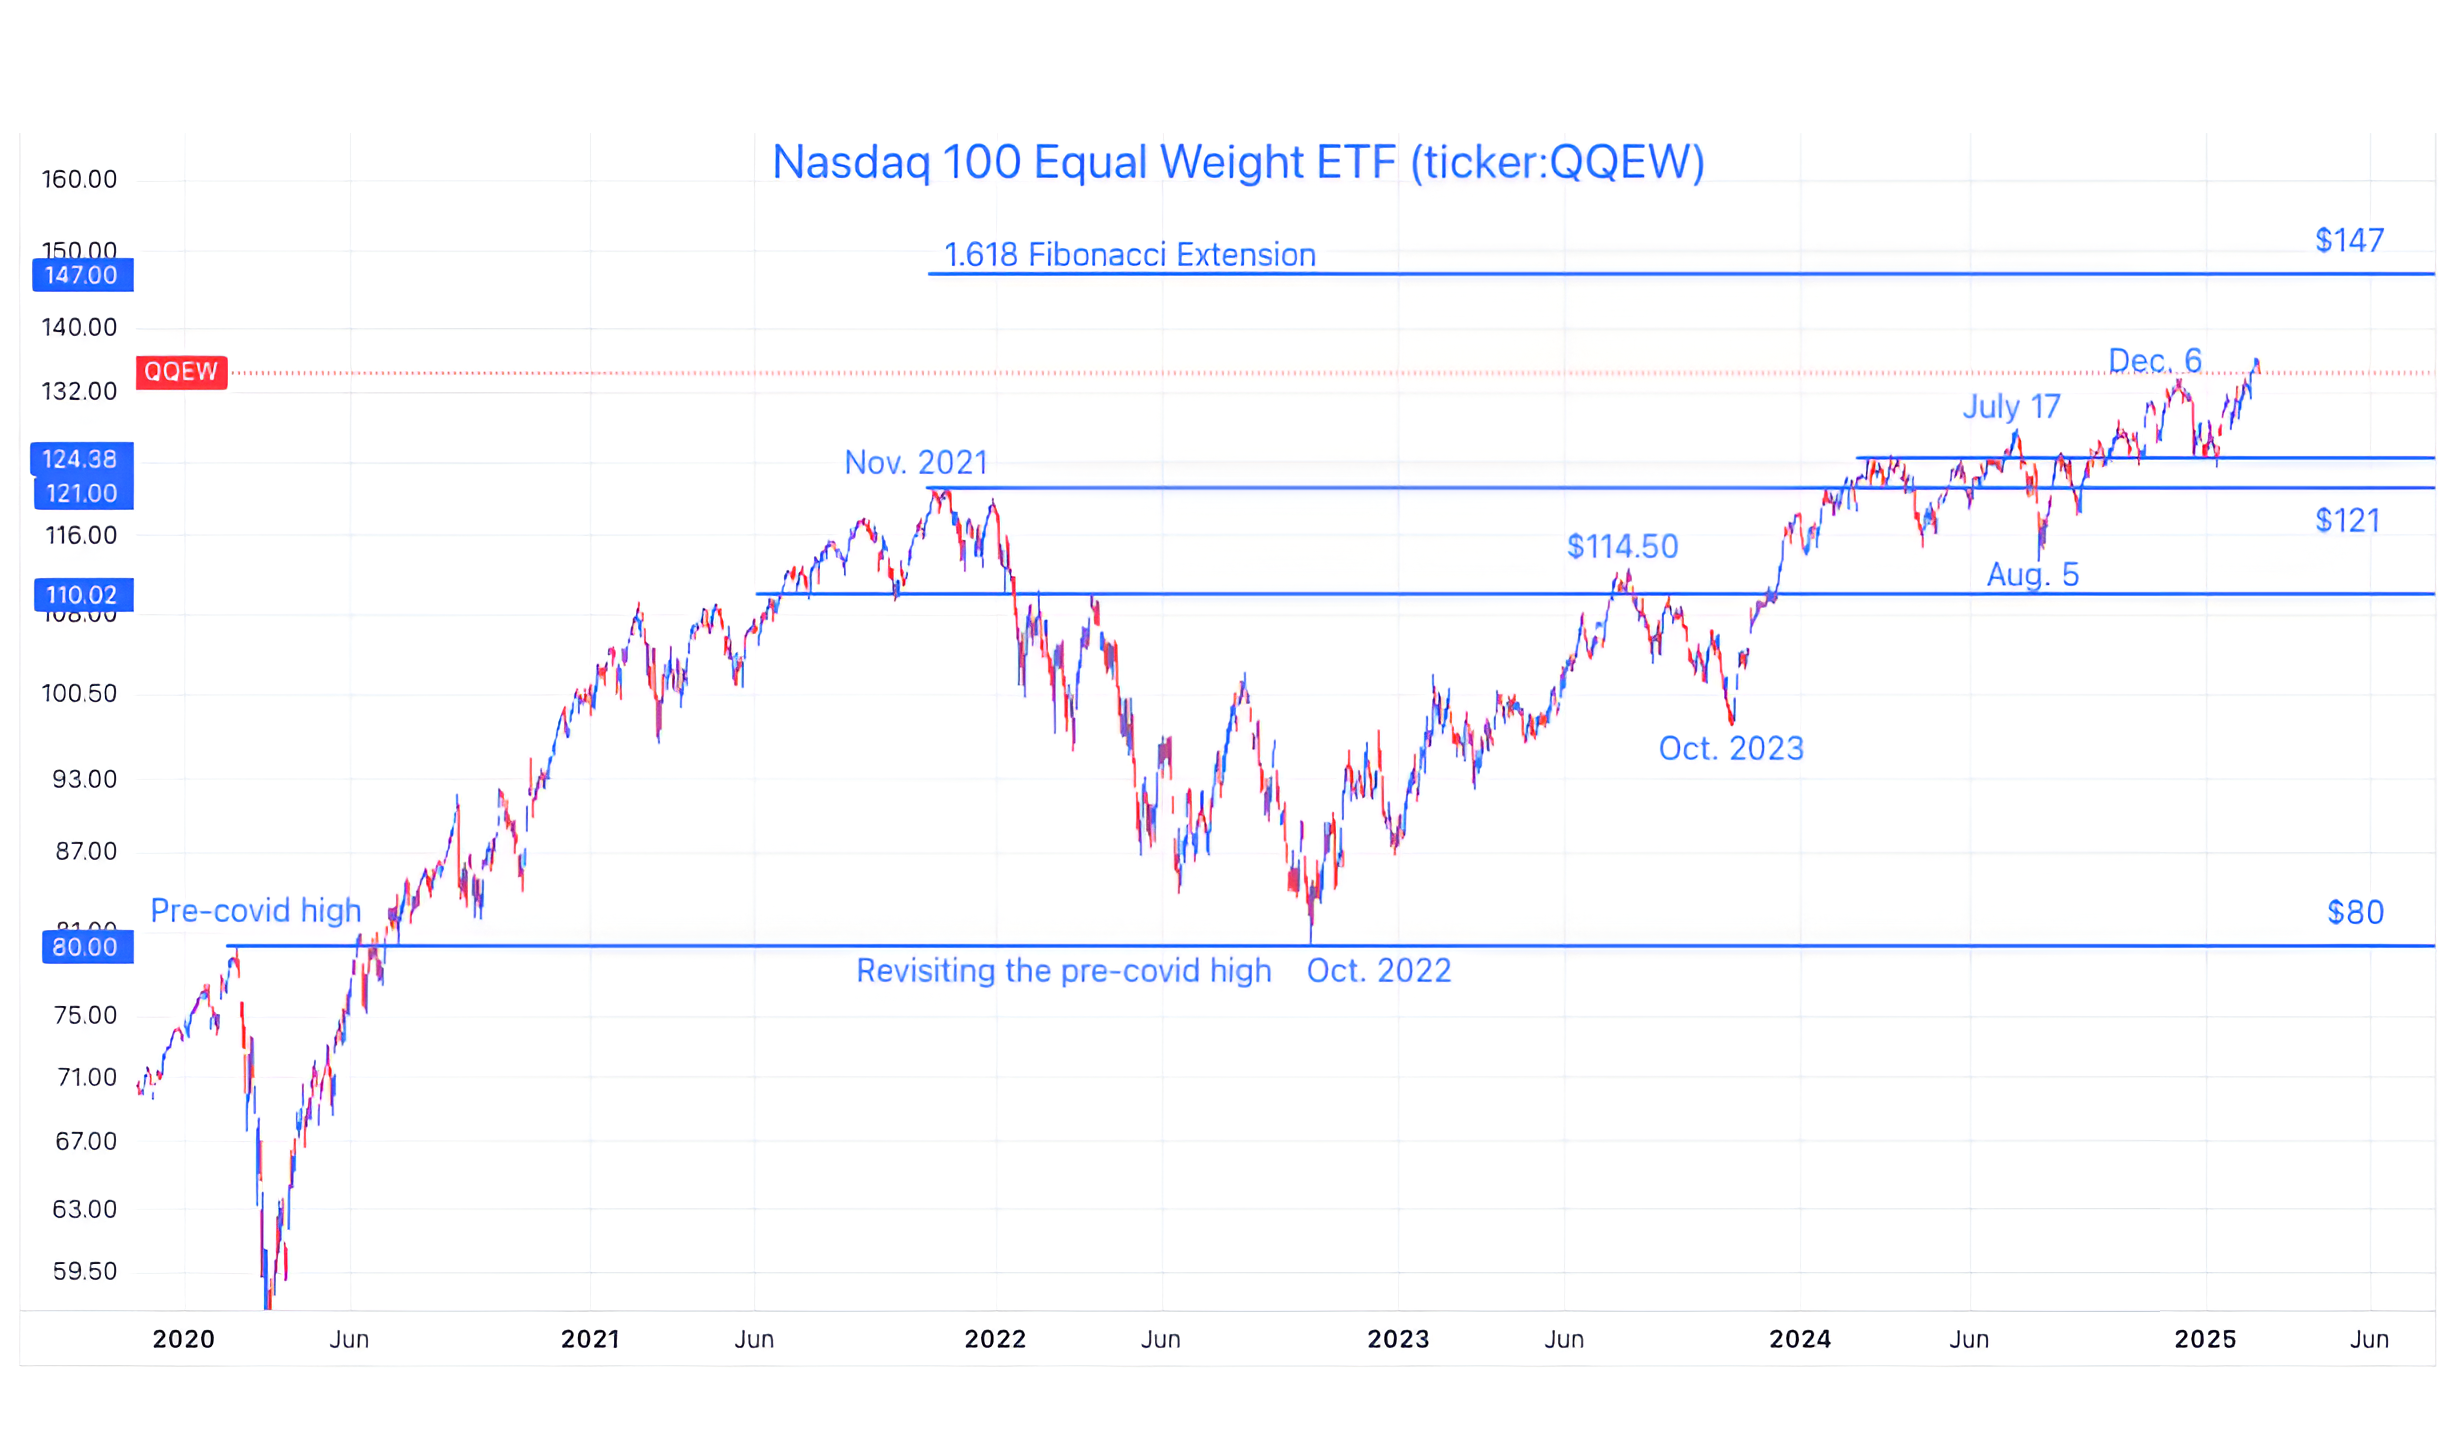
The chart above shows the Equal Weight Nasdaq 100 ETF (ticker: QQEW) since 2020.
We showed this chart in early August (chart 2 here) near the bottom of the largest sell-off of 2024 (11%).
At the time, we believed that recovery from the sell-off would be difficult.
However, as has been characteristic of US equities since their October 2022 low, their strength has been surprising.
In early December, the Equal Weight Nasdaq 100 ETF made a new high which coincided with the new highs in the Nasdaq 100 and the S&P 500.
What has caught our attention, however, is that yesterday, as the Nasdaq 100 basically hit its December high, the Equal Weight Nasdaq 100 made surpassed its December record in a move that we would characterize as more convincing.
Why is this notable?
Because this has happened without the Magnificent 7 (chart 3) and the Semiconductor stocks (chart 3 here) .
In other words, the Equal Weight Nasdaq 100 is moving higher based on the components and shares that we don’t often think or write about.
In our view, this may be the result of the trickle down from the hyper-scaler investment in data centers and the broad institutional investment on AI software.
This is the breadth or broader participation beyond the Magnificent 7 that we have looked for and felt was necessary for US equities to continue their ascent.
This is bullish - and is one of the more bullish charts in our work.
That said - this breadth expansion - is only present in the Equal Weight Nasdaq 100 and is not present in the Equal Weight S&P 500 (chart 2).
As the Nasdaq 100 and S&P 500 have been battling their respective December highs, we’ve been looking for signs and confirmation that they can resume their journey north - the Equal Weight Nasdaq 100 is one of the first signs that we have seen.
(This is not a recommendation to buy or sell any security and is not investment advice. Past performance is not indicative of future results. Please do your own research and due diligence).
2. The Equal Weight S&P 500 in Purgatory

Source: TradingView. Through year-to-date 2025.
The chart above shows the Equal Weight S&P 500 ETF (ticker: RSP).
When we showed this chart in early December (here) we wrote in bold:
“The Equal Weight S&P 500 ETF is now at our target.”
Our target had been the 1.618 Fibonacci extension of the 2022 sell-off or $188.
We are showing the chart today to highlight how different the Equal Weight S&P 500 ETF looks from the Equal Weight Nasdaq 100 ETF (chart 1).
When we have presented the Equal Weight S&P 500 in the past, we have generally characterized it as checking in on how the average stock is doing.
Whether it’s the Equal Weight S&P 500, the Russell 2000 small caps or even the mid-caps, the best we can say about the average stock right now is that they are inconclusive.
While we noted that the Equal Weight Nasdaq 100 was bullish in our view, right now, that bullishness has not transcended beyond those higher growth technology shares that, in our view, may be benefitting from the investment in data centers and technology.
We want to see if the Equal Weight Nasdaq 100 shares can lift the average stock or if the lackluster performance of the Equal Weight S&P 500 begins to drag the Nasdaq 100 lower.
(Past performance is not indicative of further results. This is not a recommendation to buy or sell any security and is not investment advice. Please do your own due diligence).
3. The Magnificent Seven Peaked Two Months Ago…
Source: TradingView. Through year-to-date 2025.
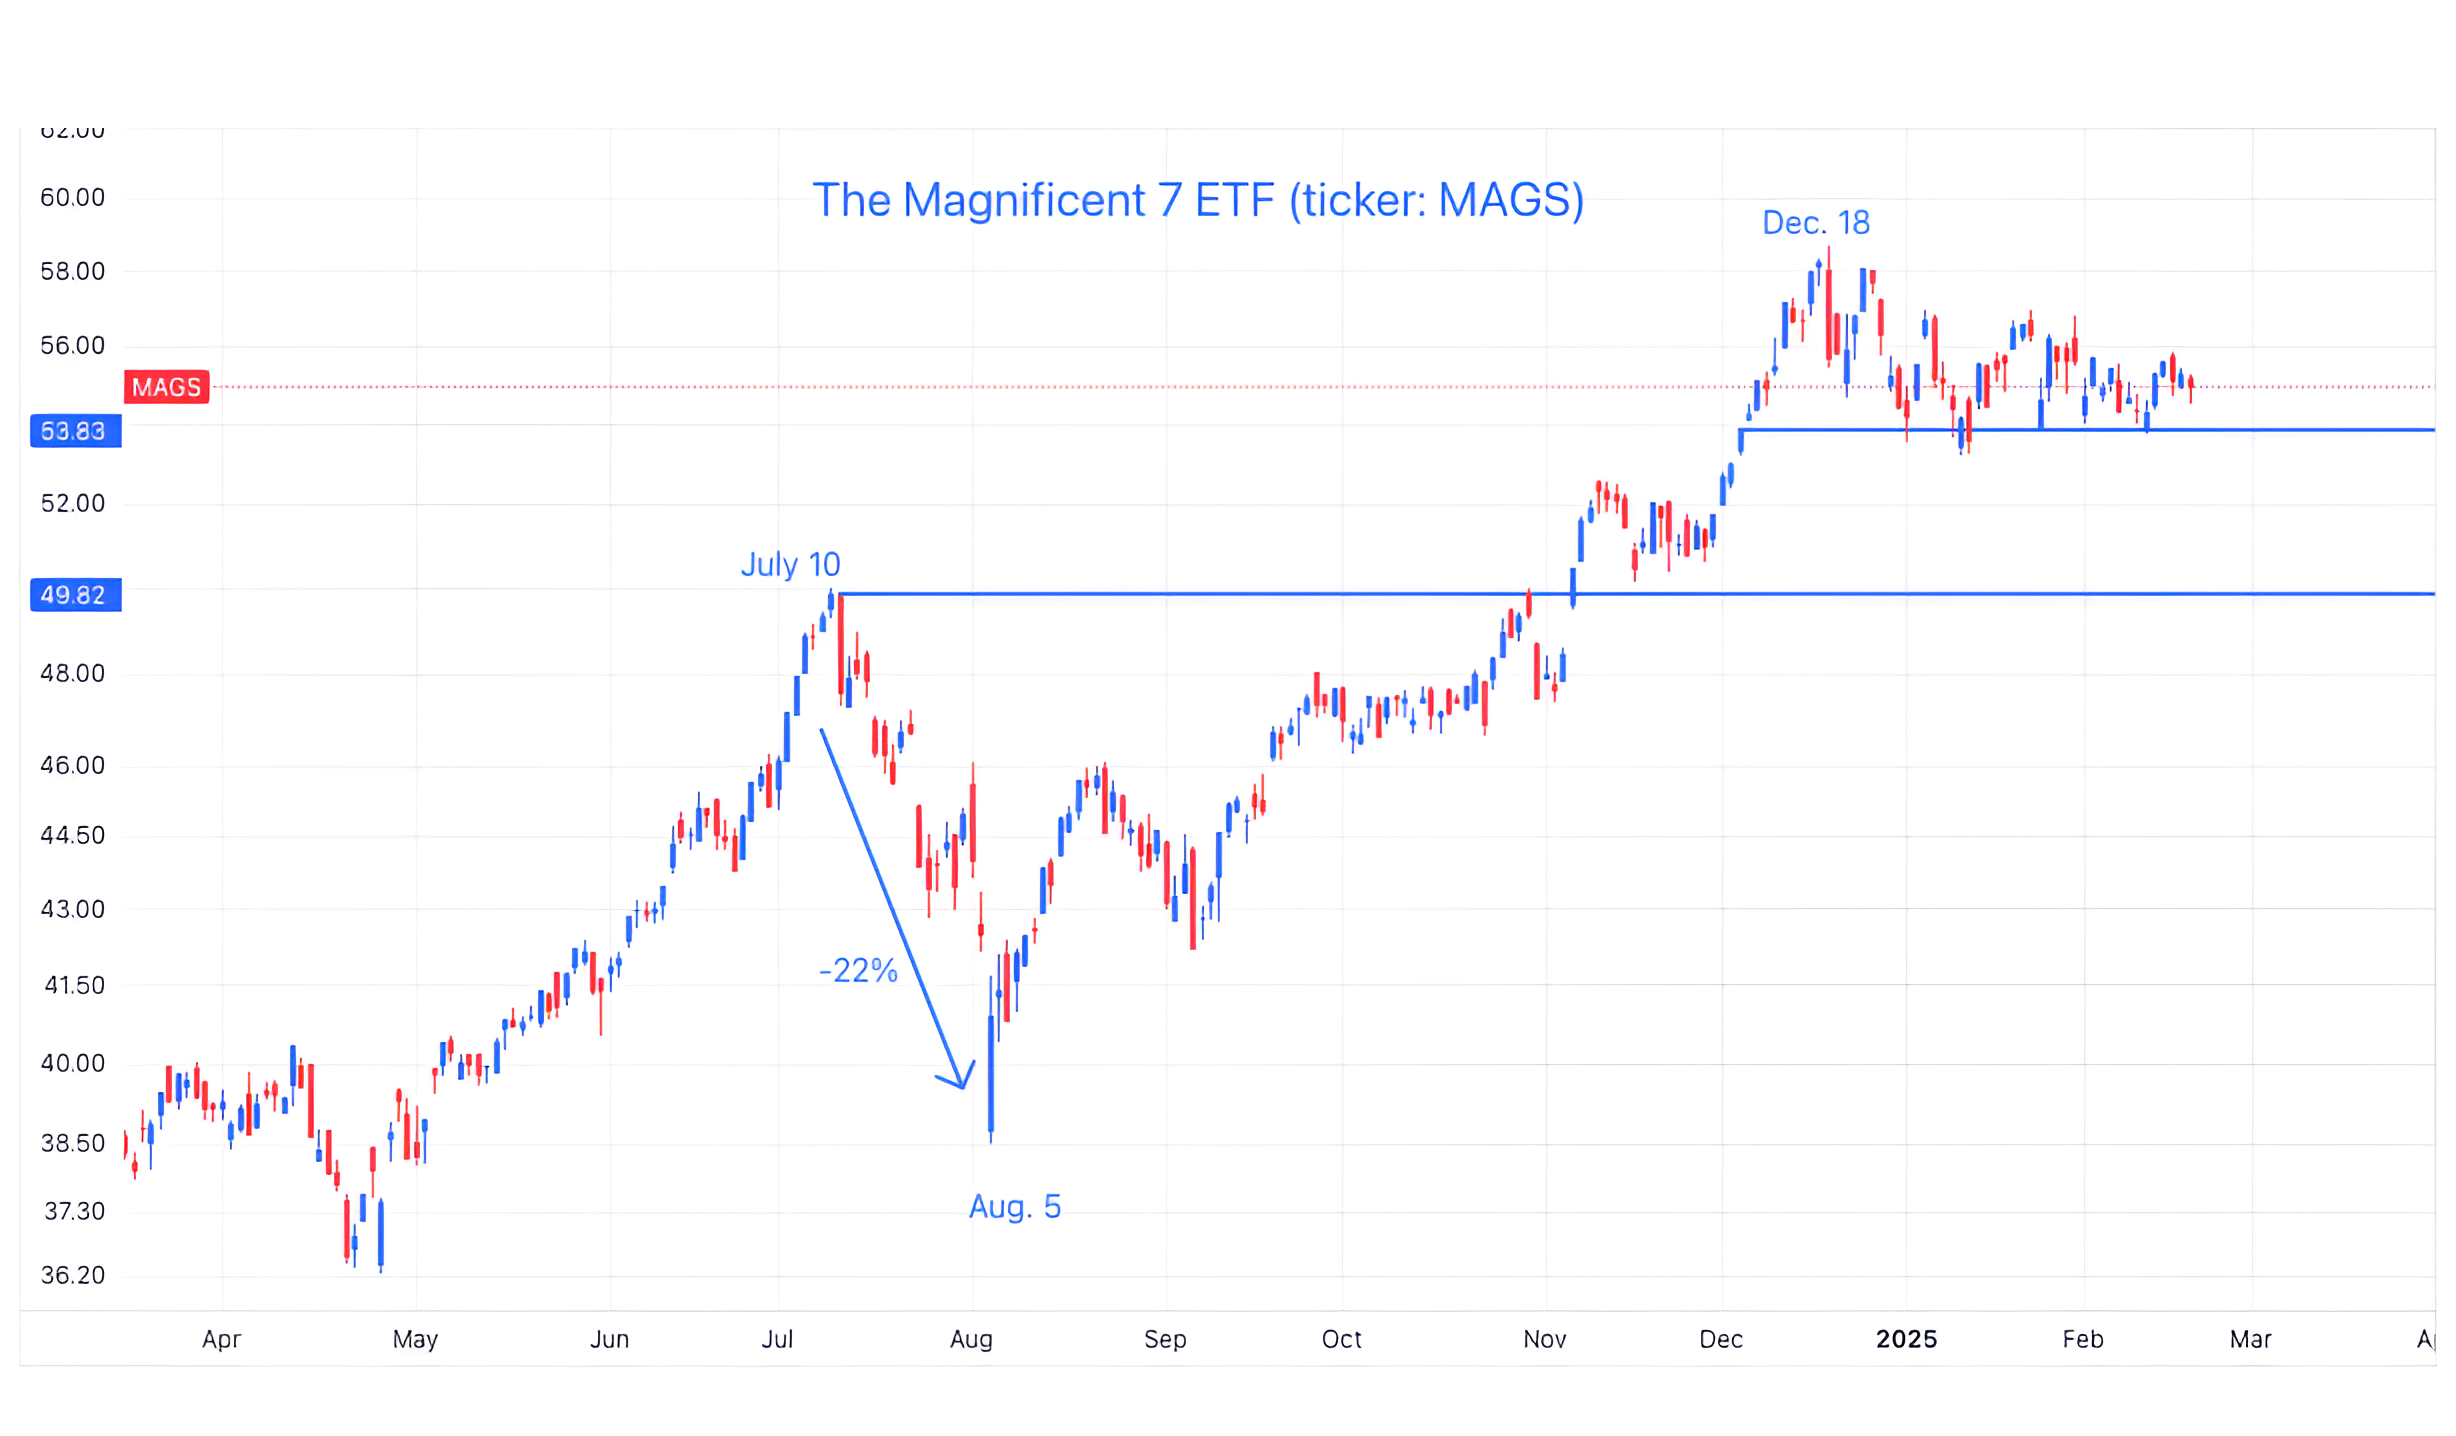
The chart above shows the Magnificent 7 ETF (ticker: MAGS).
Sometimes we like to show a chart as a response to “show us something we didn’t know.”
The Magnificent 7 peaked in mid-December.
It’s been two months since their peak.
Maybe you knew, I didn’t.
On Tuesday, we showed the Semiconductor ETF (ticker: SMH) (chart 3 here) which peaked in June / July.
Thinking back to chart 1 - it’s not Semiconductors or the Magnificent 7 - it is everything else that is bringing the Equal Weight Nasdaq 100 to a new high.
(Past performance is not indicative of future results. This is not a recommendation to buy or sell any security and is not investment advice. Please do your own due diligence).
4. A Super-Cycle Timeline

Source: Coatue. Through year-to-date 2025.
The chart above shows the technology Super Cycles since the 1960s.
After Tuesday’s chart that showed Coatue’s breakdown of the AI super cycle (chart 2 here), I had questions about previous cycles, how long they’ve lasted and their overlap.
Many of the previous cycles lasted for a decade from an investment perspective but remain critical building blocks of the super-cycles that have followed.
This illustration, like the one shown on Tuesday is from Coatue’s 2024 East Meets West (EMW) Conference (full presentation here).
What’s interesting to me - and I recognize that Coatue which has both Venture Capital and Growth hedge funds is trying to sell its investment products - is how Coatue views the exponential growth of Generative AI.
To a large extent I agree.
If we were to think about the Mobile Internet - yes it spurred the iPhone economy and “apps” and this gave way to cloud which leveraged networking and was required for streaming and social media.
These in our view are relatively “verticalized” and contained relative to the sub-platform possibilities that may be possible because of AI.
We highlighted robotics on Tuesday.
While robots in assembly lines have existed for decades, stand alone robots that can respond to instructions require AI (which itself may be reliant on cloud and connectivity).
There are also autonomous vehicles which will both utilize and feed into AI models.
We have been introduced to a mining company that utilizes AI to predict the location of mineral deposits and does so with 25x greater accuracy than traditional methods. If it can do this in mining, it is likely it will be helpful in identifying oil and gas fields.
In our view, AI will build off of many of the previous super cycles and can be pervasive across industries and will have applications that many are not yet considering.
(Past performance is not indicative of future results. This is not a recommendation to buy or sell any security and is not investment advice. Please do your own research and due diligence).
5. If January and February are Positive…

Source: Carson Investment Research / Ryan Detrick. Through year-to-date 2025.
The chart above shows what has happened in years when both January and February have provided positive returns.
It may be a little early for this, but historically, when January and February are both positive, the final 10 months of the year have averaged a 12.3% return with a 93% positive rate.
This figures are better than the average year which has returned 8.2% with a 73% positive rate.
(Past performance is not indicative of future results. This is not a recommendation to buy or sell any security and is not investment advice. Please do your own research and due diligence).