


The Reflex
After the persistent selling, the bounce seemed inevitable. While there are technical analogs that suggest continued equity recovery, the economy and Fed (tomorrow) present questions. Let's dig in...

After equity markets experience an extreme sell-off (10% in less than a month qualifies) an “oversold” bounce always occurs.
We were expecting it and so were others.
There are indicators that characterize an “oversold” market: put buying, % of shares below their respective 200-, 50-, 20- and 10-day moving average, short positioning etc.
While the sell-off can often feel chaotic, it’s the character of the recovery that’s most telling.
The last two days were extreme in terms of the percentage of shares that moved higher (>90% of the S&P 500) (see chart 5), but volume was lighter than typical.
The S&P 500 rallied right to its 200-day moving average (as we expected) and settled at its 1.618 Fibonacci extension line.
We’ve been expecting a battle at the 1.618 Fibonacci extension line since the beginning of the year (chart 1 here) if not longer. It’s finally here.
The battle will be framed by earnings, earnings expectations, inflation, policy and economic growth.
In our view, earnings and earnings expectations have not reacted to the current Trump economic reality. Furthermore, while US equity market multiples have contracted, they may not reflect the macro-uncertainty that seems to be prevalent.
Given tomorrow’s Fed decision, press conference and the release of the summary of economic projections, including the current dot-plot, we are particularly interested in the equity reaction over the next few days .
In our view, the end of Quantitative Tightening will be a key component of tomorrow’s announcement.
As we have stated several times, we see the possibility of the Fed expanding the balance sheet (call it Quantitative Easing “QE” or something else) before the end of the year.
In the meantime, we want to see if the equity market remains oversold. We wrote last week that we would not trust the initial bounce after the sell-off.
A market that is oversold that is oversold can’t be trusted and we don’t yet trust the recovery.
Given the battle with the 200-day moving average and the 1.618 Fibonacci extension level, we are not in a hurry to use the cash that we raised coming into the correction to buy back equities.
Furthermore, in our experience, v-shaped recoveries are rare. We generally look for a “re-test” of the lows and confirmation from the other indicators we follow..
We are continuing to opportunistically watch.
For now, the market is playing out how it typically does,
The Reflex.

1. The S&P 500 ETF: The Chef’s Kiss at the 200-Day
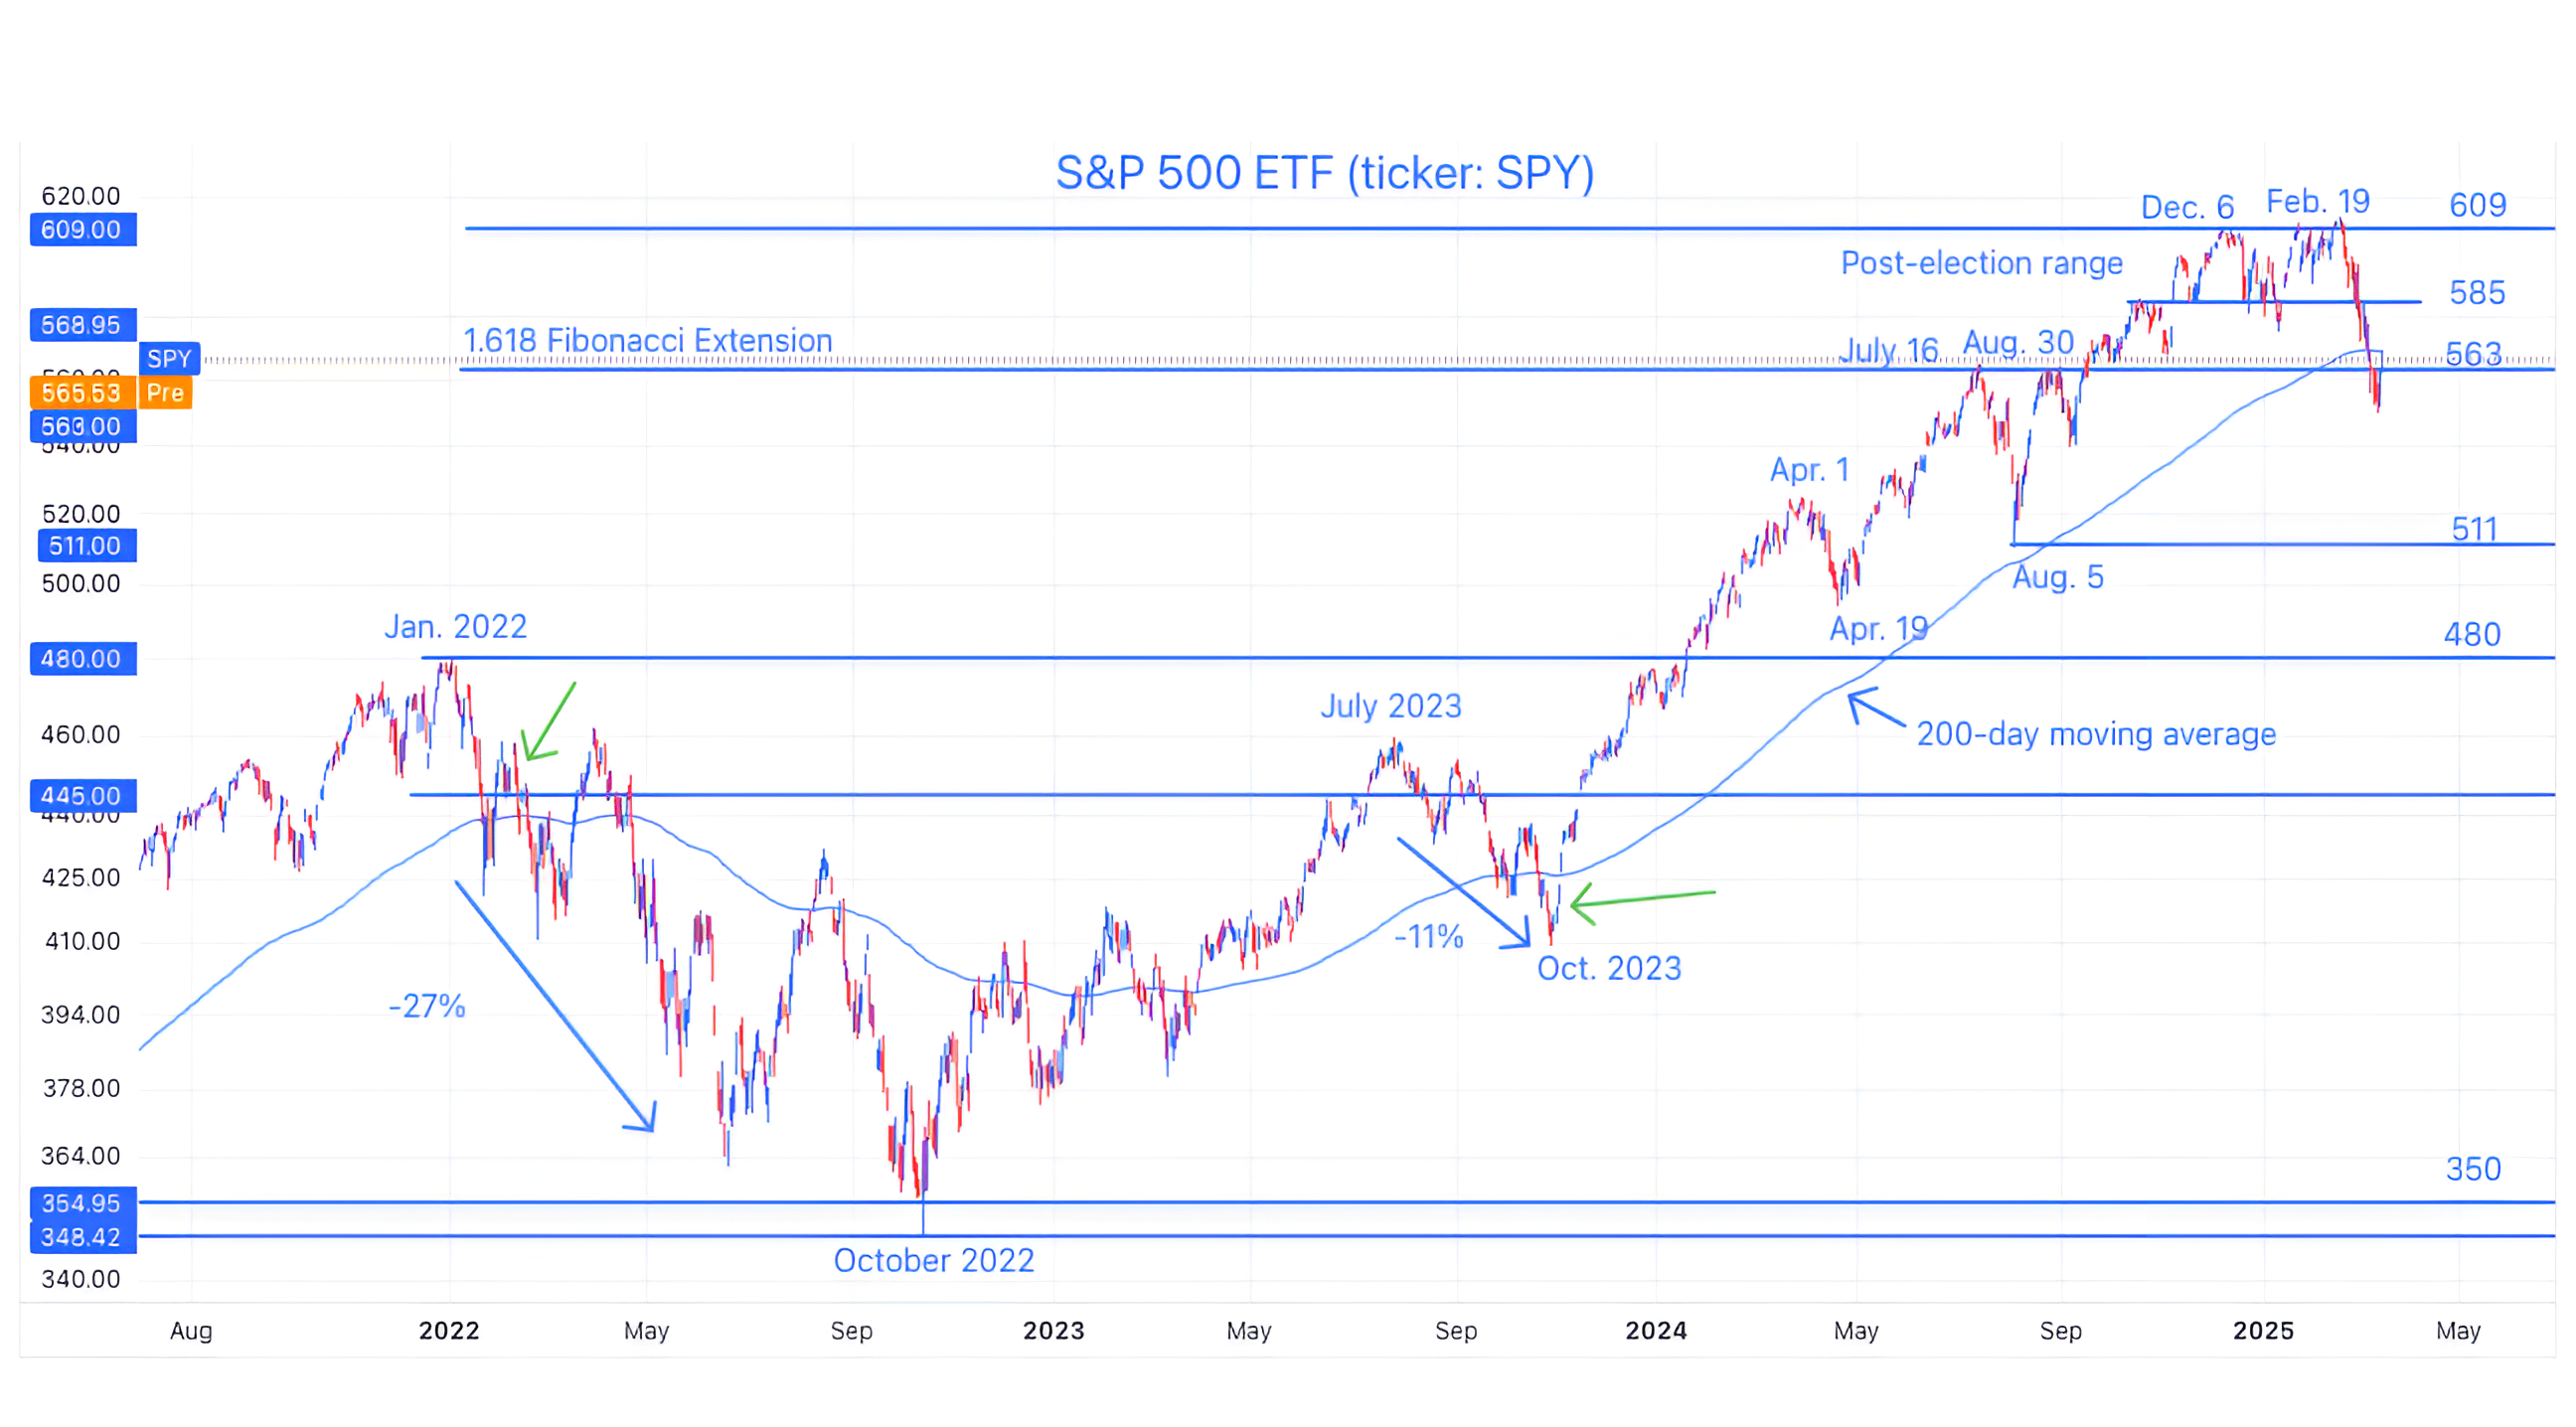
Source: TradingView. Through year-to-date 2025.
The chart above shows the S&P 500 ETF (ticker: SPY) with its 200-day moving average (curved light blue line).
After the 10% decline in less than a month, the S&P 500 ETF rallied over the past two days before selling off today.
If you look closely, you can see that yesterday, the S&P 500 ETF “kissed” its 200-day moving average before retreating.
In our view, the long-awaited battle at the 1.618 Fibonacci extension level of the 2022 sell-off level (at 563) may finally be here. (Admittedly, we may be the only ones who have been waiting for this).
We believe that the combination of the 200-day moving average and 1.618 Fibonacci extension level will present a challenging hurdle for the ETF to meaningfully surpass with ease.
In our view, it is more likely that the index will churn in this zip code and await new news.
While there were some positive technical signals over the past two days - over 90% of the S&P 500 was up on both days which has been an indication of six and 12 month positive returns in the past (see chart 5) - we have not yet seen the economic volatility and concerns expressed in earnings outlooks.
As we have shown over the past two weeks, the cuts to US fiscal spending will clearly slow the economy. While the private sector could take the growth baton (that seems to be the goal), the hand-off will likely may not be seamless.
Combined with the uncertainty around tariffs, this could impact corporate earnings and outlooks. Thus far, we have seen less impact in earnings projections than we would expect.
With the S&P 500 churning in the neighborhood of the current level, we believe the magnitude and timing of earnings cuts along with likely policy initiatives (both monetary and fiscal) will set the direction and tone for the next stanza of US equity markets.
From simply a price perspective, as we stated last week, anytime price falls below its 200-day moving average, we want to see the response.
Specifically, we want to see if the current period is more like:
early 2022 (left green arrow), when the S&P 500 moved above its 200-day moving average twice before falling further, or
October 2023 (right green arrow) when the S&P 500 ricocheted above its 200-day moving average and never looked back.
We expect a bounce but based on policy, US growth, and valuation, we favor the early 2022 scenario (65-70% likelihood) to the October 2023 scenario (30-35% likelihood).
(This is not a recommendation to buy or sell any security and is not investment advice. Past performance is not indicative of future results. Please do your own research and due diligence).
2. Dividend Shares - Somewhere to Hide

Source: TradingView. Through year-to-date 2025.
The chart above shows the iShares Select Dividend ETF (ticker: DVY).
Currently, the Dividend ETF is yielding 3.6%, below the 4.3% yield of 10-Year Treasuries, but in line with the possible (Treasury yield) target that we presented last week (chart 4 here).
We have always viewed higher dividend yielding equities as a fixed income alternative.
In our view, we would rather own higher-dividend paying equities over 5-10 years as we will benefit from both increases in dividends and capital appreciation (most likely) rather than a fixed coupon.
In periods of volatility, investors often migrate towards assets that deliver income.
With that in mind, as long as the Dividend ETF remains above its 2022 high (or does not fall meaningfully below it) this is one of the better looking US charts in our work right now.
(Past performance is not indicative of further results. This is not a recommendation to buy or sell any security and is not investment advice. Please do your own due diligence).
3. To Recession or Not to Recession, That is the Question

Source: Oxford Economics / Refinitiv Datastream. Through year-to-date 2025.
The chart above shows S&P 500 corrections (drawdowns of greater than 10%) since 1965 based on duration and magnitude with recessionary drawdowns in red and non-recessionary sell-offs in blue.
As a reminder, the current drop of 10% in the S&P 500 has taken place in less than a month.
On average, non-recession corrections have lasted about 90 days with a 15% drawdown.
Recessionary drawdowns have transpired over nearly 300 days with an average decline of 36%.
As we wrote last Thursday:
“If we were to consider that equities on average drop around 30-40% in recessionary periods, if investors price in a 50% chance of a recession, we can consider the possibility of a 15-20% drawdown.”
We still see this as a relevant framework.
(Past performance is not indicative of future results. This is not a recommendation to buy or sell any security and is not investment advice. Please do your own due diligence).
4. Consumers Becoming Worried About Jobs

Source: Apollo Chief Economist, Conference Board, Haver Analytics. Through year-to-date 2025.
The chart above shows the results of the US Consumer Confidence survey Next Six Months Expectations: Fewer Jobs Available with recessions shaded in grey.
What this chart shows is that an increasing percentage of respondents are concerned that there will be fewer jobs in the next six months.
The current increase and level of those concerned about employment is rare outside of recessionary periods.
It is not difficult to imagine that those worried about jobs may try to reduce spending.
To be clear, this is a survey and we have not seen this show up in the hard data such as jobless claims or employment (yet) and we don’t know whether there will or will not be a recession, but I am showing this for two reasons:
In our view, as earnings expectations have remained relatively stable (11% growth in 2025 / 14% growth in 2026), we do not believe any slowdown or recession risk has been incorporated in projections.
When we consider chart 3 and recession risk, some investors may consider calibrating their views.
(Past performance is not indicative of future results. This is not a recommendation to buy or sell any security and is not investment advice. Please do your own research and due diligence).
5. Consecutive 90% Up Days, After a 6-Month Low

Source: Sentiment Trader. Through year-to-date 2025.
The chart above shows the S&P 500 performance given the characteristics as of yesterday’s close: two consecutive days with 90% advancing stocks (over 90% of the shares in the index were up) after hitting a six month low.
The most interesting part of this chart may be that two months after this condition is hit, there has not been a negative return and the average return has been 6.2% (past performance is not indicative of future results).
If that were to occur in the current period, it would bring the S&P 500 back to 6000 by mid-May.
While this is not our base case, it is definitely worthy of consideration, particularly because few (including us) are likely expecting this near-term outcome.
The longer-term precedents (six and 12 months) are both constructive and have been positive more than typical with above average returns for the respective periods.
(Past performance is not indicative of future results. This is not a recommendation to buy or sell any security and is not investment advice. Please do your own research and due diligence).