


Everybody Was Kung-Fu Fighting...
Trump vs. Elon; Trump vs. California; Trump vs. China; Trump vs. the World. Welcome to Trump 2.0 where the market seems to have become immune to news from the White House. Let's dig in...

What has caught our attention more than Trump fighting with the world has been the market’s ability to ignore it.
It is not just US equities, European equities are hitting new highs, the Japanese Topix Index is challenging its 1989 high (chart 5, below) and other equity markets are rallying as well.
I have continue to consider the possibility of a mid-July / early August sell-off. We see three potential catalysts:
The 90-day tariff negotiation window will end around July 9.
The Senate is aiming to return the Big Beautiful Bill to the House by July 4th.
Q2 earnings season will begin around July 14.
The relief in these three issues have served as the foundation for the current rally. Disruption to any of them, particularly after the unabated climb in equity markets could lead to profit taking.
In the meantime, Trump continues to spar with the world.
“Everybody was Kung Fu Fighting.”

1. S&P 500 Looks Like It’s Heading to New All Time Highs

Source: TradingView. Through year-to-date 2025.
The chart above shows the S&P 500 ETF (ticker: SPY).
Similar to the characteristics we highlighted with the Nasdaq 100 last Thursday (here), the S&P 500 is rapidly heading towards its all-time high.
We see a similar path in the S&P 500 as the one we laid out for the Nasdaq 100:
Hit the December / February all-time high levels around 609 (~6050 on the Index);
Pause (?) (we have seen the indexes recently jump over levels that we have viewed as important without a pause so we’ve added a question mark);
Bring in many investors that have questioned the recovery and are now “capitulating” to the upside;
Achieve a new all-time high 3-4% above the December / February peak levels;
In an extreme scenario, the S&P 500 can rally up to the inverse “Head and Shoulders” target zone range (~6500-6600 on the S&P 500) (not our base case);
Once everybody is “in” (complacency), we expect a sell-off in mid-July / early-August;
Set up for a year-end rally.
We provide these scenarios, not because they’re necessarily accurate, but because they help us develop a play-book and can help guide our tactical adding / trimming (raising and lowering cash) and put / put spread buying and selling.
Let’s see!
(This is not a recommendation to buy or sell any security and is not investment advice. Past performance is not indicative of future results. Please do your own research and due diligence).
2. Energy: Ready to Launch?

Source: TradingView. Through year-to-date 2025.
The chart above shows the Energy Sector ETF (ticker: XLE).
For the last three years - the Energy Sector has been moving sideways and trading in a range between $77.50 - $93.50.
Coming into the year, we identified oil prices as one of the major questions (chart 4 here) for 2025 (admittedly, to date, this has not been an issue).
At the time, we wrote:
Pivoting back to oil, as we look at the chart, we question whether oil prices will a) hold the $68 / barrel level and b) if they do, will they move back up towards $81.
Although the President elect wants to drill, there is a growing concern with the amount of waste water that is being pulled up from underground with oil.
Waste water and waste water disposal are a growing issue and solutions could raise the cost of production.
We now know that oil was unable to hold the $68 / barrel level and traded down to $55.
The proximate cause of the drop was that OPEC announced supply increases.
As a result, it has become less economic for the shale oil companies to continue to their drilling activities (we don’t know if this is partially attributable to the waste water issue that we identified in December or simply because of lower price).
Last week, the Baker Hughes US rig count (here) dropped to its lowest level since 2021 (post-covid increase period).
At the same time, OPEC increased supply by less than they had announced in May (180 thousand barrels supplied vs. 310 thousand barrels announced).
I am not sure if the low price dissuaded the OPEC member from increasing output or if they were simply meeting lower demand with lower supply, but in my view the combination of lower than expected OPEC output with reduced US rigs may be something to watch.
Now a caveat - I have been overly constructive on oil price for the last six months, however, I have been investing in higher yielding oil related companies and have essentially been “paid to wait.”
The question now is - is the waiting over?
(Past performance is not indicative of future results. This is not a recommendation to buy or sell any security and is not investment advice. Please do your own due diligence).
3. Don’t Call it QE…
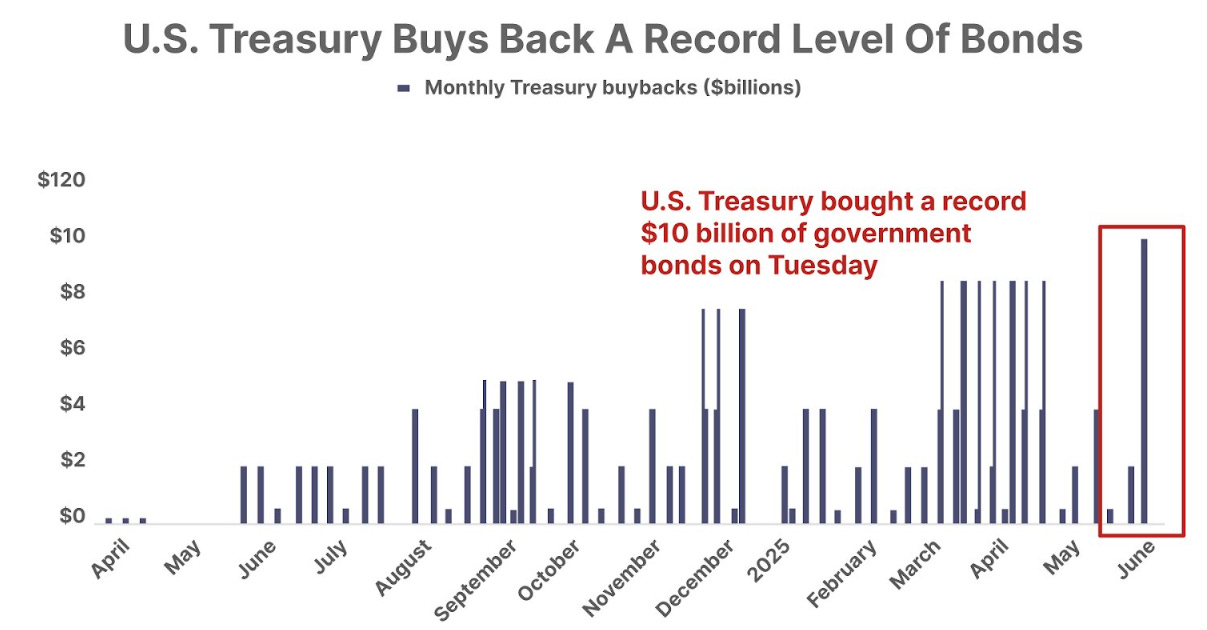
Source: Goldman Sachs; Congressional Budget Office and CBO. Through year-to-date 2025.
The chart above shows monthly US Treasury Buybacks of Government Bonds.
Last Tuesday, the U.S. Treasury bought back $10 billion worth of its own bonds – the largest buyback in history.
I am not sure what mechanism (or account) the Treasury used to buy back the bonds, but it is likely they did so to help contain yields.
Typically, in a period of Quantitative Easing (QE), the Fed buys Treasuries to lower yields and encourage borrowing.
Given the Fed’s current reluctance to provide stimulus, it is possible that the Treasury is stepping in to stabilize the market rather than to provide stimulus.
(Past performance is not indicative of future results. This is not a recommendation to buy or sell any security and is not investment advice. Please do your own research and due diligence).
4. US Federal Receipts and Outlays through Fiscal Year 2025

Source: US Treasury. Through April 30, 2025.
The chart above shows the US Treasury Receipts by Source (left side) and the Outlays by Function (right side) through April 30, 2025.
This is an update of a chart we showed in chart 3 here.
As a reminder, the US Fiscal Year began on October 1st - as a result this chart covers the first seven months of the 2025 fiscal year.
While the deficit thus far in fiscal year 2025 is $1.049 trillion, the net Interest Expense is the number two largest outlay behind Social Security.
Last year, at the same point in the fiscal year (April 2024), the deficit was $855 billion ($194 billion lower) and interest expense was $65 billion lower.
In the last full fiscal year (ending in September 2024), the US spent $1.13 trillion on net interest expense. This fiscal year, the US is on a “run rate” of $1.3 trillion.
In the current fiscal year, the government has already spent $4.159 trillion (outlays) and the deficit is 34% of total receipts.
This is Elon’s concern.
(Past performance is not indicative of further results. This is not a recommendation to buy or sell any security and is not investment advice. Please do your own due diligence).
5. Japanese Equities: Back Near 1989 Highs
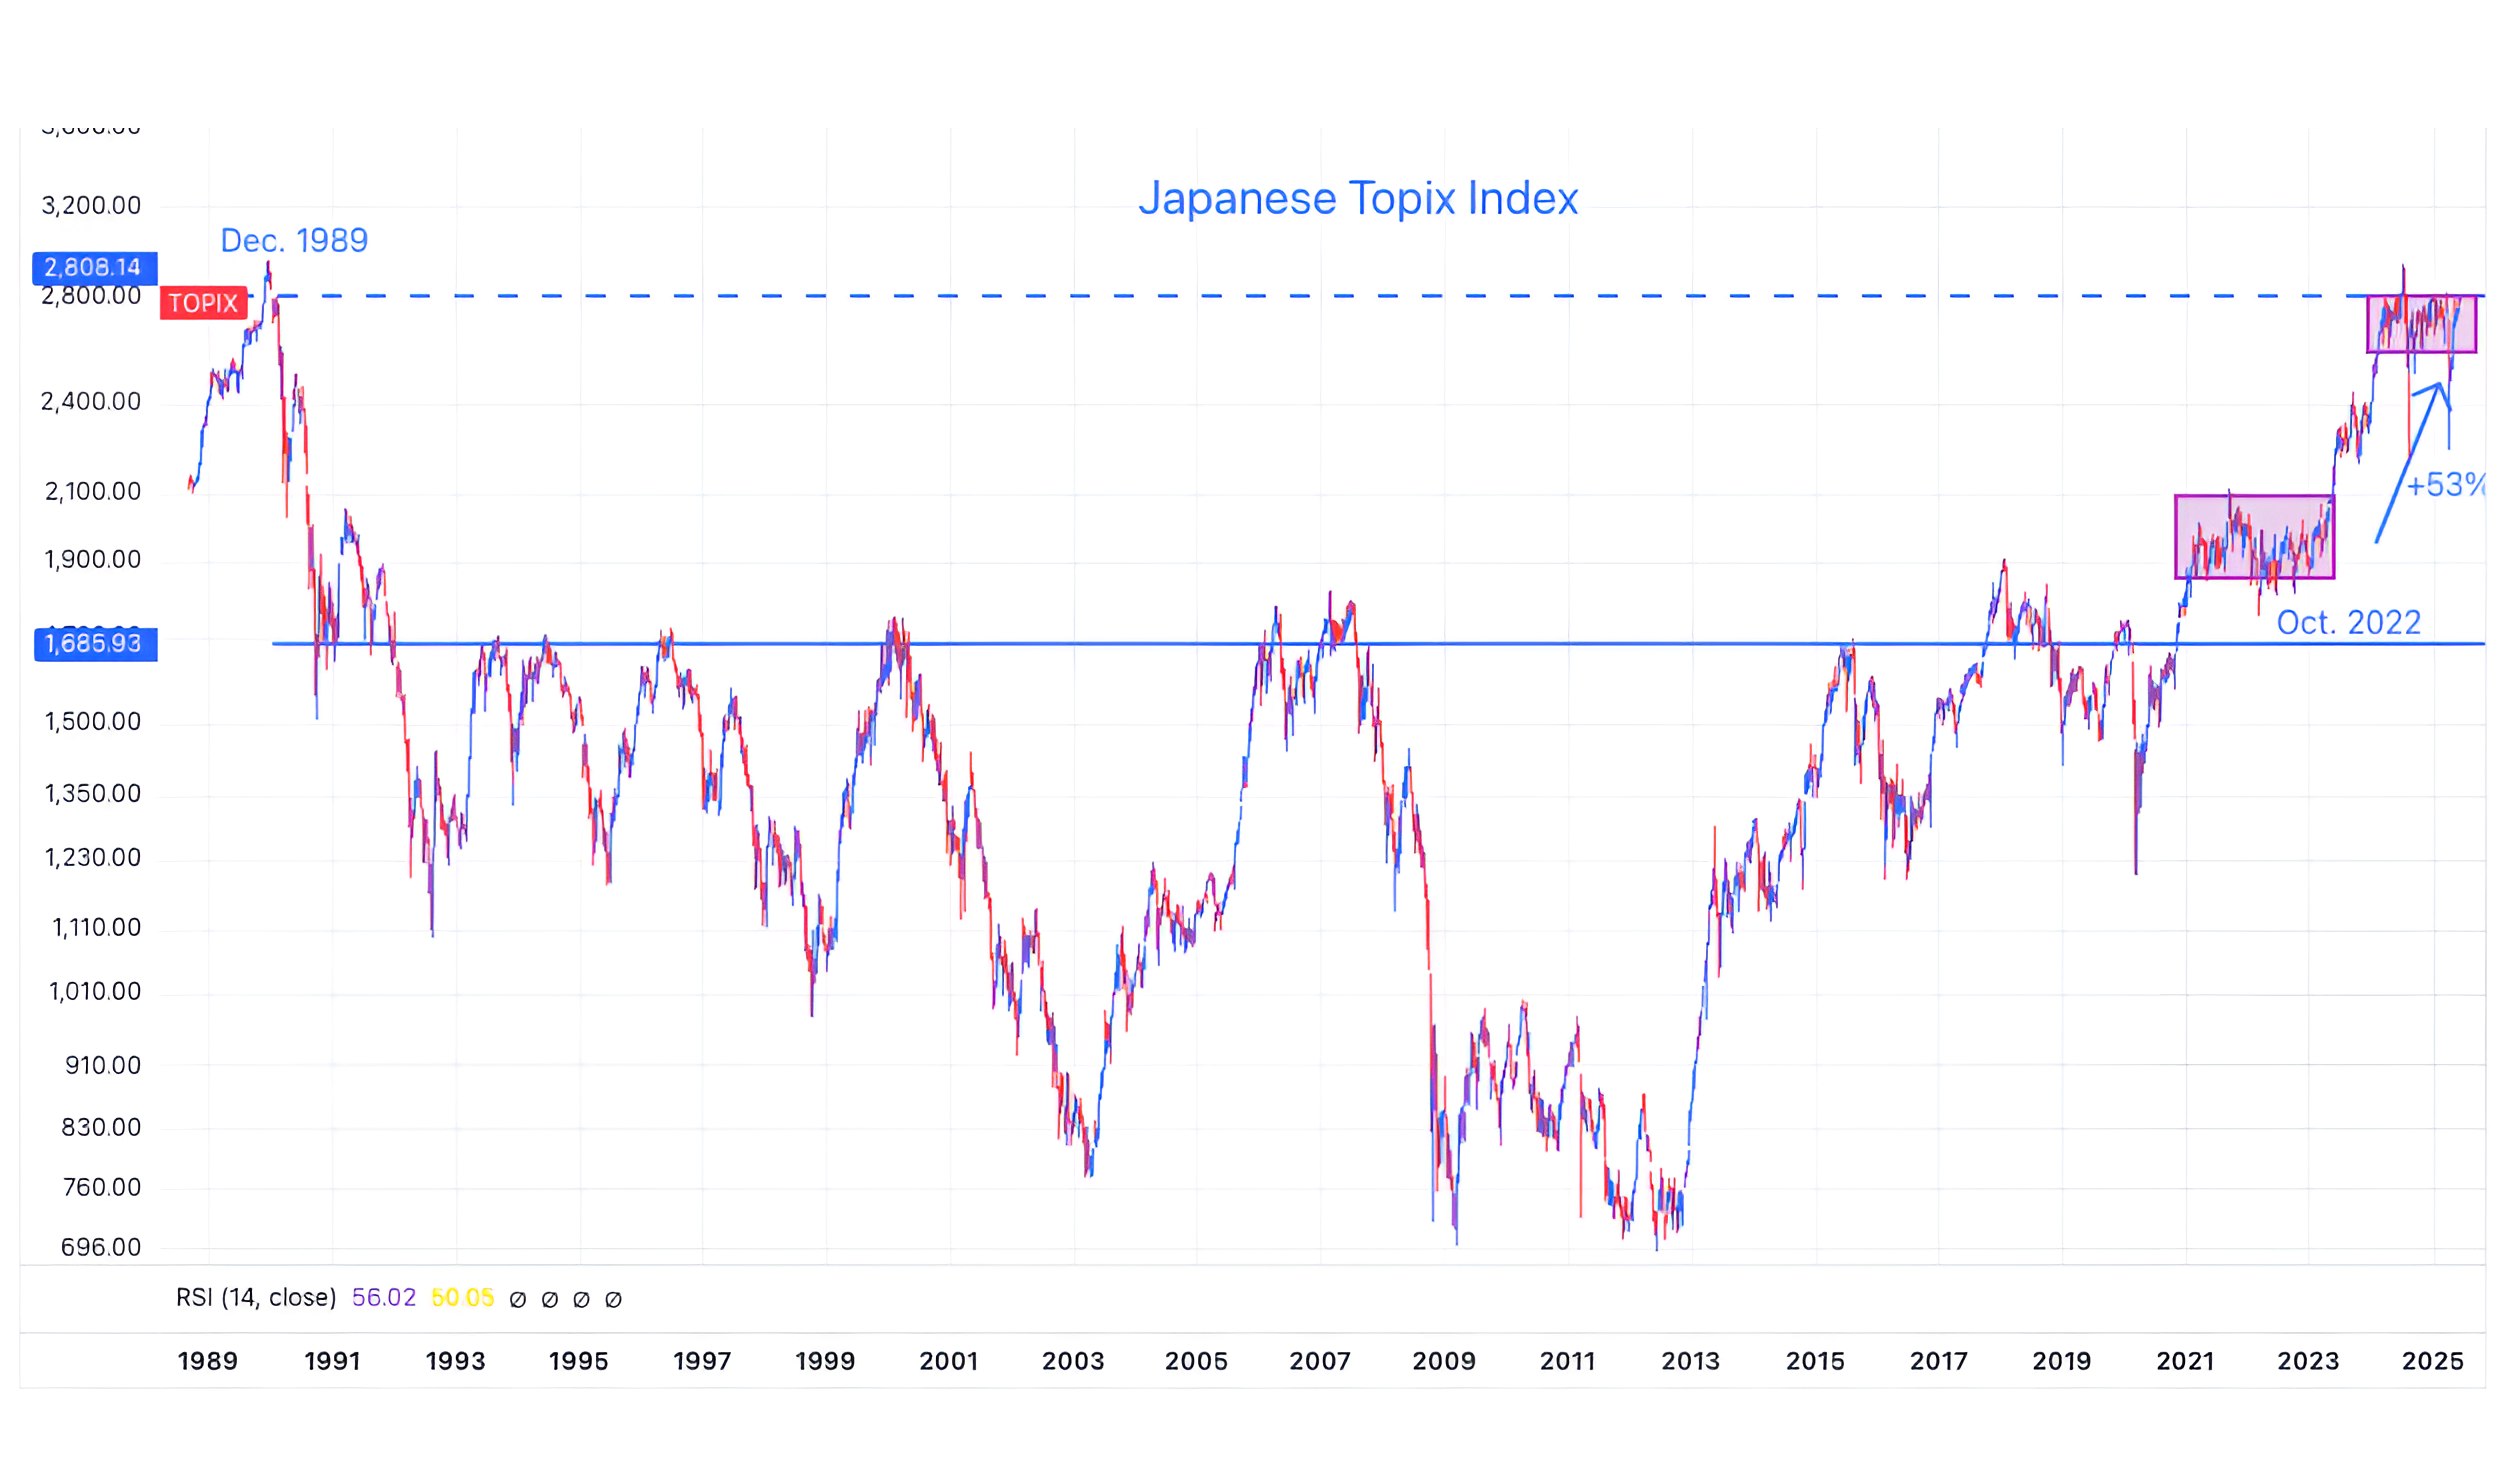
Source: TradingView. Through year-to-date 2025.
The chart above shows the Japanese Topix Index.
After a 2.5 year 53% run, Japanese Equities are back in the neighborhood of their 1989 highs.
We wouldn’t be surprised to see new all-time highs in Japanese equities along with the new all-time highs that we’ve seen in European equities and the new all-time highs that we’re expecting in the US.
Very simply, it is not just US equities that have been able to rally in the face of global uncertainty.
(Past performance is not indicative of future results. This is not a recommendation to buy or sell any security and is not investment advice. Please do your own research and due diligence).