


Rocketman!
On his way out of Washington, Elon couldn't hold back on his criticism and voiced concerns about US Government spending and debt that we've highlighted for the past year. Let's dig in...

“A new spending bill should be drafted that doesn’t massively grow the deficit and increase the debt ceiling by 5 TRILLION DOLLARS…
This spending bill contains the largest increase in the debt ceiling in US history! It is the Debt Slavery Bill.”
Elon Musk, June 4, 2025.
(As an aside, I started writing this, chose the picture and picked the title this morning before the real insults between Elon and President Trump began. But, wow!)
Throughout the second half of 2024, we consistently expressed our concern about:
the $37 trillion fiscal deficit (chart 4 below);
the interest expense in absolute terms over $100 b / month ($1.2 t / year) and as a % of the budget - bigger than defense and accelerating (chart 3 here);
the debt maturity wall (chart 1 here); and
the fiscal deficit (chart 4 here).
Combined with elevated valuations (chart 2 here), we viewed these fiscal dynamics as a risk.
Our concern, coming into the year was that the “bond vigilantes” would require a higher yield to lend to the US government (higher long-term Treasury yields) which would, in turn, put pressure on equities.
On January 9th (here), we wrote:
“We have continued to highlight our view that there is an above average chance (30%+) of a significant drawdown (~20%) in equities.
The combination of top-decile valuation; questionable earnings (we will cover these next week); higher 10-Year US Treasury yields (chart 3, below); investor complacency (chart 4 here); and a transition in the fiscal and liquidity regime (both traditional and stealth) has us increasingly “vigilant.””
While we were right about the 20% drawdown, we were wrong about the catalyst.
However, it looks like we might have another chance at this.
As we highlighted on Tuesday (chart 2 here), valuations are back to top decile levels. With the disfunction in Washington, we believe there is a risk that 10-Year Treasury yields (after having settled down) could push back towards the 4.65% level that we view as the top of the current range (chart 4, here).
Although we see US equities moving higher over the next month (chart 1, below), we are beginning to sense a complacency.
We noted this in the introduction Tuesday as we highlighted a list of recent news items - any one of which would have led to a 2% equity move in the past - that had been largely ignored across markets (with the exception of gold - chart 5, below).
In the meantime, there’s a war of words - and potentially some actions between the “Rocketman” and the “Orange Man.”
On the US betting sites, the favorite is the:
“Rocketman! Burning out his fuse up here alone.”

1. Growth is Leading the Way…

Source: TradingView. Through year-to-date 2025.
The chart above shows the Nasdaq 100 ETF (ticker: QQQ).
The Nasdaq 100 is rapidly approaching its all-time high.
As I remarked on Tuesday, the combination of:
tariff challenges in court;
questions about the tax stimulus;
the absentee Fed;
Iran developing weapons grade nuclear material;
Russia vowing to strike back at Ukraine (yesterday); and
heightened tensions with China (although diffused today with a call between Xi and Trump);
has done nothing to derail the ascent.
One of the smartest investors I know (+18% this year in a Nasdaq 100 trading strategy, but disappointed because he was up over 20% and gave some back) said to me yesterday that he expected the Nasdaq 100 to move above its recent high in the near future.
At that point, according to him, it would pull investors in, move up another 2-3%, breed complacency and then drop.
He thinks that the timing of a mid-July / early August sell-off that we have been indicating as a possibility was somewhat consistent with his view.
I think his view on the path may prove to be more accurate than my view on timing.
As an aside - we have proposed the 580 target based on the inverse head and shoulders pattern. I do not think the Nasdaq 100 will make it to 580 before our expected July / August sell-off should it come, but we will see!
(This is not a recommendation to buy or sell any security and is not investment advice. Past performance is not indicative of future results. Please do your own research and due diligence).
2. Semiconductors Underperforming…Was that It?

Source: Goldman Sachs. Through year-to-date 2025.
The chart above shows the Semiconductor ETF (ticker: SMH) relative to the Nasdaq 100 ETF (ticker: QQQ).
This relationship peaked at the end of the dot-com (software) bust as there was competition and commoditization across the semiconductor sector.
After 10 years of semiconductor companies acquiring one another, bankruptcies and increased specialization; Semiconductors began to bottom in 2012.
It required another three years (to 2015) before Semiconductors began to outperform other growth shares in the Nasdaq 100.
That outperformance peaked around a year ago.
At the end of March, Semiconductors bounced on relative basis at their long-term “battle-zone” level (battle zone = a lot of bounces from above and below).
We want to see if Semiconductors can begin to outperform again or if they fall below the battle zone line.
Often when we view a chart like this - we aim to draw broad market conclusions. I don’t think we can do that with this chart and we need to let the Semiconductors relative the Nasdaq 100 stand on its own.
(Past performance is not indicative of future results. This is not a recommendation to buy or sell any security and is not investment advice. Please do your own due diligence).
3. Tax Revenues as a % of GDP Surprisingly Consistent

Source: Goldman Sachs; Congressional Budget Office and CBO. Through year-to-date 2025.
The chart above shows the breakdown and path of the current tax bill.
What this illustrates is that the Big Beautiful Bill has tax cuts (stimulus) front-loaded and spending cuts back-loaded (after 2029).
Based on this framework, while President Trump and the economy would benefit from the near-term stimulus, the next president would be stuck with the fiscal drag.
It should be noted because this analysis is based on the Congressional Budget Office (CBO) scoring which often seems to be characterized by limited synaptic activity, some of the projections may be way off (as is typical with the CBO).
That said, we wanted to show this in its current form.
(Past performance is not indicative of future results. This is not a recommendation to buy or sell any security and is not investment advice. Please do your own research and due diligence).
4. The US Debt Outstanding…

Source: Federal Reserve Bank of St. Louis (“FRED”). Through year-to-date 2025.
The chart above shows the US Total Public Debt Outstanding.
The US currently has $36.2 trillion in total public debt outstanding and it will be at $37 trillion by the end of the year.
I write about this often and wanted to show a picture.
It is notable that in the history of the US, it was not until 2009 that hit the $12 trillion outstanding level. It has taken 15 years to triple that number.
(Past performance is not indicative of further results. This is not a recommendation to buy or sell any security and is not investment advice. Please do your own due diligence).
5. All that Glitters…
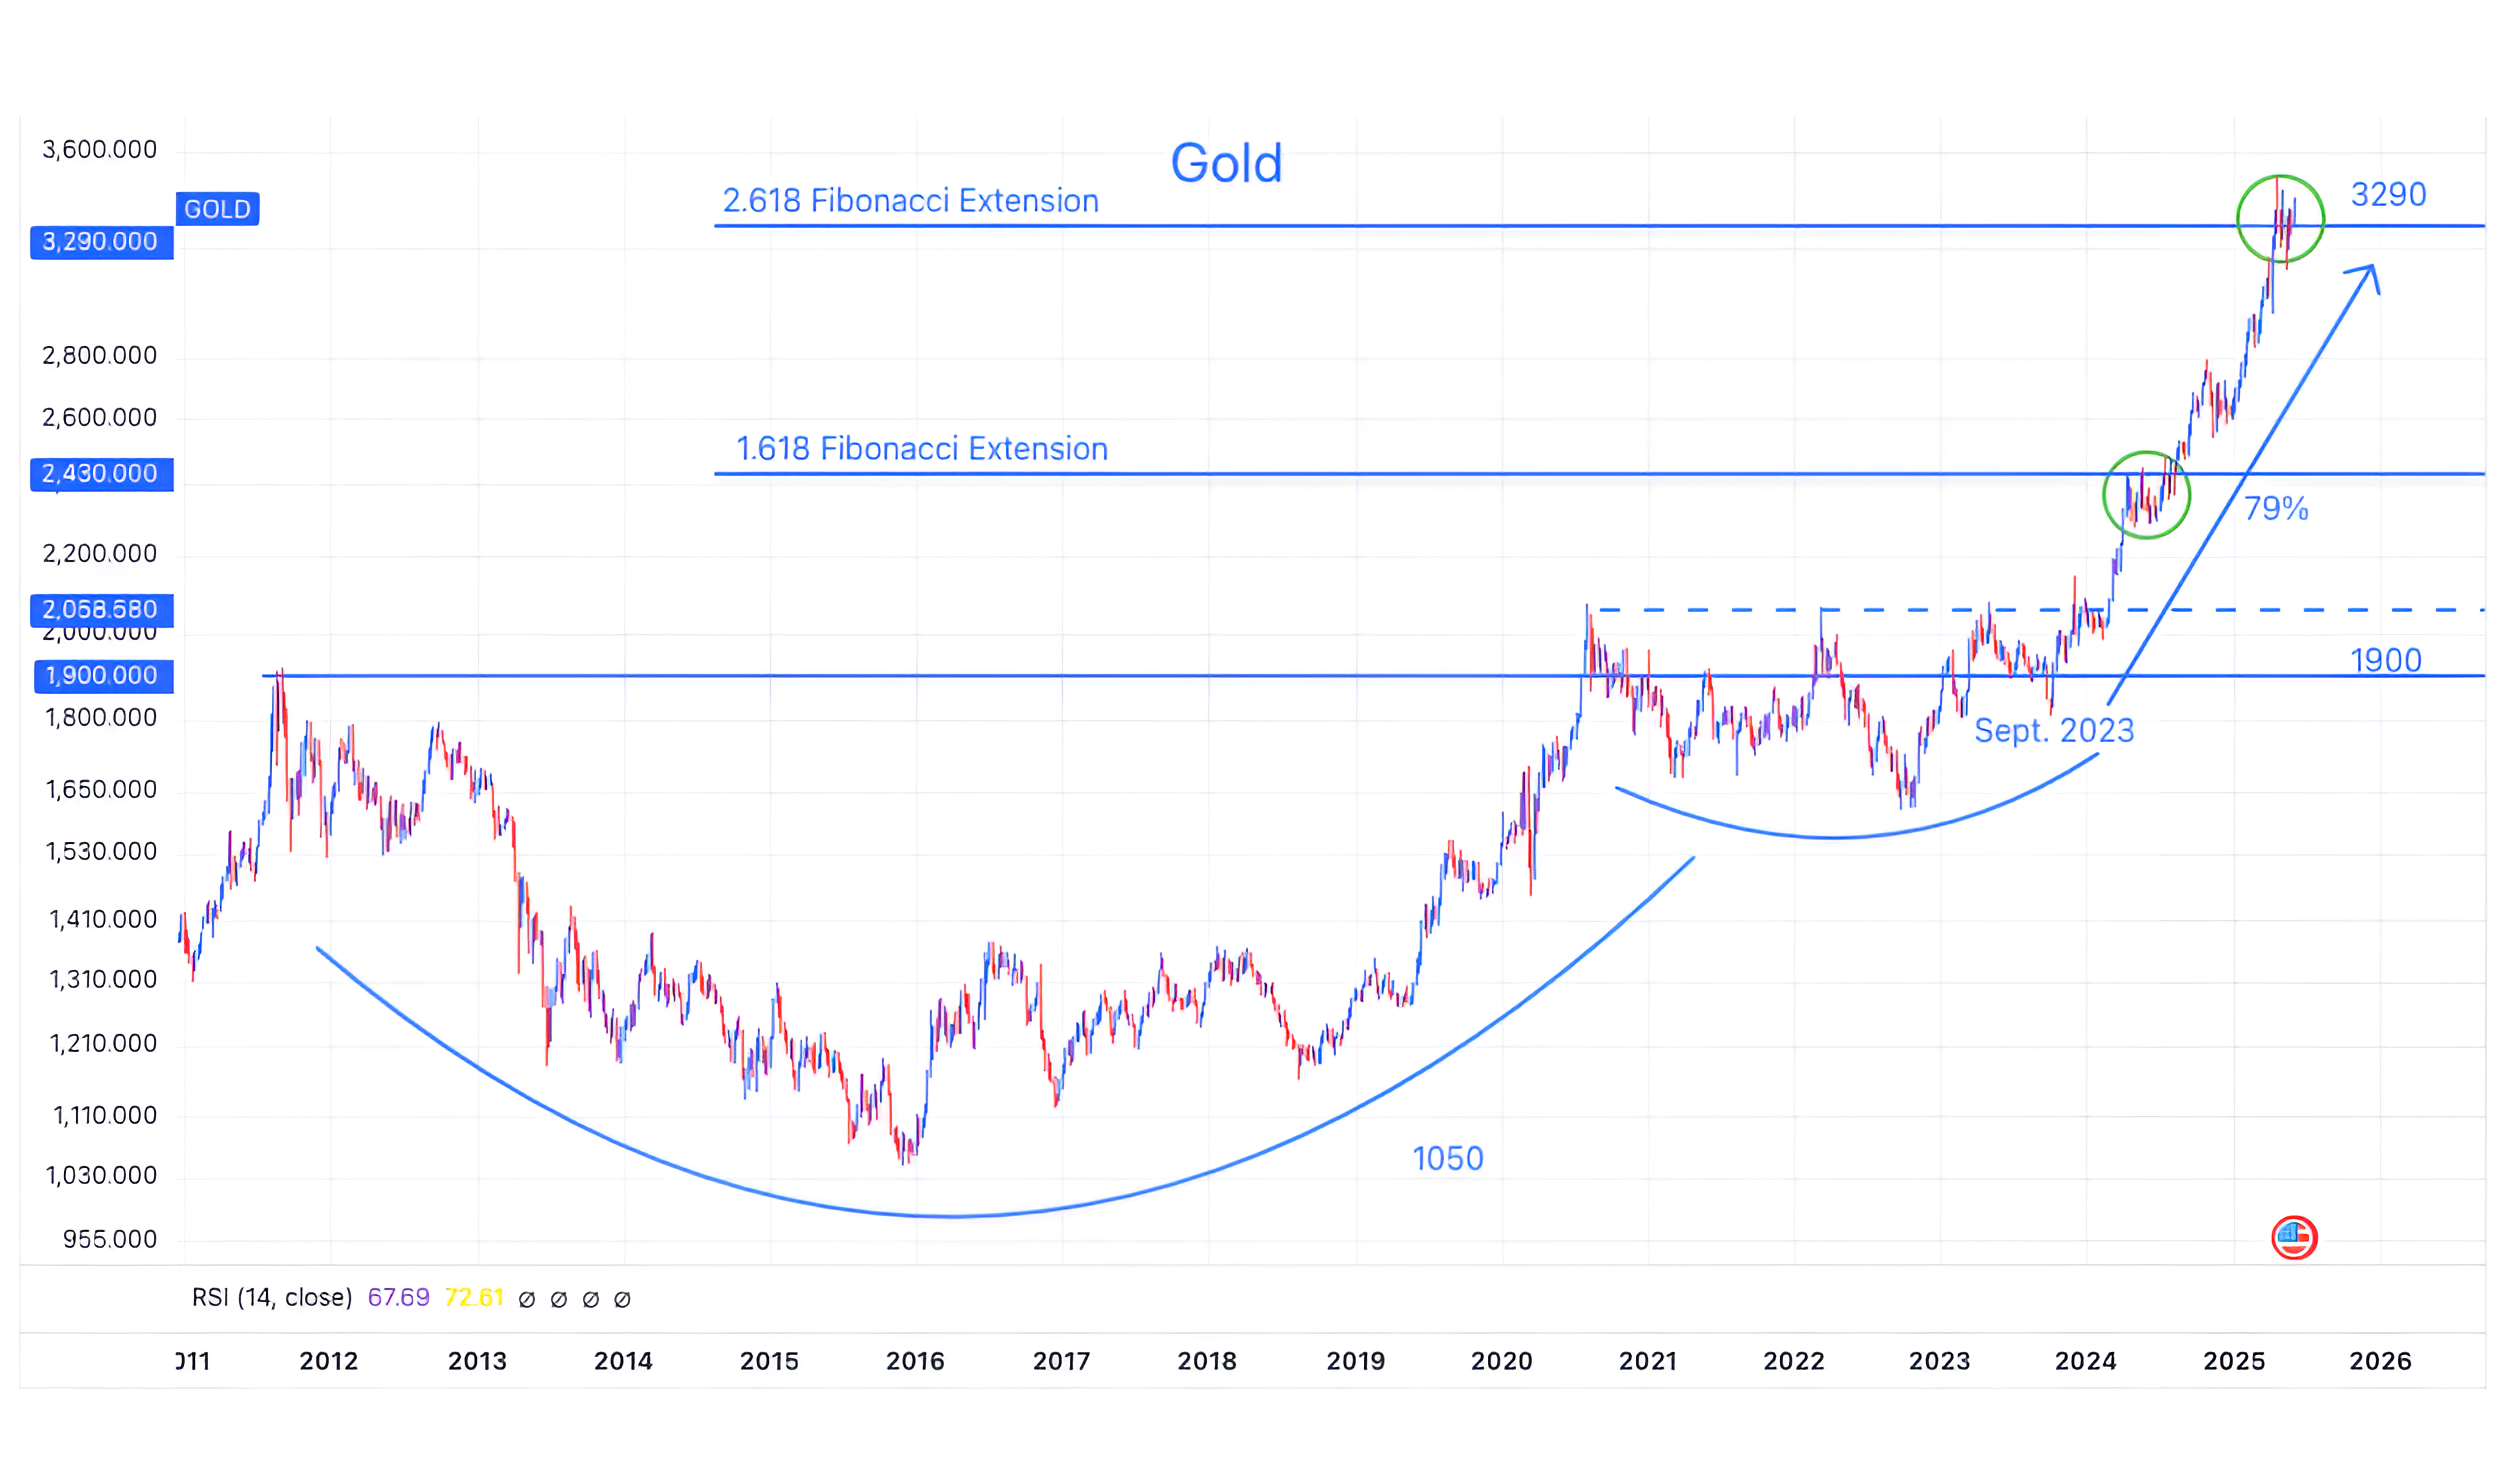
Source: TradingView.. Through year-to-date 2025.
The chart above shows the price of Gold.
We have always viewed Gold as an uncertainty hedge rather than an inflation hedge.
On the chart, we can see Gold was essentially flat from 2020 through 2023 - the worst of the inflationary period; however, the precious metal took off thereafter (we could debate reasons) as inflation was coming down.
For now, we find it as interesting that Gold is fighting with the 2.618 Fibonacci extension of its 2011 to 2016 decline in a similar manner to the way it fought with the 1.618 Fibonacci extension of its 2011 to 2016 decline.
In our view, if Gold can meaningfully break through the 3290 level, it could foreshadow a further significant ascent (we see this as a 70/30 probability).
For traders, it would be easy based on this chart to buy gold with defined risk.
Have a great weekend!
(Past performance is not indicative of future results. This is not a recommendation to buy or sell any security and is not investment advice. Please do your own research and due diligence).