


Sympathy for the Devil...
Limited sympathy, if any. He doesn't need it or want it - just ask him, it's a sign of weakness. Given pushback to Trump's agenda, we're watching market and economic implications. Let's dig in...

It hasn’t been the best week for the Commander in Chief.
The “Liberation Day” tariffs have been challenged in court and many will likely be “nullified”;
The One Big Beautiful Bill - the tax cut bill that is the cornerstone of the Trump growth agenda is now being “refined” in the Senate (as we wrote about last week);
Ukraine has struck a blow in the heart of Russia and Zelensky still hasn’t said thank you or worn a suit (the last part is a joke);
Iran continues to develop weapons grade nuclear material with little hesitation and Trump now says this may be ok;
Elon Musk is leaving Washington (with a black eye) and referred to Trump’s signature One Big Beautiful Bill as a “disgusting abomination”; and
Trump’s nemesis China, accused the US of seriously undermining trade talks.
Just another week of Trump 2.0.
While we aim to remain apolitical and often want try to ignore politics, sometimes, it is difficult to do so.
The market reaction to all of the above has been muted.
In other words, despite our inability to turn away, the key US indexes seem to have been able to tune out the noise as each has recently remained range bound (one of our themes this year has been trying to tune out the media narrative around Trump):
The S&P 500 has been trading between 5825 and 5975 for three weeks;
10-Year Treasuries have been in the 4.40-4.60% zone;
Gold has been in the 3,200-3,400 per oz. range for six weeks;
Oil has been trading around $62 per barrel; and
the Dollar, despite rumors of its death, has been around the same level since mid-April.
When we see several asset classes trading sideways and “consolidating,” it’s as if traders are waiting for the next piece of significant information or data.
However, if the list of news items above couldn’t move the needle, it may be difficult to understand what might.
In our view, the economy and markets will react to the passage of Trump’s One Big Beautiful Bill. The reaction will obviously be dependent on what the bill looks like once it exits the more fiscally disciplined house of congress (the Senate).
As we wrote last week, we would not be surprised by a mid-July / early August sell-off.
Although the catalyst could be a combination of the Senate version of the One Big Beautiful Bill, it could be any item on the list above.
Limited “Sympathy for the Devil*.”
*The idea for today’s title was courtesy of reader LC. Thank you for the great idea and much needed drink!

1. Will the Nasdaq 100 Outperform the S&P 500
Source: TradingView. Through year-to-date 2025.
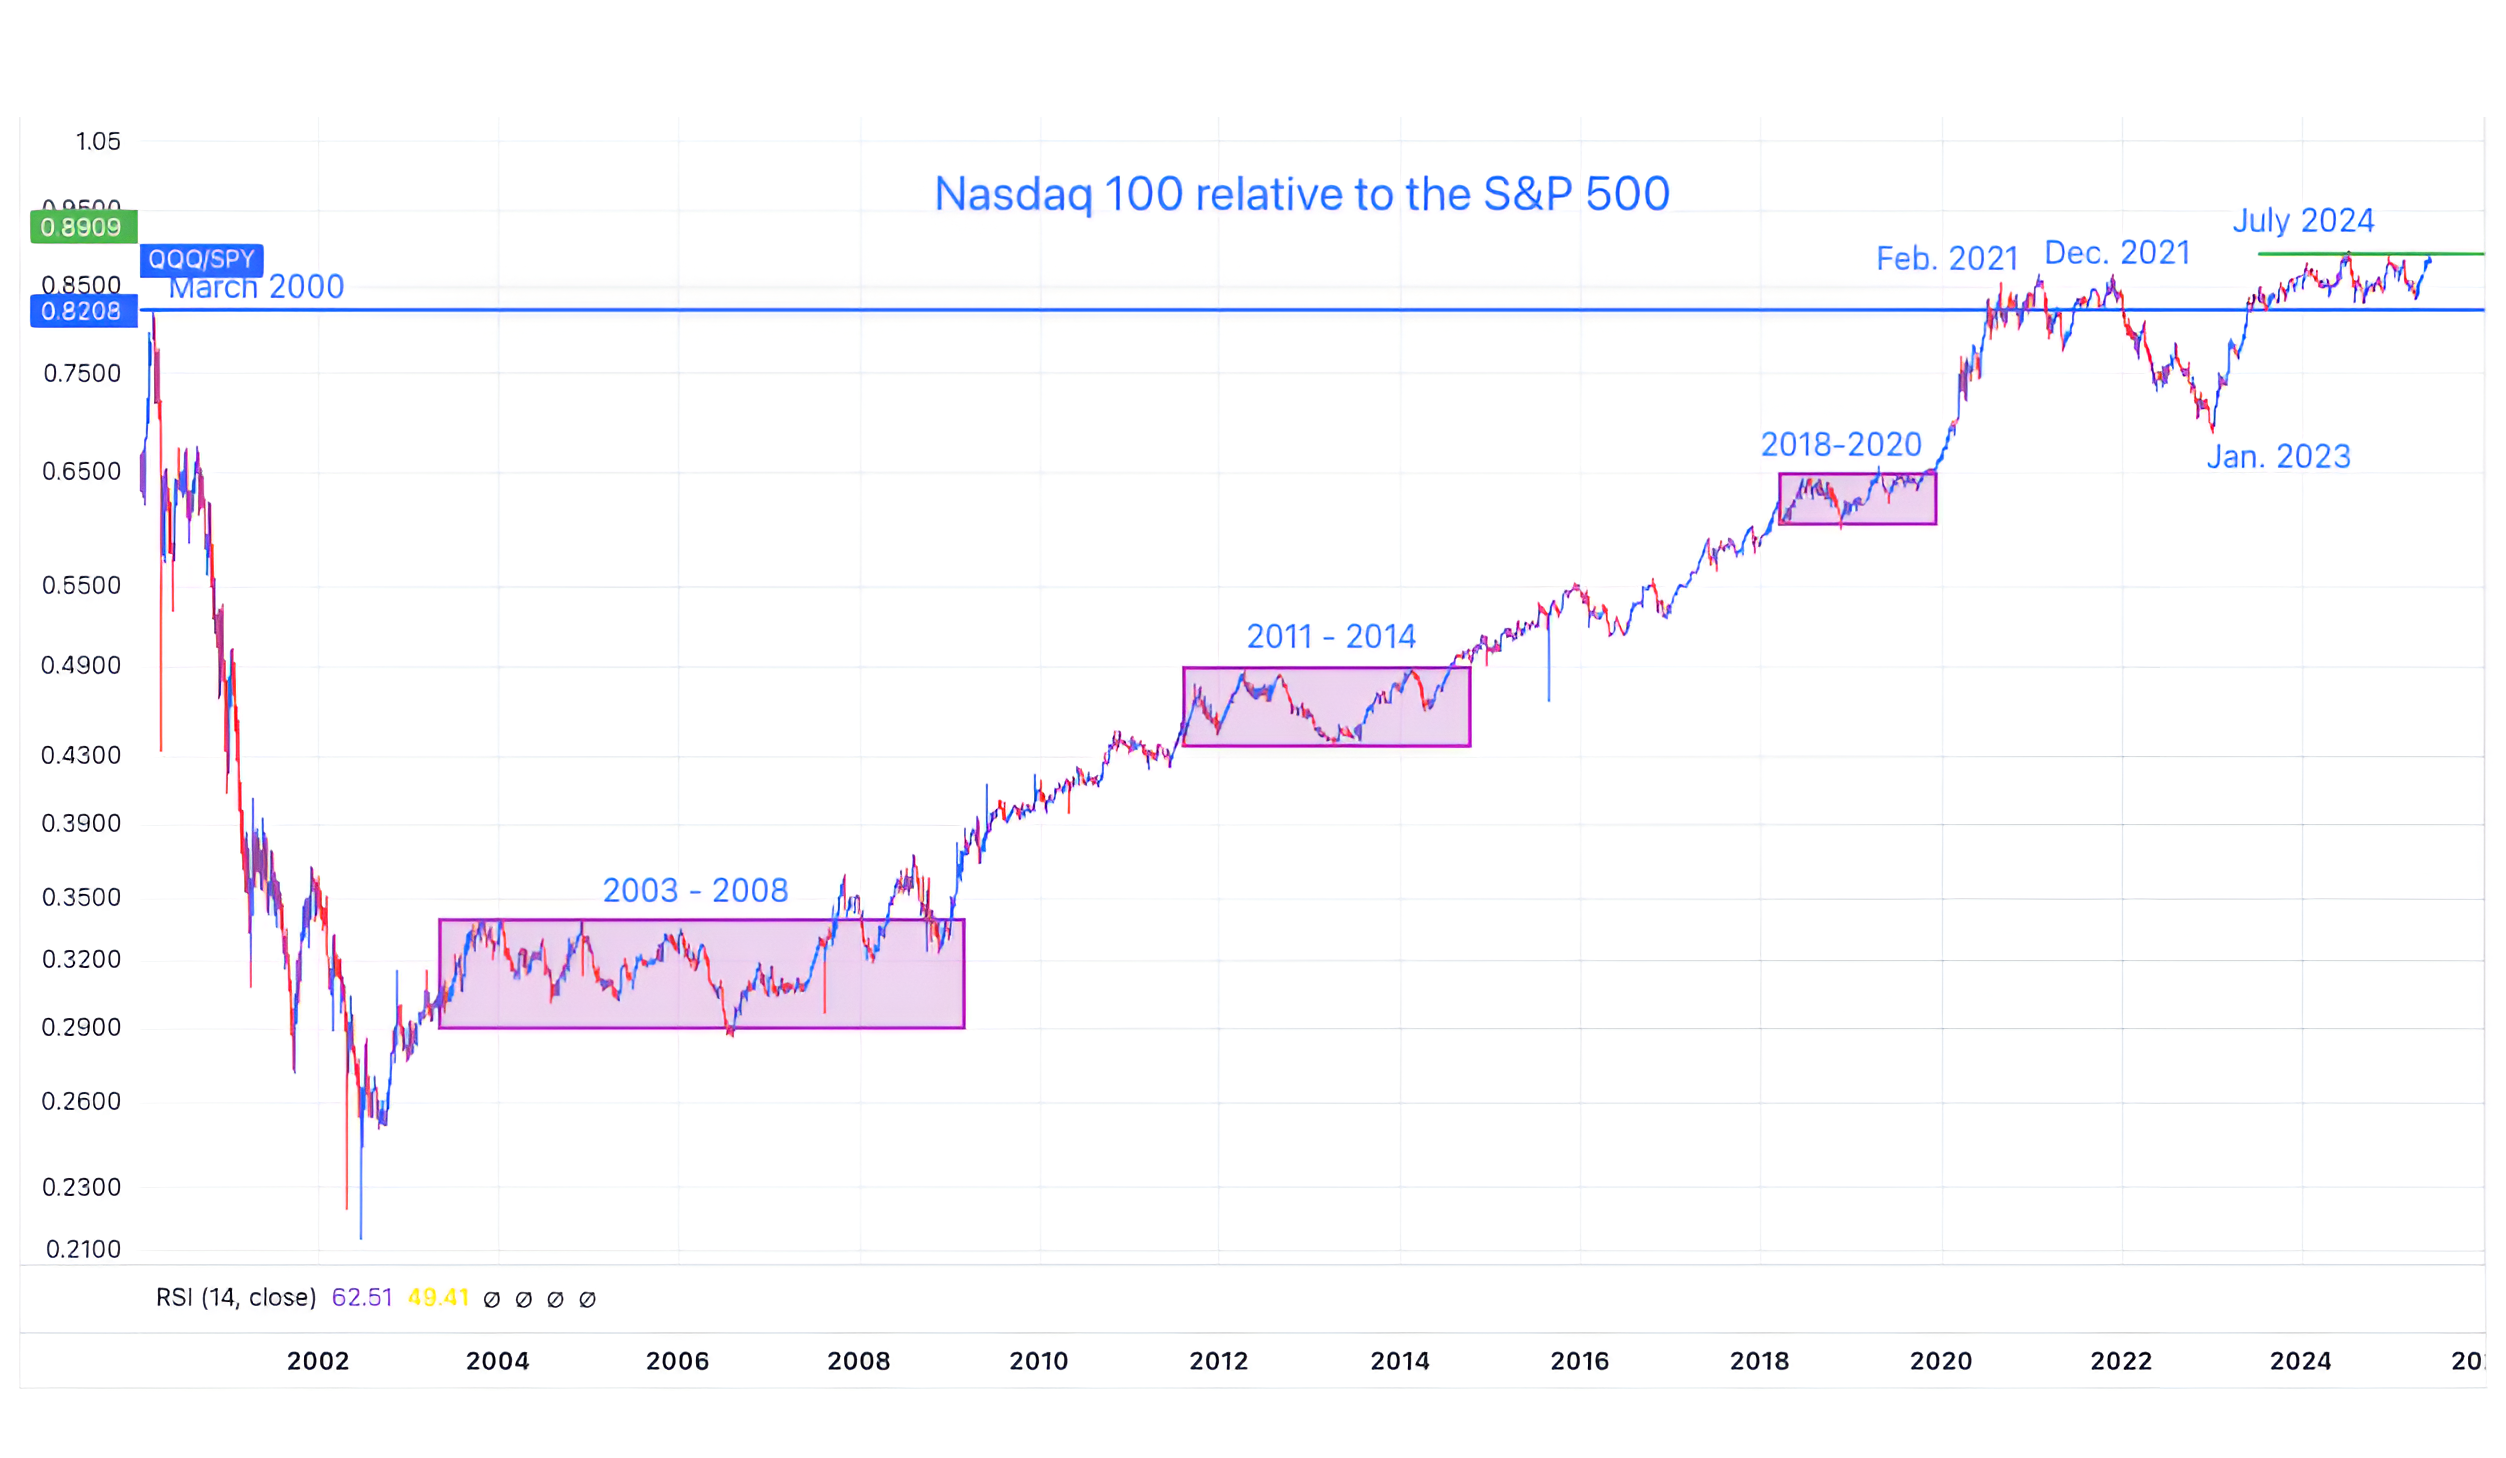
The chart above shows the Nasdaq 100 ETF (ticker: QQQ) relative to the S&P 500 ETF (ticker: SPY).
Last week, we showed that both the S&P 500 and Nasdaq 100 have both been moving sideways.
Today, we wanted to look at the long-term relative performance.
Remember, this essentially answers the question of would we rather be invested in the Nasdaq 100 or the S&P 500.
Obviously in the period from March 2000 to September 2002, investors did not want to be in the Nasdaq 100.
Since late 2002 - essentially 23 years, it has paid to be in the Nasdaq 100 rather than the S&P 500.
That being said, there have been periods of underperformance and equal performance (the boxes).
Since February 2021, after the initial period of post-covid outperformance (think Zoom video etc), the Nasdaq 100, despite AI has essentially traded in line with the broad S&P 500.
In fact, the relationship has been moving sideways in the zip code of its March 2000 peak.
If the Nasdaq 100 relative to the S&P 500 can move above its July 2024 peak (the current all time high), we believe it will once again be on a path to long-term outperformance.
This would continue the 22-year pattern of significant outperformance each time the relationship has moved above a long-term sideways move.
(This is not a recommendation to buy or sell any security and is not investment advice. Past performance is not indicative of future results. Please do your own research and due diligence).
2. Does Valuation Matter?

Source: Goldman Sachs. Through year-to-date 2025.
The chart above shows the current price to next 12 months (NTM) earnings valuations with their 20-year distribution ranges for different US equity indexes.
As I have stated and shown several times, the S&P 500 is in the top decile of its historical valuation levels.
When we consider that for most of the past 20 years the 10-Year Treasury Yield has traded below 3.3% (currently ~4.5%), on a relative basis (to the “risk free rate”) US equities are even more expensive than illustrated here.
As we highlighted at the end of last year (chart 4 here, chart 4 here and chart 3 here), valuation doesn’t tell you what will happen in the near-term, but it has a correlation of what investors should expect over the long-term.
(Past performance is not indicative of future results. This is not a recommendation to buy or sell any security and is not investment advice. Please do your own due diligence).
3. Tax Revenues as a % of GDP Surprisingly Consistent

Source: Federal Reserve Bank of St. Louis (“FRED”). Through year-to-date 2025.
The chart above shows Federal Receipts as a Percent of Gross Domestic Product (GDP).
Essentially this shows tax revenues as a % of GDP.
Since the post World War 2 period, US Federal Tax Receipts have generally averaged around 17% of GDP.
They have maintained this average regardless of income tax regime.
With this in my mind, one theory around the large current debt outstanding is to grow GDP as quickly as possible recognizing that 17% of a larger number can potentially (depending on the net spending) begin to address the deficit.
While I am sure there are holes in this logic, the idea that tax revenues as a percentage of GDP have remained relatively stable for 80 years is somewhat interesting.
(Past performance is not indicative of future results. This is not a recommendation to buy or sell any security and is not investment advice. Please do your own research and due diligence).
4. Driverless Cars Are Here

Source: YipIt Data. Through year-to-date 2025.
The chart above shows the % Share of Ride Bookings in San Francisco over the past two years split between Waymo (blue / Google); Uber (black) and Lyft (pink).
For those that don’t know Waymo is fully autonomous (no driver).
In other words, fully autonomous, driverless cars now have 27% of ride bookings in San Francisco and are projected to pass Uber in terms of share in the next 12 months.
Waymo is now doing over 700,000 rides per month in California, up from fewer than 100,000 a year ago.
I often try to highlight rapid transformative technology. There are not yet driverless taxis in New York, and I haven’t been in one (yet), but they are coming more quickly than we can imagine.
(Past performance is not indicative of further results. This is not a recommendation to buy or sell any security and is not investment advice. Please do your own due diligence).
5. Global Equities Don’t Care About Tariffs
Source: TradingView.. Through year-to-date 2025.
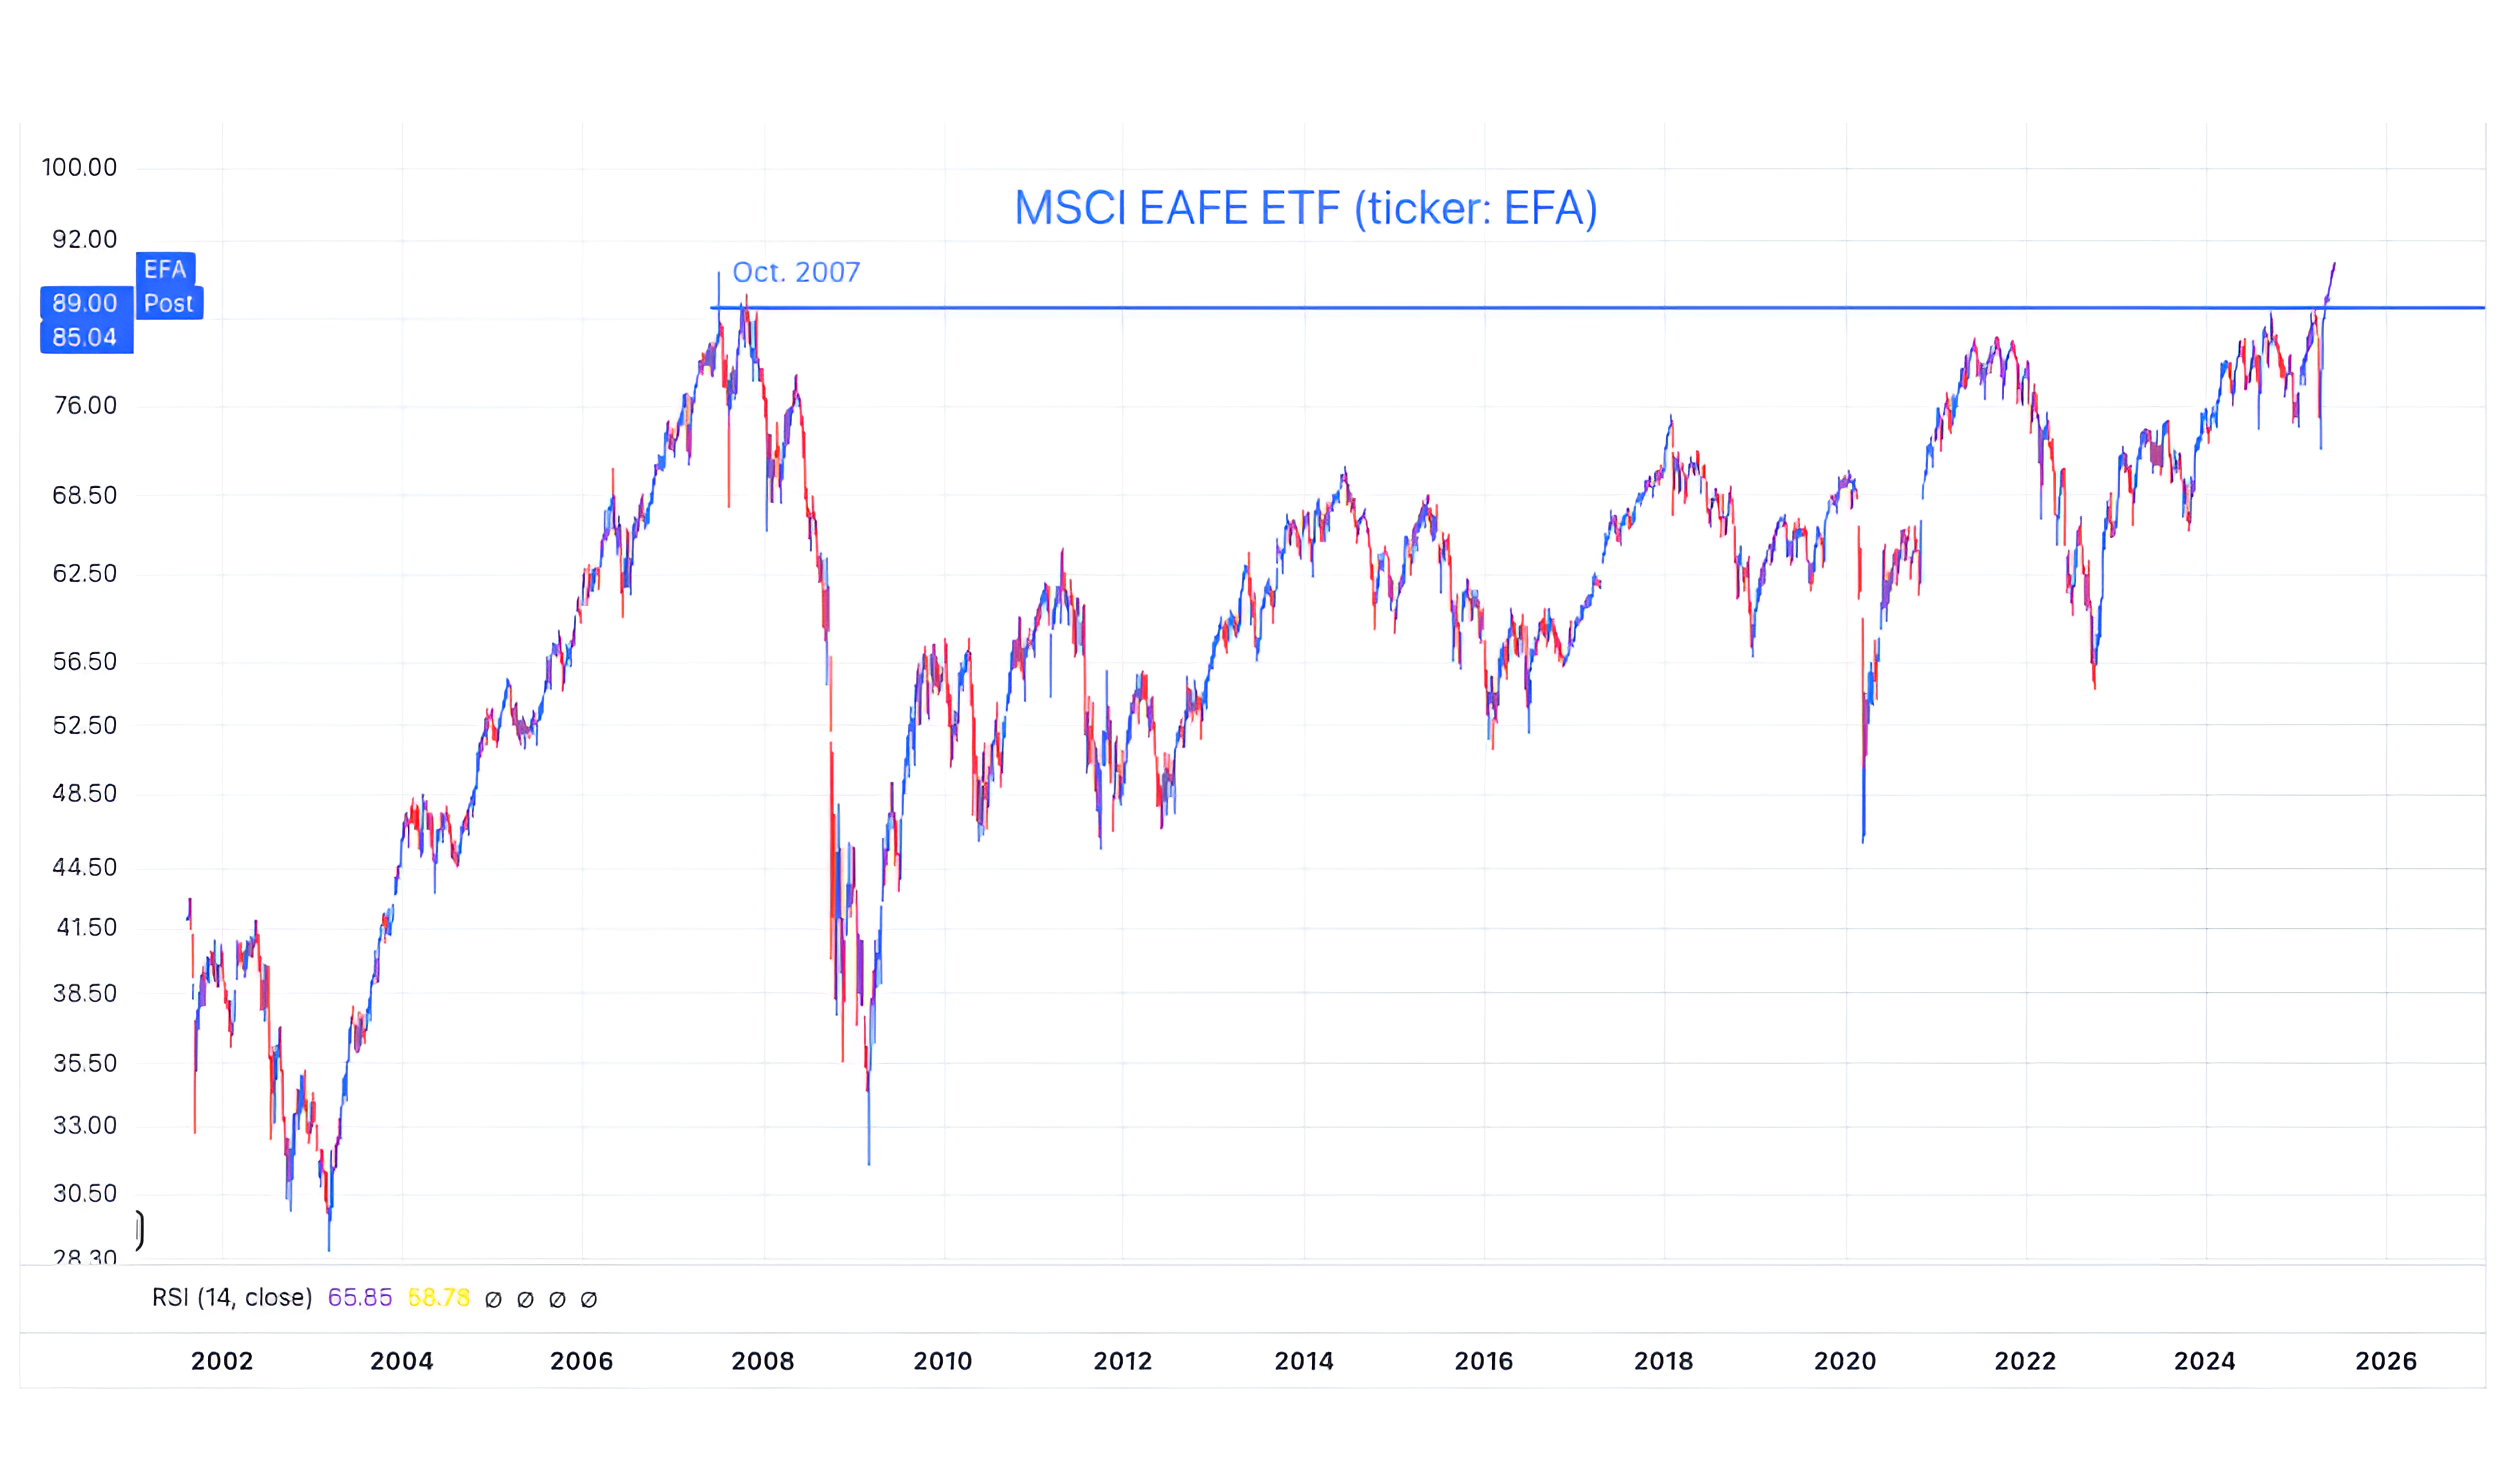
The chart above shows the MSCI EAFE Index ETF (ticker: EFA).
The EAFE Index is comprised of over 900 stocks in Europe, Australia, Asia and the Far East.
Despite recession concerns, tariffs and fear of inflation, the EAFE Index has hit a new high after 17.5 years.
As a prognosticator that I often follow likes to say, “you don’t have new highs in bear markets.”
(Past performance is not indicative of future results. This is not a recommendation to buy or sell any security and is not investment advice. Please do your own research and due diligence).