

I Can't Go For That! No Can Do...
We are covering puts and using cash to add back equity exposure (not advice). We'll see if this a trade or investment. Uncertainty remains, but the sell-off is extreme. Let's dig in...

Frequent readers know that we typically only publish on Tuesdays and Thursdays. Atypical times call for an atypical schedule.
We wanted to do a quick run through of some our thoughts that coalesced over the weekend.
This is all about the US debt outstanding, interest expense and the Fiscal Deficit (see chart 1 below). We have written about these topics in the past (interest expense chart 3 here; fiscal deficit chart 4 here; maturity wall chart 3 here).
We are used to monetary tightening leading to slowdowns - this is a fiscal tightening leading to a slowdown (see chart 4 below).
There are rifts and different views within the White House of how to handle tariffs: Elon vs. Navarro. This doesn’t help uncertainty, but could lead to a positive surprise vs. what is currently being priced in.
Tariffs are not being priced as inflationary. Lower oil price and 10-Year yields (which underpin mortgage pricing) help support the economy, reduce inflation expectations (see chart 3 below) and increase optionality for the Fed.
Sentiment and the sell-off are at extremes. While this might not mark a bottom, in general, these types of levels have been positive short and long-term buying opportunities (see chart 5 below).
Conclusion: We are covering puts and buying for a bounce.
While we will likely see lower levels (depending on policy outcomes), we view this as a good time for a trade and a potential initial entry for long-term buyers (see chart 5).
We will be back tomorrow.
(Several people have contacted me with questions, further details on policy and allocation suggestions, I am happy to help).

1. The US Treasury Maturity Wall

Source: Bloomberg, US Treasury, GLJ Research. Through year-to-date 2025.
The chart above shows the maturing US government debt by year. We showed a similar chart here.
To be fair, I’ve seen estimates in the range of $7 trillion up to $9 trillion (as in the chart above). I’ve also seen higher estimates of maturities for 2026 and 2027.
Why does the US have so much debt maturing in the near-term?
Issuing short-term debt was one of the “stealth liquidity” measures that I wrote about incessantly last year. (see an explanation in chart 3 here and chart 2 here).
The point remains - the US has a debt maturity wall.
Interest expense is already the third largest line item in the US budget. (See chart 3 here).
Mandatory spending - including social security, medicare, medicaid - currently represent 100% of US tax revenues.
To fund any other budget item - including interest payments, defense, education, transportation - the US must borrow.
As we wrote a year ago (chart 2 here):
“The challenge at this point is not only the additional issuance required to finance the growing fiscal deficit but also the refinancing.
From 2011 to 2020, 10-Year US Treasury yields were hardly ever above 3%.
As Bonds issued during that period mature, they will need to be refinanced at yields (currently) above 4%.”
While DOGE is trying to cut $1 trillion from spending, lower interest rates would definitely help. (We showed the Fiscal Deficit as a % of US GDP - chart 4 here).
The idea behind the tariffs is a somewhat stealth consumption tax increase.
In the words of Stanley Druckenmiller:
“Because we have a fiscal problem, we need to raise revenues.
Our main choices are an income tax and a consumption tax like a tariff.”
While we can debate policy (tariffs are not my favorite, but Druckenmiller argues that they are the least bad alternative), the key problem - in my view - has been the implementation.
First, the announcement of reciprocal tariffs and then the nonsensical calculation.
Second, the wavering in terms of timing. Trump has a precedent of delaying timing (see Canada, Mexico and Tik-Tok sale) this adds to uncertainty.
This uncertainty forces the market to price in the worst case scenarios and makes it impossible for CEOs and corporations to invest for the future and make spending decisions.
It is also very difficult to understand the current priorities of the administration:
Was the tariff announcement the starting point for a serious negotiation or will this be implemented simply to raise revenues?
Is the goal free trade or to eliminate trade deficits?
On point one, in my view, the administration would like to see $200-300 billion a year in revenues from new tariffs - roughly half of what was announced last week. They will negotiate, but this will be a messy process.
On the second point, there is clearly debate in the White House.
Elon Musk is pro free trade (he proposed a free trade block between the US and Europe) whereas Peter Navarro (who is currently “winning”) wants to eliminate trade deficits.
Finally, when we warned of a potential sell-off in the first half of this year, this is the chart that had our focus.
If the refinancing and fiscal deficit were ignored, in my view, 10-Year yields would have moved substantially higher.
While Trump has tried to address this challenge through tariffs which Druckenmiller sees as a consumption tax, it is likely Kamala Harris would have tried to address this through higher corporate and individual income taxes.
Either way, in our view, would have led to a 20-30% drawdown in US equities - particularly given starting valuation.
From a market perspective, the biggest challenge with Trump policy, from current levels, may be the uncertainty around it.
(This is not a recommendation to buy or sell any security and is not investment advice. Past performance is not indicative of future results. Please do your own research and due diligence).
2. What Will Happen to Earnings?
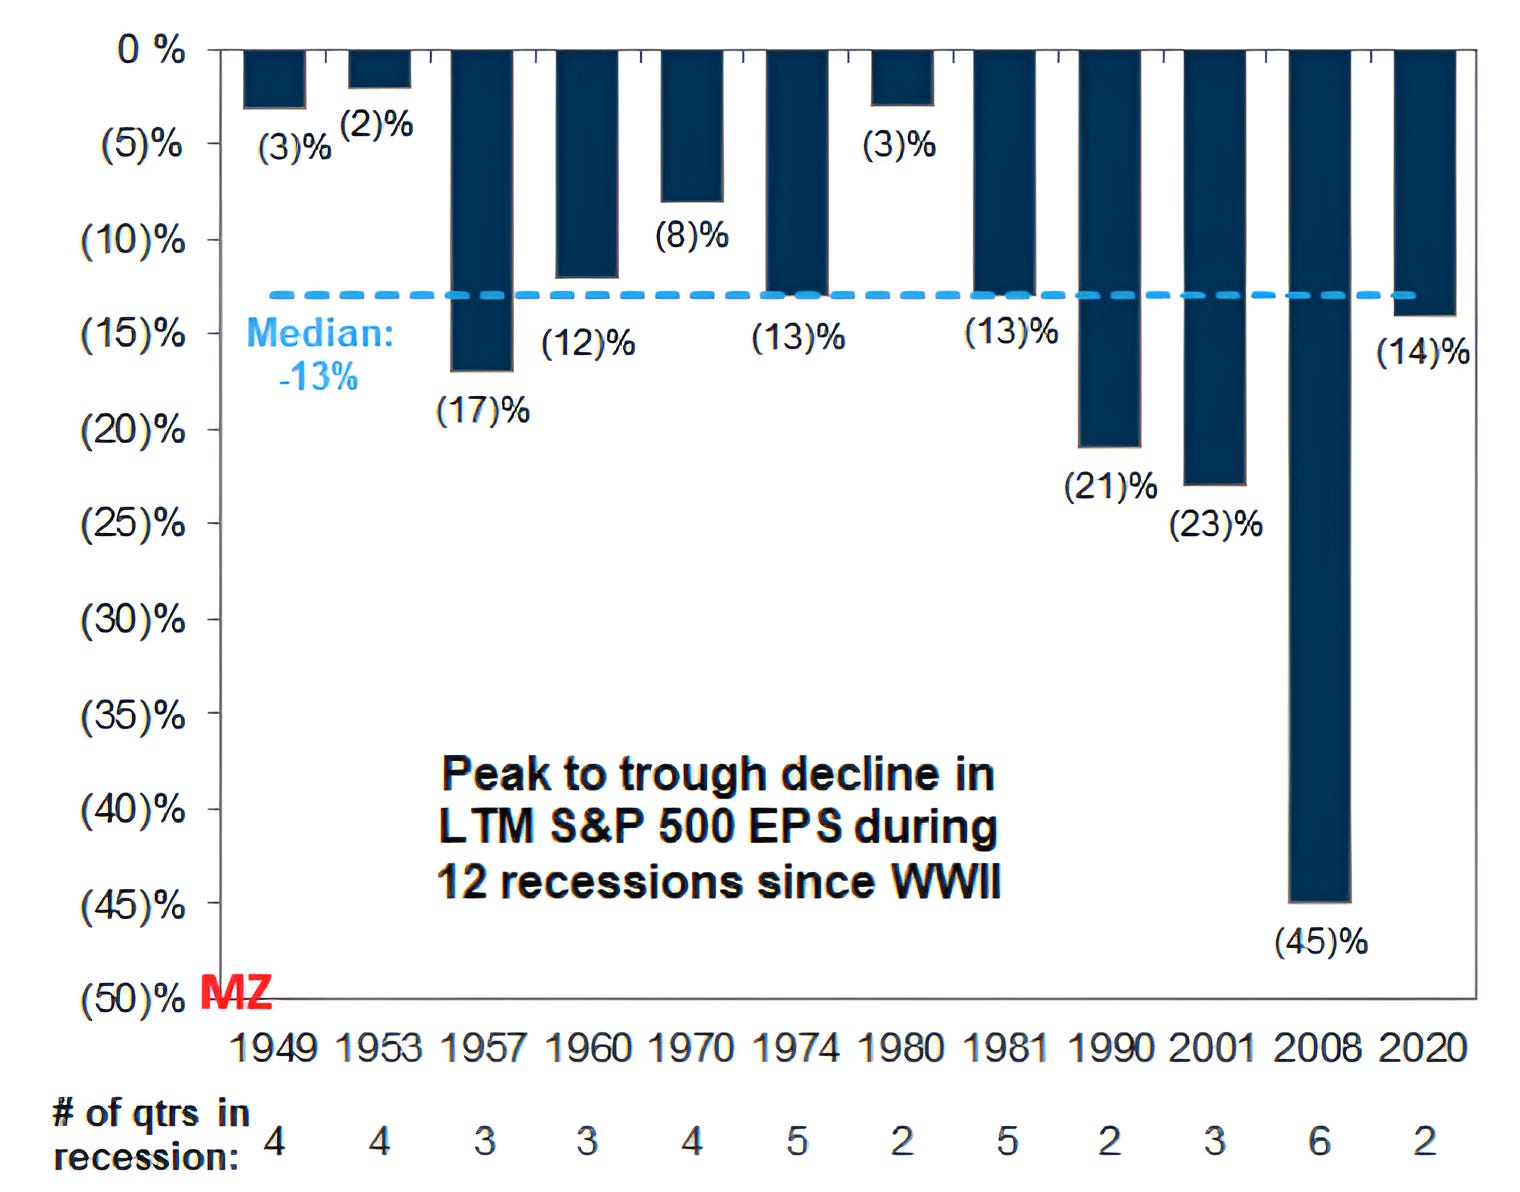
Source: Goldman Sachs. Through year-to-date 2025.
The chart above from Goldman Sachs shows the historical S&P 500 earnings drawdowns during US recessions and the number of quarters in each recession.
Although we typically consider next 12 months earnings, this chart is based on last 12 months (LTM) earnings.
Last 12 months earnings were $248. The median drawdown has been -13%.
In the event of a 15% earnings drop, S&P 500 trailing earnings would be $210.
While this would be difficult, in our view, in terms of market impact from current levels, the duration of the recession might be as important as the drawdown in earnings.
As an example, if Q1 experienced negative growth as currently estimated by GDP Now (here) and Q2 represented the second consecutive quarter of negative growth, in a two quarter recession scenario, the US could be half way through the recession.
If the Trump administration is able to pass tax cuts in the near-term or if it seems that tax cuts will be passed, the market may “look through” the earnings drawdown and begin to price in a more optimistic earnings scenario (especially if there is a corporate tax cut) while last 12 months earnings are declining. (This is the baton handoff / “mind the gap” scenario we’ve been mentioning)
In a longer-recession scenario, a market recovery, in our view, may be a more difficult climb.
We have also written about a trough PE multiple in the range of 15x forward earnings. (See chart 3 here or chart 3 here).
Unfortunately, even with the $300 in S&P 500 earnings expected in 2026, 15x earnings would be 4500.
As we wrote last Tuesday (here), 4500 would be in line with the possible correction range (4200-4800) that we first started expecting in early June 2024.
Over time, the S&P 500 can re-achieve an 18-19x forward multiple and the index can move back towards 5600.
Although we see lower levels in the S&P 500 over time, we expect to see a near-term bounce before we move lower.
(Past performance is not indicative of future results. This is not a recommendation to buy or sell any security and is not investment advice. Please do your own due diligence).
3. The Market is Not Viewing Tariffs as Inflationary
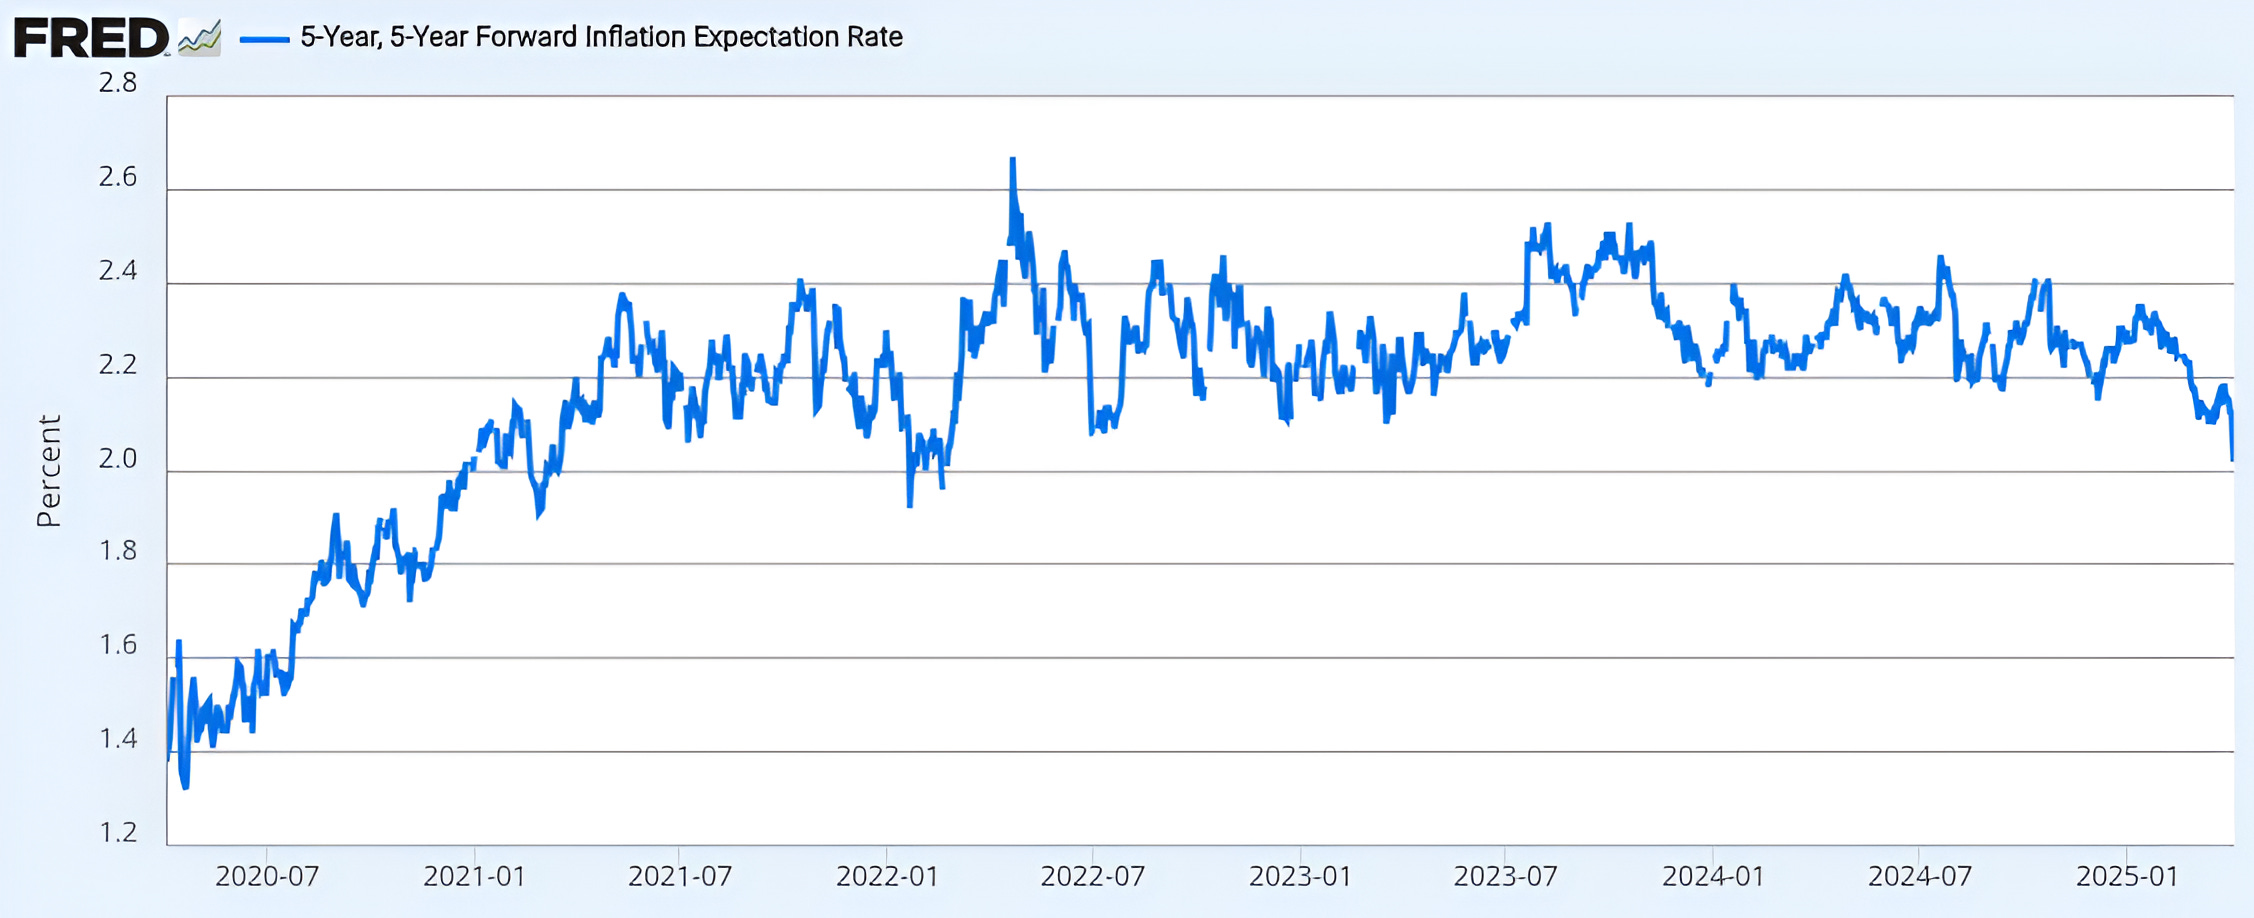
Source: Federal Reserve of St. Louis (“FRED”). Through year-to-date 2025.
The chart above shows 5-Year Breakeven Inflation Rate.
The 5-Year Breakeven Inflation Rate is the market based rate of inflation expectations and is a measure of what investors expect inflation to be over the next five years.
We last showed this chart six weeks ago here.
At the time, we were concerned as inflation seemed to be trending higher.
With the tariff announcement last week, if you look closely, there was a drop in inflation expectations.
This could be because investors see a recession that would likely be disinflationary or because oil prices have fallen.
Regardless, this will provide scope to the Fed to act (now four cuts priced in for 2025, up from a low of one at the end of 2024) should they decide to do so and will likely be a factor in lower 10-Year Treasury yields (we wrote about our views on 10-Year Treasury yields last Thursday).
(Past performance is not indicative of future results. This is not a recommendation to buy or sell any security and is not investment advice. Please do your own research and due diligence).
4. A Massive Fiscal Tightening
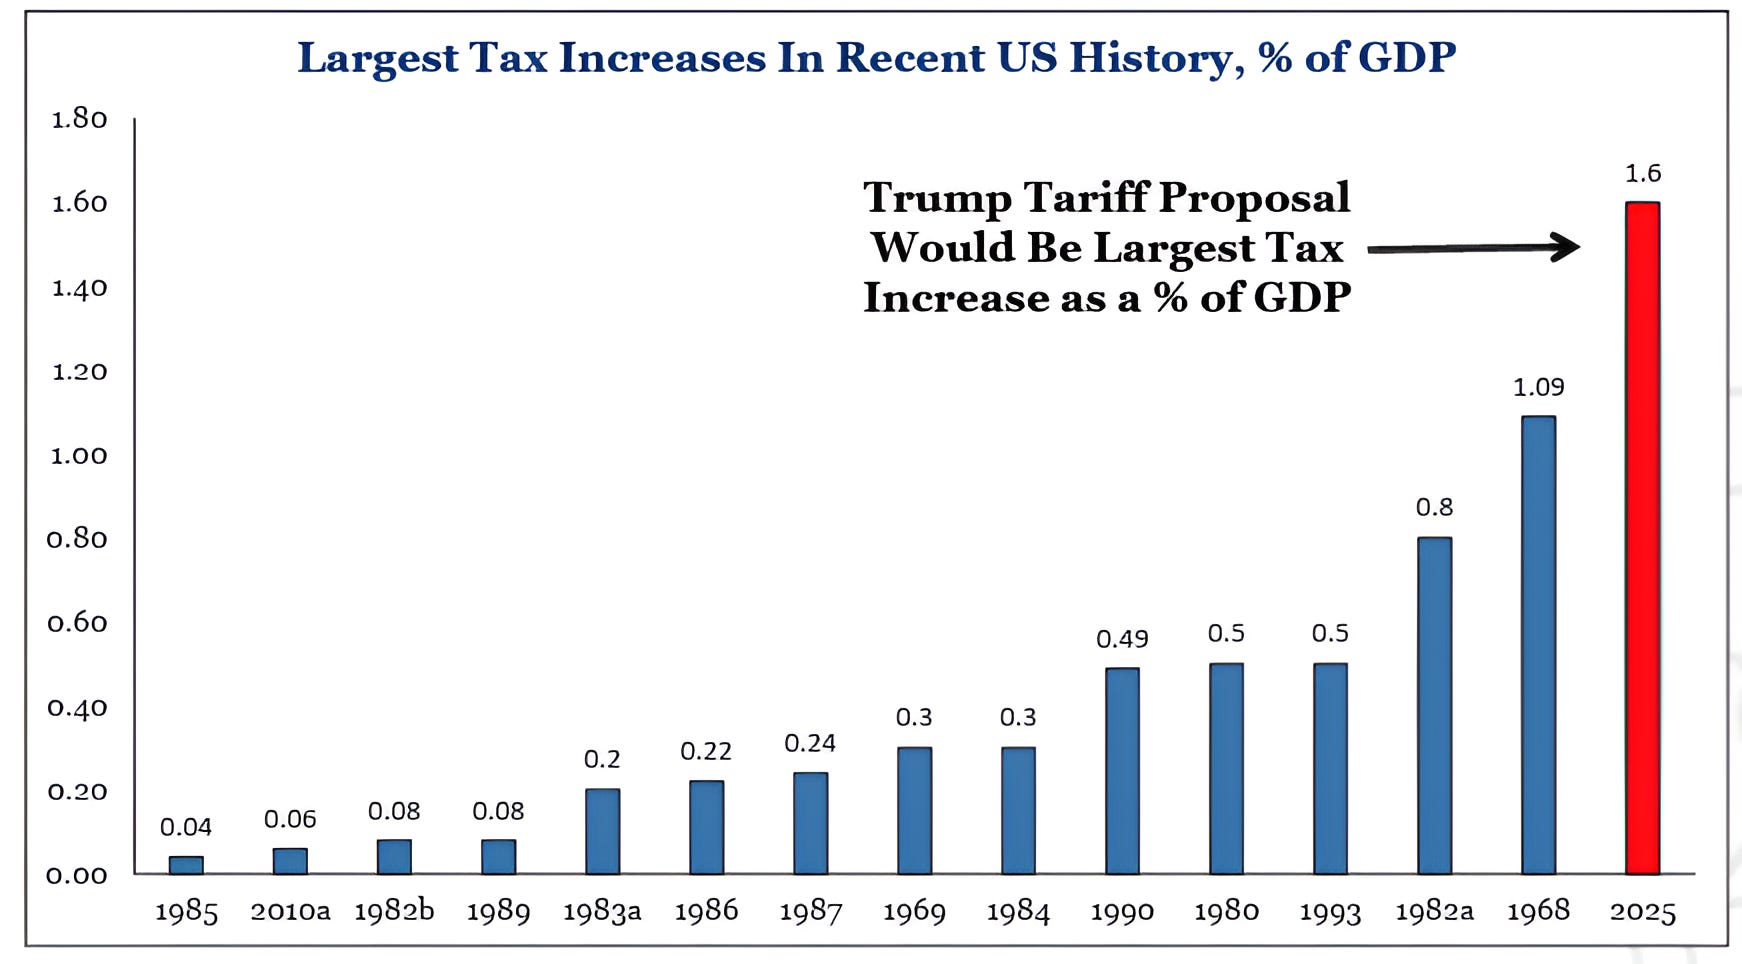
Source: Strategas. Through year-to-date 2025.
The chart above shows the largest tax increases in the US since 1969.
While this is likely to change - it is important to understand why the market and economists have reacted the way they have.
The US has not had a fiscal tightening in the past 15 years and other than a small one in 2010, there has not been one since 1993.
The current tariff proposal represents a massive fiscal tightening which would be the largest single tax increase in 55 years.
However, five of the Tax increases in the chart above took place from 1980 through 1984 (Reagan term 1) and in aggregate were larger than the current tax increase via tariffs. Along with monetary policy, this beat inflation.
As stated in chart 1 - some sort of tax revenues was necessary.
The likelihood (or at least the stated plan) is that the Trump administration will cut other taxes and largely offset this tightening with the hope of growing GDP.
(Past performance is not indicative of further results. This is not a recommendation to buy or sell any security and is not investment advice. Please do your own due diligence).
5. Rapid Equity Drops Have Been Bullish Long-Term

Source: Charlie Bilello / Creative Planning. Through year-to-date 2025. Through year-to-date 2025.
The chart above shows the ten largest two-day S&P 500 declines and forward returns since 1950.
With the two-day 10.5% S&P 500 drop last week - the move ranks as the fifth largest two-day decline over the past 75 years.
While the two day declines have not always represented the low of the cycle - and there is overlapping data in the chart (large two day declines followed by other large two-day declines in October / November 2008) - they have provided attractive entry points for longer-term investors.
(Past performance is not indicative of future results. This is not a recommendation to buy or sell any security and is not investment advice. Please do your own research and due diligence).