


Good Vibrations!
Political volatility has been greater than market vol. Trump has made up with Elon, announced a preliminary agreement with Xi and Cali. has calmed. Will the Fed provide support next? Let's dig in...

Two weeks ago (here), we presented our theory that what had once been a Fed put - the idea that if there was volatility in the market, the Fed would come to the rescue by providing (or at least hinting at) stimulus - had morphed first into a Treasury put (see our work on stealth stimulus) and more recently a White House put.
This week, as Trump made up with Elon “I regret some of my posts about President Trump last week. They went too far” Musk and announced (reannonced?) the framework of a trade agreement with China, we couldn’t help but think about our White House put theory.
However, four big known “unknowns” remain:
The Fed meeting next week. Will the Fed present an easier posture than it has over the last three months? (see chart 4, below);
Corporate earnings. Will tariffs and uncertainty weigh on earnings? Will the weak dollar support earnings? Will there simply be relief that earnings have (once again) surpassed lowered expectations? (see chart 3, below);
Tariff resolution. It continues to look like a 10% tariff rate for most of the world and a higher level for China will be the outcome. Will there be surprises? (In our view, this has largely been resolved and digested by the market, but never say never).
The One Big Beautiful Bill. What will come out of the Senate (fewer tax cuts and potential disappointment?) and how will the House and markets react?
For now, we continue to see US (and global - see chart 5, below) equity markets drifting higher as sentiment continues to work its way back towards optimism from extreme pessimism.
However, we see volatility re-asserting itself in July.
In honor of Brian Wilson, the Beach Boys and simpler times, I have titled today’s report:
“Good Vibrations!”

1. Nasdaq 100: A Possible Path

Source: TradingView. Through year-to-date 2025.
The chart above shows the Nasdaq 100 ETF (ticker: QQQ).
Over the past two Thursdays (here and here), we have showed the Nasdaq 100 ETF target level of $580 based on an inverse “head and shoulders” pattern that had formed from March through early May with a neckline around $492.50. (Not included on today’s chart).
Today, we are considering the possibility of a larger inverse head and shoulders pattern that began in December 2024 and may not be confirmed (if at all) until Q4 2025.
In the near-term, in our view, we could see the Nasdaq 100 ETF make a new all-time high and move into the $550 neighborhood over the next month.
As we have been highlighting, we expect a mild sell-off to begin in mid-July to early-August.
The sell-off could bring the Nasdaq 100 ETF back down to the $500 level. (As an aside, $500 is the 1.618 extension of the 2022 sell-off that we have been highlighting for some time).
This would be a 5-10% correction from our expected high and would set the Nasdaq 100 up for a year-end rally towards $580.
(See chart 5 for a possible path).
(This is not a recommendation to buy or sell any security and is not investment advice. Past performance is not indicative of future results. Please do your own research and due diligence).
2. Using the Equal Weight S&P 500 as a Guide
Source: TradingView. Through year-to-date 2025.
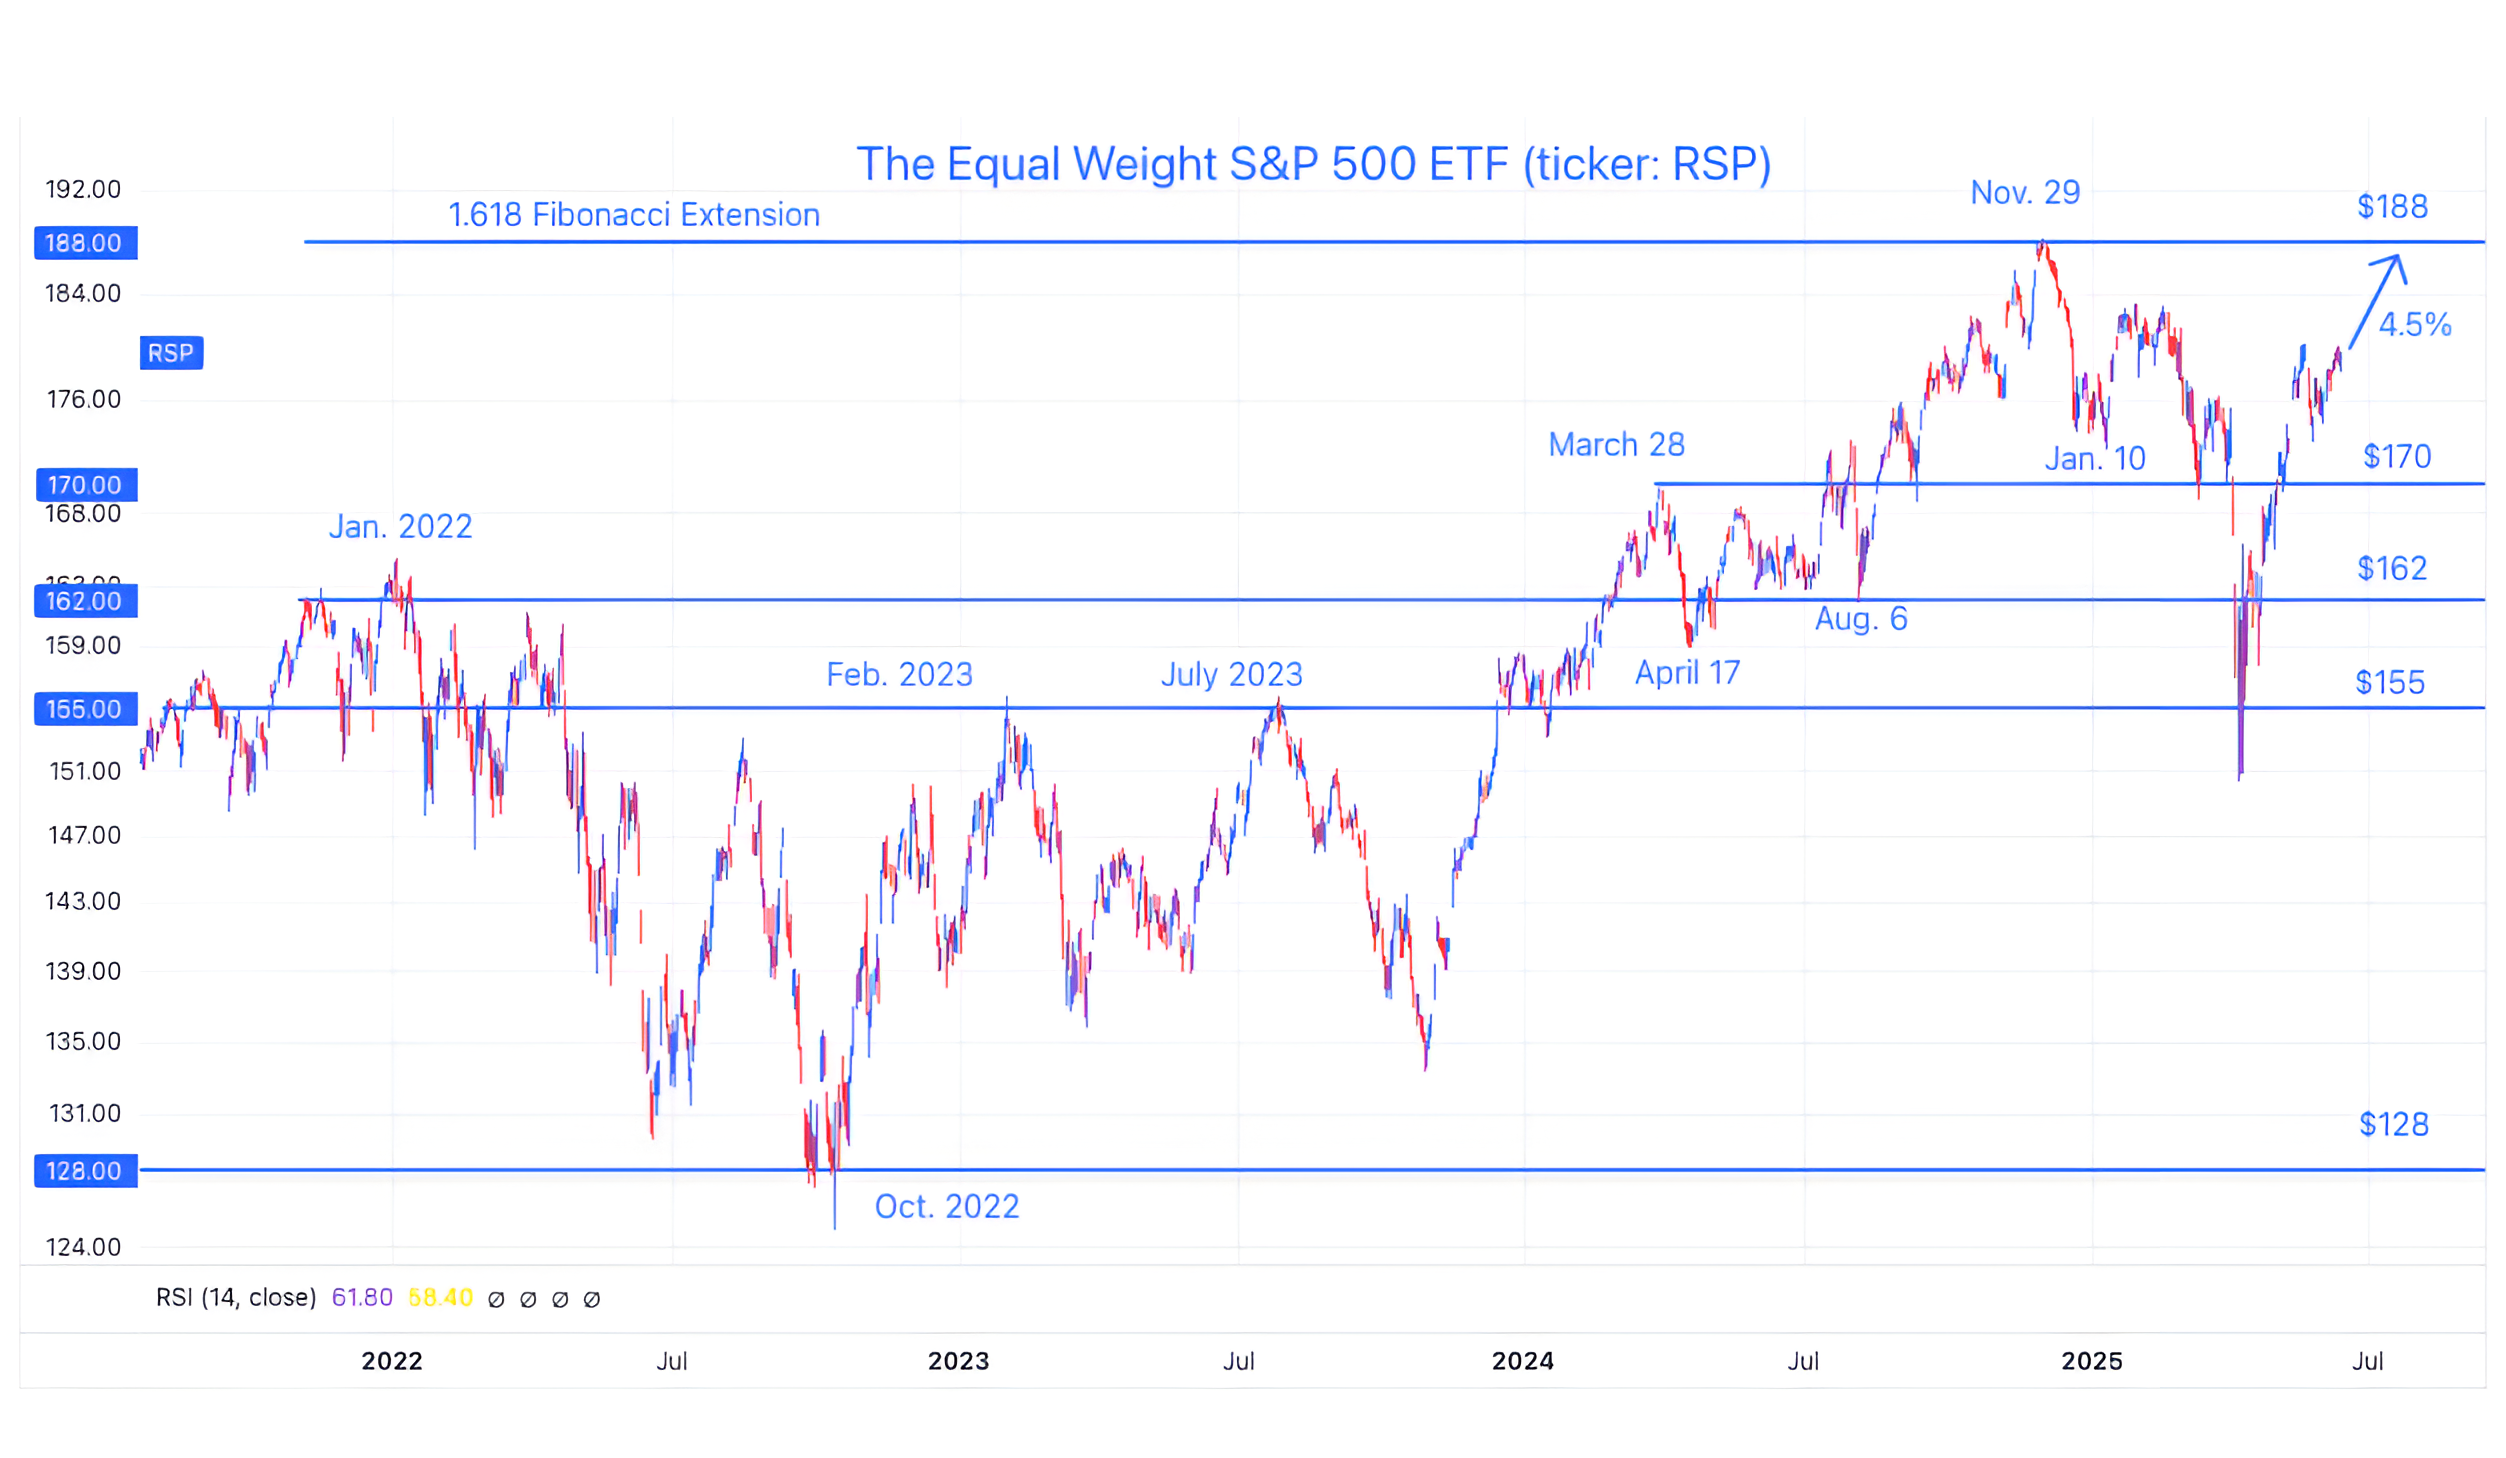
The chart above shows the Equal Weight S&P 500 ETF (ticker: RSP).
While we are expecting the S&P 500 and Nasdaq 100 to achieve new all-time highs, we believe that there is a higher likelihood that the Equal Weight S&P 500 will remain constrained by its November 29 all-time high that coincides with the 1.618 Fibonacci extension of the 2022 sell-off.
(In other words we believe it’s less likely that the Equal Weight S&P 500 makes a new meaningful all-time high).
The November 29 all-time high in the Equal Weight S&P 500 is ~4.5% above current levels and when the Index begins to arrive in that neighborhood, we will likely begin to reduce our overall equity exposure and / or add put protection.
(Past performance is not indicative of future results. This is not a recommendation to buy or sell any security and is not investment advice. Please do your own due diligence).
3. S&P 500 Earnings Growth is Slowing

Source: Strategas. Through year-to-date 2025.
The chart above shows the year over year change in next 12 months (ntm) S&P 500 earnings.
Essentially S&P 500 earnings growth is expected to slow.
There are two ways to think about this:
Expectations are being lowered and, therefore, will be easier to surpass; or
Should we really be paying top decile valuations for slowing, non-robust earnings growth?
We will provide another look at earnings next week, however, it has seemed that positive earnings surprise (relief) has been more important than growth.
We will see if that continues.
(Past performance is not indicative of future results. This is not a recommendation to buy or sell any security and is not investment advice. Please do your own research and due diligence).
4. The Two-Year Treasury Isn’t Providing Any Monetary Clues…

Source: TradingView. Through year-to-date 2025.
The chart above shows the 2-Year US Treasury Yield.
The yield of the 2-Year Treasury bond reflects the “bootstrapped” path of shorter-term yields (bootstrapped is a CFA word, not mine) over the next two years and, as a result, incorporates expected Fed decisions.
The current Fed Funds target range is 4.25-4.50%; the 2-Year US Treasury yield is 3.9%.
In other words, the Yield of the 2-Year Treasury bond has priced in at least two Fed Funds rate cuts .
What’s interesting is that after the US tariff announcements, 2-Year Treasury Yields have moved down to a lower range (below 4.05%) indicating that the market views the slowing growth risk of tariffs as more likely than the inflationary risk.
That said, with the upcoming Fed decision (next Wednesday), the 2-Year US Treasury yield has remained in a range for the last month and has hardly moved.
In other words, the 2-Year US Treasury yield is waiting for the Fed meeting to react rather than pricing in an expectation in advance of the announcement.
(Past performance is not indicative of further results. This is not a recommendation to buy or sell any security and is not investment advice. Please do your own due diligence).
5. European Equities: Strong to Quite Strong

Source: TradingView. Through year-to-date 2025.
The chart above shows the Vanguard European Equity ETF (ticker: VGK).
We last showed this in late April (here) and at the time said, “We think there’s a possibility that the third trip above the 2021 ceiling could be more sustainable [than the prior two].”
After a six week 24% move higher, the Vanguard European Equity ETF is hitting new all-time highs. We would likely wait for it to calm down and pull back before adding exposure.
In addition to showing this to provide an update on European equities, we wanted to highlight the path that the European Equity ETF took en route to new highs.
On March 19 - the European Equity ETF hit a new high around 4.5% above its previous all-time high.
It then fell back to a historical support level (its pre-covid high) and then rallied above its March 19 peak.
This is the type of path that we envision (maybe not as extreme) for the S&P 500 and Nasdaq 100.
Have a great weekend!
(Past performance is not indicative of future results. This is not a recommendation to buy or sell any security and is not investment advice. Please do your own research and due diligence).