Do You Really Want to Hurt Me?
Trump vs. Powell 2.0. The "stealth liquidity" that we highlighted last year may be running out while the Fed is focused on potential inflation. Further equity pressure may be building. Let's dig in...
Do you remember December 2018?
On December 18 2018, Fed Chair Powell hiked interest rates and maintained quantitative tightening (shrinking the Fed’s balance sheet) in what the market perceived to be a hawkish move.
The market had peaked in October and was beginning to price in an economic slowdown. The Fed gave no indication of deviating from its tighter policy and provided no relief.
At the time, several economists and strategists believed the Fed was over-tightening and making a policy error that would lead the US economy into a 2019 recession.
Fed Chair Powell seemed tone-deaf.
On December 22nd 2018, the headline on CNBC (here) was, “Trump reportedly wants to fire the Fed chair, a move that could wreak havoc on the financial markets” while Bloomberg wrote, “Rattled Markets Would ‘Erupt’ If Trump Fired the Fed Chairman” (here).
The S&P 500 fell 11% from the December 18 policy meeting to December 24.
On December 26th, the S&P 500 began to rally (the market was closed on Christmas) as there were hints that Powell would soften his stance.
One week later, on January 4, Powell indicated that the Fed would be flexible: “We’re listening carefully with – sensitivity to the message that the markets are sending and we’ll be taking those downside risks into account as we make policy going forward.”
A combination of the markets, the economy and Trump (mainly the market in my view), led Chair Powell to change his tone.
Yesterday, Fed Chair Powell noted the uncertainty around the tariff policy:
“We may find ourselves in the challenging scenario in which our dual-mandate goals [of full employment and inflation] are in tension…For the time being, we are well positioned to wait for greater clarity before considering any adjustments to our policy stance.”
This morning the CNBCs headlines included: “Trump again calls for Fed to cut rates, says Powell’s ‘termination cannot come fast enough.’”
Elizabeth Warren (who encouraged the Fed to cut aggressively last year) warned that, “Markets will ‘crash’ if Trump can fire Powell.”
I happen to agree with Elizabeth Warren on this as I believe an independent central bank is a critical attribute of healthy financial markets.
Beyond simply a “crash” (down 10-15%), I believe that firing the head of the central bank would constrain future valuation multiples.
(As an aside, Fed Chair Powell’s term ends in May 2026).
That said, my point in presenting the events of 2018 is to say that we have seen many parts of this movie before - including the same leading characters.
Will the outcome be the same?
There are some differences this time:
Unlike 2018, the Fed is not currently in a tightening cycle. They have been cutting interest rates, have paused and have recently slowed quantitative tightening. It should make it easier to resume easing.
In 2018, President Trump had been publicly criticizing Fed policy for month’s (since at least August) before this series of events occurred. The vocal criticism of the Fed in the current period seems to have just begun.
In December 2018, the S&P 500 bottomed at 15x forward earnings (see chart 3 here). While there’s nothing magical about this number, it has seemed to have a gravitational pull in most sell-offs.
Currently, the S&P 500 is still valued at 19x forward earnings and this is before future earnings have been revised lower to reflect tariffs.
One of our strongest market philosophies is based on the wisdom of Stanley Druckenmiller:
“Earnings don’t move the overall market; it’s the Federal Reserve Board… focus on the central banks and focus on the movement of liquidity… most people in the market are looking for earnings and conventional measures. It’s liquidity that moves markets.”
In other words, we want to keep a close eye on liquidity.
Within our framework - this is not only traditional Fed liquidity, but it also the “stealth liquidity” measures that the Treasury utilized over the past two years.
(For new readers, “stealth liquidity” was a theme of ours throughout last year - see here, here, here, here, here, here, here, chart 4 here and here).
When we have considered “stealth liquidity” measures, in general, we have highlighted three tools:
the Treasuries General Account (“TGA”) (chart 2 here);
Reverse Repos (see Chart 2 below); and
the issuance of short-term Treasury Bills rather longer-term notes.
The issuance of short-term Treasury Bills rather longer-term notes has led us to the debt maturity wall that we have been highlighting (chart 1 here).
In our view, the Treasury has to retire short-term debt and issue longer-term debt - meaning that this liquidity tool is no longer available.
Reverse Repos (chart 2 below) are at their lowest level in three years. There is very little liquidity is left in this tool.
And the Treasury General Account is expected to be drained by August (Dan Clifton from Strategas (chart 2 here).
In other words, the non-traditional “stealth liquidity” measures that the Treasury has been able to use over the past two years have been nearly drained.
While Scott Bessent and Treasury may be able to conjure up some liquidity tricks, the economy and markets are now nearly solely reliant on the Fed for support.
Based on Fed Chair Powell’s statement yesterday, the Fed is not ready to apply any support yet.
Although it is difficult to time, given:
the Fed’s current stance;
tariff uncertainty;
cuts to earnings outlooks;
still elevated valuations;
and the inability of the Treasury to provide significant “stealth liquidity”
US equities will likely at least retest their lows (we put this at a ~70% chance over the next two to three months. We are watching for signals to confirm or reject this thesis - see chart 3).
At that point, we will watch for the Fed to respond.
My question for Chair Powell going into a three day weekend is:
“Do You Really Want to Hurt Me, Do You Really Want to Make Me Cry?”
1. Nasdaq 100 ETF: Fighting with the March 2024 High
Source: TradingView. Through year-to-date 2025.
The chart above shows the Nasdaq 100 ETF (ticker: QQQ).
The Nasdaq 100 ETF has been fighting with its March 2024 high at 449.
After its large one-day rally last Wednesday (April 9), the Nasdaq 100 ETF has not made it back to its April 9th intraday high.
As stated above, in our view, there is a ~70% chance that the resolution is lower.
With earnings coming and negative revisions likely and valuations still elevated, we continue to believe that the Nasdaq 100 (like the S&P 500) will “re-test” the April 7th low / November 2021 high.
(This is not a recommendation to buy or sell any security and is not investment advice. Past performance is not indicative of future results. Please do your own research and due diligence).
2. Reverse Repos Are Drained
Source: Federal Reserve of St. Louis (“FRED”). Through year-to-date 2025.
The chart above shows the balance of Overnight Reverse Repo Agreements (RRP).
Although this is an esoteric data set - Reverse Repos are one of the three components of our “stealth liquidity” framework (the Treasury General Account and the issuance of short-term notes rather than long-term treasuries are the other two) that we have been highlighting.
(See the introduction here for context).
Reverse Repos are how excess cash is temporarily parked at the Fed. Financial institutions lend to the Fed, receive collateral (typically Treasuries) and earn interest.
In 2021–2023, Reverse Repo balances surged to over $2.5 trillion which was a symptom of too much liquidity in the post-covid stimulus period.
Although it’s a little difficult to see on the chart, yesterday, the Reverse Repo market dropped $34 billion to $55 billion, the lowest level since April 2021.
This drawdown is an indication that reserves are being pulled from the banking system and liquidity is no longer in surplus. (Bank liquidity is tight).
Financial institutions are hoarding cash rather than lending.
If this continues, it will put stress on the system (as it did in the second half of 2019).
In our view, if this occurs, it is likely that equity markets will sell-off and the Fed will react by injecting liquidity (QE, rate cuts, collateral facility extensions).
(Past performance is not indicative of future results. This is not a recommendation to buy or sell any security and is not investment advice. Please do your own due diligence).
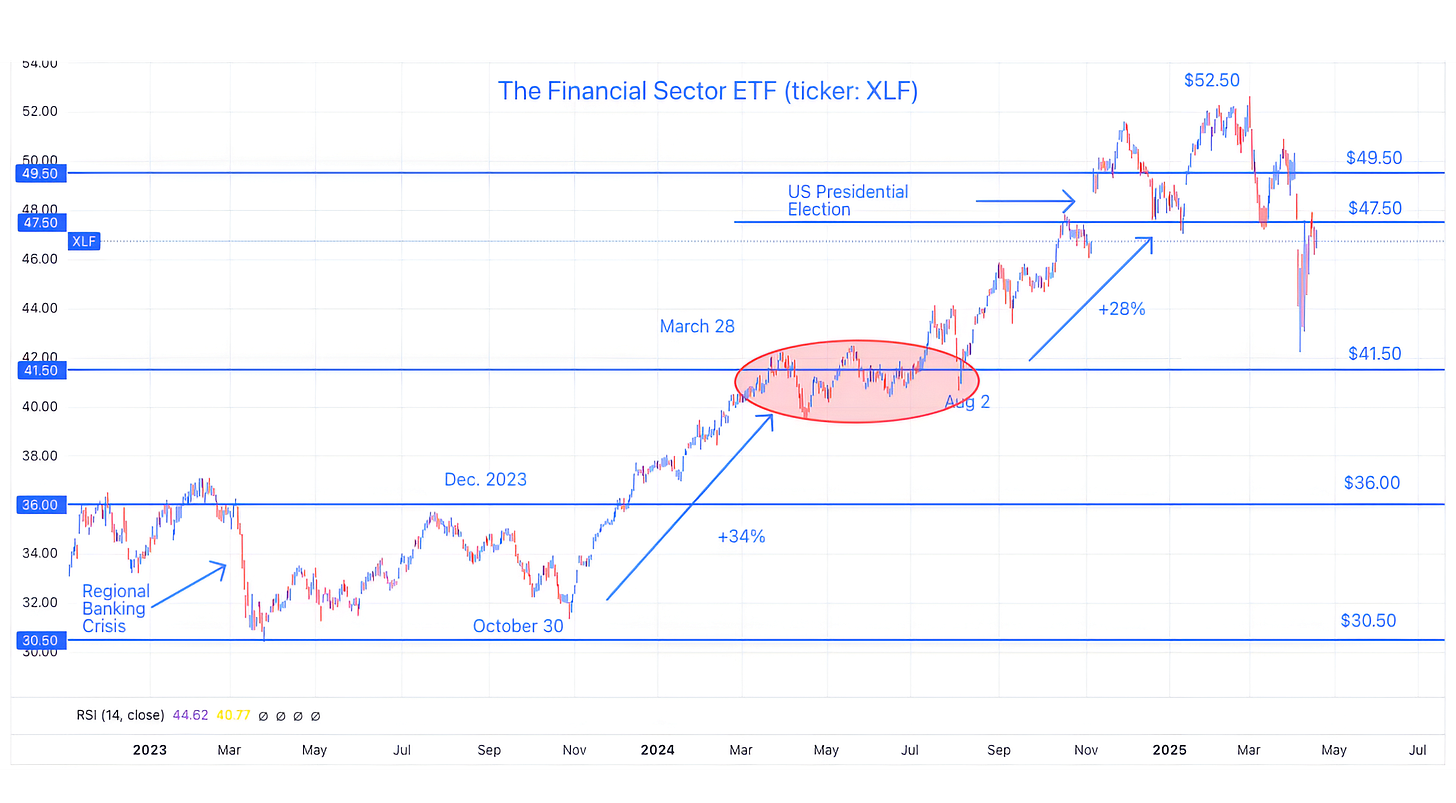
3. Watching Financials
Source: TradingView. Through year-to-date 2025.
The chart above shows the Financial Sector ETF (ticker: XLF).
While we have our views of how the market will evolve, we always check in with our market indicators to either confirm or invalidate our hypotheses.
One of our key market indicators is the financial sector.
The Financial Sector ETF is essentially trading right where it was just prior to the US Presidential election.
In our view, if it recaptures its post-Presidential election range (above $47.50), it would call into question our views of drying liquidity, a slowing economy and ultimately a retest of the equity market lows.
While the Financial Sector ETF remains below its post-Presidential election range our thesis and concerns of further equity market volatility remain valid.
(Past performance is not indicative of future results. This is not a recommendation to buy or sell any security and is not investment advice. Please do your own research and due diligence).
4. A Quick Update on Strategists’ Views…
Source: Bloomberg and Strategas. Through year-to-date 2025.
The chart above shows selected Wall Street Strategists’ current S&P 500 2025 year-end targets with their year-to-date changes.
We showed these at the end of last year (see chart 3 here, here and here) and simply wanted to provide an update.
(Past performance is not indicative of further results. This is not a recommendation to buy or sell any security and is not investment advice. Please do your own due diligence).
5. European Equities: Watching for an Opportunity
Source: TradingView. Through year-to-date 2025. Through year-to-date 2025.
The chart above shows the Vanguard Europe ETF (ticker: VGK).
As the European Equity ETF is once again at its 2021 high - we are watching for an opportunity to invest.
When the European Equity ETF surpassed its 2021 high in September 2024 and a month ago - it could not hold the north.
We think there’s a possibility that the third trip above the 2021 ceiling could be more sustainable:
Valuations in Europe in general are more attractive than those in the US and continue to trade a more significant discount to US equities than typical. (Absolutely and relatively cheap vs. history). That said - these valuations measures have not been catalysts for outperformance in the past.
We believe - and we’ve highlighted this in the past - that large European portfolio managers that have ended up overweight US equities - partially by design and partially due to US equity outperformance - are now bringing capital back to Europe. We provided a description of this dynamic in chart 3 here.
Given the tariff uncertainty, European companies will likely be beneficiaries.
The ECB cut rates today (Central Banks drive markets) and Germany is providing fiscal stimulus to support its NATO commitment.
We will watch the chart above and the chart of European Equity to US equity relative performance to potentially add to our European equity exposure.
Have a great weekend!
(Past performance is not indicative of future results. This is not a recommendation to buy or sell any security and is not investment advice. Please do your own research and due diligence).


