


Suspicious Minds...
The Fed provided more confusion: slower growth, higher inflation, same rate path and a QT taper. Positioning is bearish and equities rallied. Will it continue? Let's dig in...

It is easy to look at the Fed’s Summary of Economic Projections that showed lower growth, higher inflation and the same Fed Funds rate path as the December projections (chart 2), and conclude that the Fed is as confused about the potential outcomes of current policy as everyone else.
In our view, however, markets are singularly focused on the “tapering” of Quantitative Tightening.
Throughout all of last year (see chart 5 from January 2024 here), we questioned why equities were rallying during a period of Quantitative Tightening.
In every prior period of Quantitative Tightening, there had been equity volatility and drawdowns.
Why was 2024 different?
Our conclusion has been that:
stealth liquidity (see here, here, here, here, here, here, here, chart 4 here and here);
unprecedented non-emergency fiscal spending (chart 4 here); and
hyper-scaler data center investment (chart 4 here);
combined to offset the negative impact of Quantitative Tightening. (See the introduction here).
Yesterday, the Fed announced that it would “taper” (slow) the reduction of its balance sheet from $25 billion per month to $5 billion per month beginning in April.
Very simply, less (quantitative) tightening = easier.
In late 2021, we saw the reverse of this as the Fed “tapered” (slowed) the expansion of its balance sheet.
In mid-December, we wrote in the introduction (here):
“In our view, it is important to remember November 2021.
It was simply the hint that the Fed would accelerate the end of quantitative easing (which would in turn set the stage for the rate hike cycle) that halted the ascent in equities.
The Nasdaq 100 and Russell 2000 Small Caps peaked immediately.”
It is possible likely, yesterday’s announcement could pave the way for future Quantitative Easing (or any other balance sheet expansion by another name).
However, a significant difference between the tapering of Quantitative Tightening (“QT”) now and tapering Quantitative Easing (“QE”) in late 2021 is that, as stated above, over the last 18 months Quantitative Tightening has been largely offset by non-traditional (stealth) liquidity measures.
If the stealth liquidity measures are removed at the same time as QT is reduced, we would expect a less pronounced positive impact from the taper of QT than the negative impact from the QE taper in 2022.
Shortly after the US Presidential Election we wrote (here):
“We have increased the probability of a significant sell-off to 20-30% (here), but it is clear that we under-estimated the magnitude of the rally.
We would now call this a 30% chance of a 20-30% sell-off from a level of around 6000 in the S&P 500 leading the index back down to a range 4200-4800.
We see this occurring in the first half of 2025 and, in our view, it will most likely be met with a new round of quantitative easing (they may give it another name - but it will be Fed balance sheet expansion).”
We will see if this view remains accurate, in the meantime, we are viewing the rally with caution.
Given the noise around the removal of stealth liquidity, GDP growth, tariffs and other policy measures in the current environment, the market may want to see actual easing and liquidity before a sustainable rally can occur.
Suspicious Minds.

1. The Nasdaq 100 ETF: Not Back to Its 200-Day

Source: TradingView. Through year-to-date 2025.
The chart above shows the Nasdaq 100 ETF (ticker: QQQ) with its 200-day moving average (curved light blue line).
On Tuesday, we showed that the S&P 500 ETF had rallied back to its 200-day moving average.
We find it interesting (informative?) that the Nasdaq 100 - which was the leader during 2023 and first half of 2024 - has not made it back to the underside of its 200-day moving average.
In our view, we are in a “guilty until proven innocent” market environment.
As a result, even if the S&P 500 were to rally back above its 200-day moving average, we would want to see the move in the S&P 500 “confirmed” by similar accomplishment in the Nasdaq 100.
In our experience, the leap back above the 200-day moving average becomes more difficult the longer price remains below.
That doesn’t mean that it can’t or won’t happen - it just means that we remain suspicious of any rally.
(This is not a recommendation to buy or sell any security and is not investment advice. Past performance is not indicative of future results. Please do your own research and due diligence).
2. The Summary of Economic Projections (“SEP”)
Source: Oxford Economics / Refinitiv Datastream. Through year-to-date 2025.
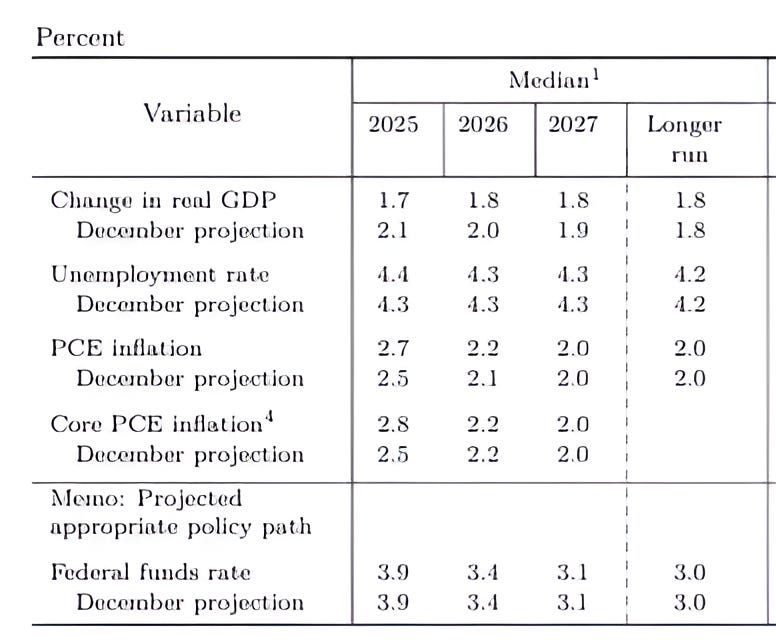
The chart above is the Fed’s Summary of Economic Projections (“SEP”) that compares yesterday’s release with the December outlook.
A quick summary:
Cut 2025 GDP growth projection from 2.1% to 1.7%;
Raised unemployment forecast from 4.3% to 4.4%;
Raised PCE inflation forecast from 2.5% to 2.7%;
Raised Core PCE inflation forecast from 2.5% to 2.8%;
Maintained Fed Funds projection: 2 cuts in 2025 and 2026.
According to Nick Timiraos, who many believe has extra insight into Fed thinking:
“What the Fed's economic projections show (but its rate projections do not, yet) is that the outlook has changed a lot in just three months, and the bar for cuts has gone up.
18 of 19 officials have inflation risks to the upside. The labor market will likely need to weaken to get cuts from here.”
The Fed has said that they want to have zero percent interest rates before implementing Quantitative Easing again.
The statement above makes it seem as though there will be a high hurdle to cutting rates in the current environment as inflation remains a concern.
In our view, the Fed’s balance sheet expansion that we are expecting later this year likely will not be called Quantitative Easing so we will need to watch carefully.
Finally, David Rosenberg, the former Chief Economist at Merrill Lynch reminds us:
“The Fed’s 4.4% unemployment rate call for year-end would take it [unemployment] 100 basis points above the cycle low.
Back to 1948, that has never happened without an NBER-defined recession.”
(Past performance is not indicative of future results. This is not a recommendation to buy or sell any security and is not investment advice. Please do your own due diligence).
3. Out of US Equities and Into Europe / UK
Source: Bank of America Fund Managers Survey. Through year-to-date 2025.
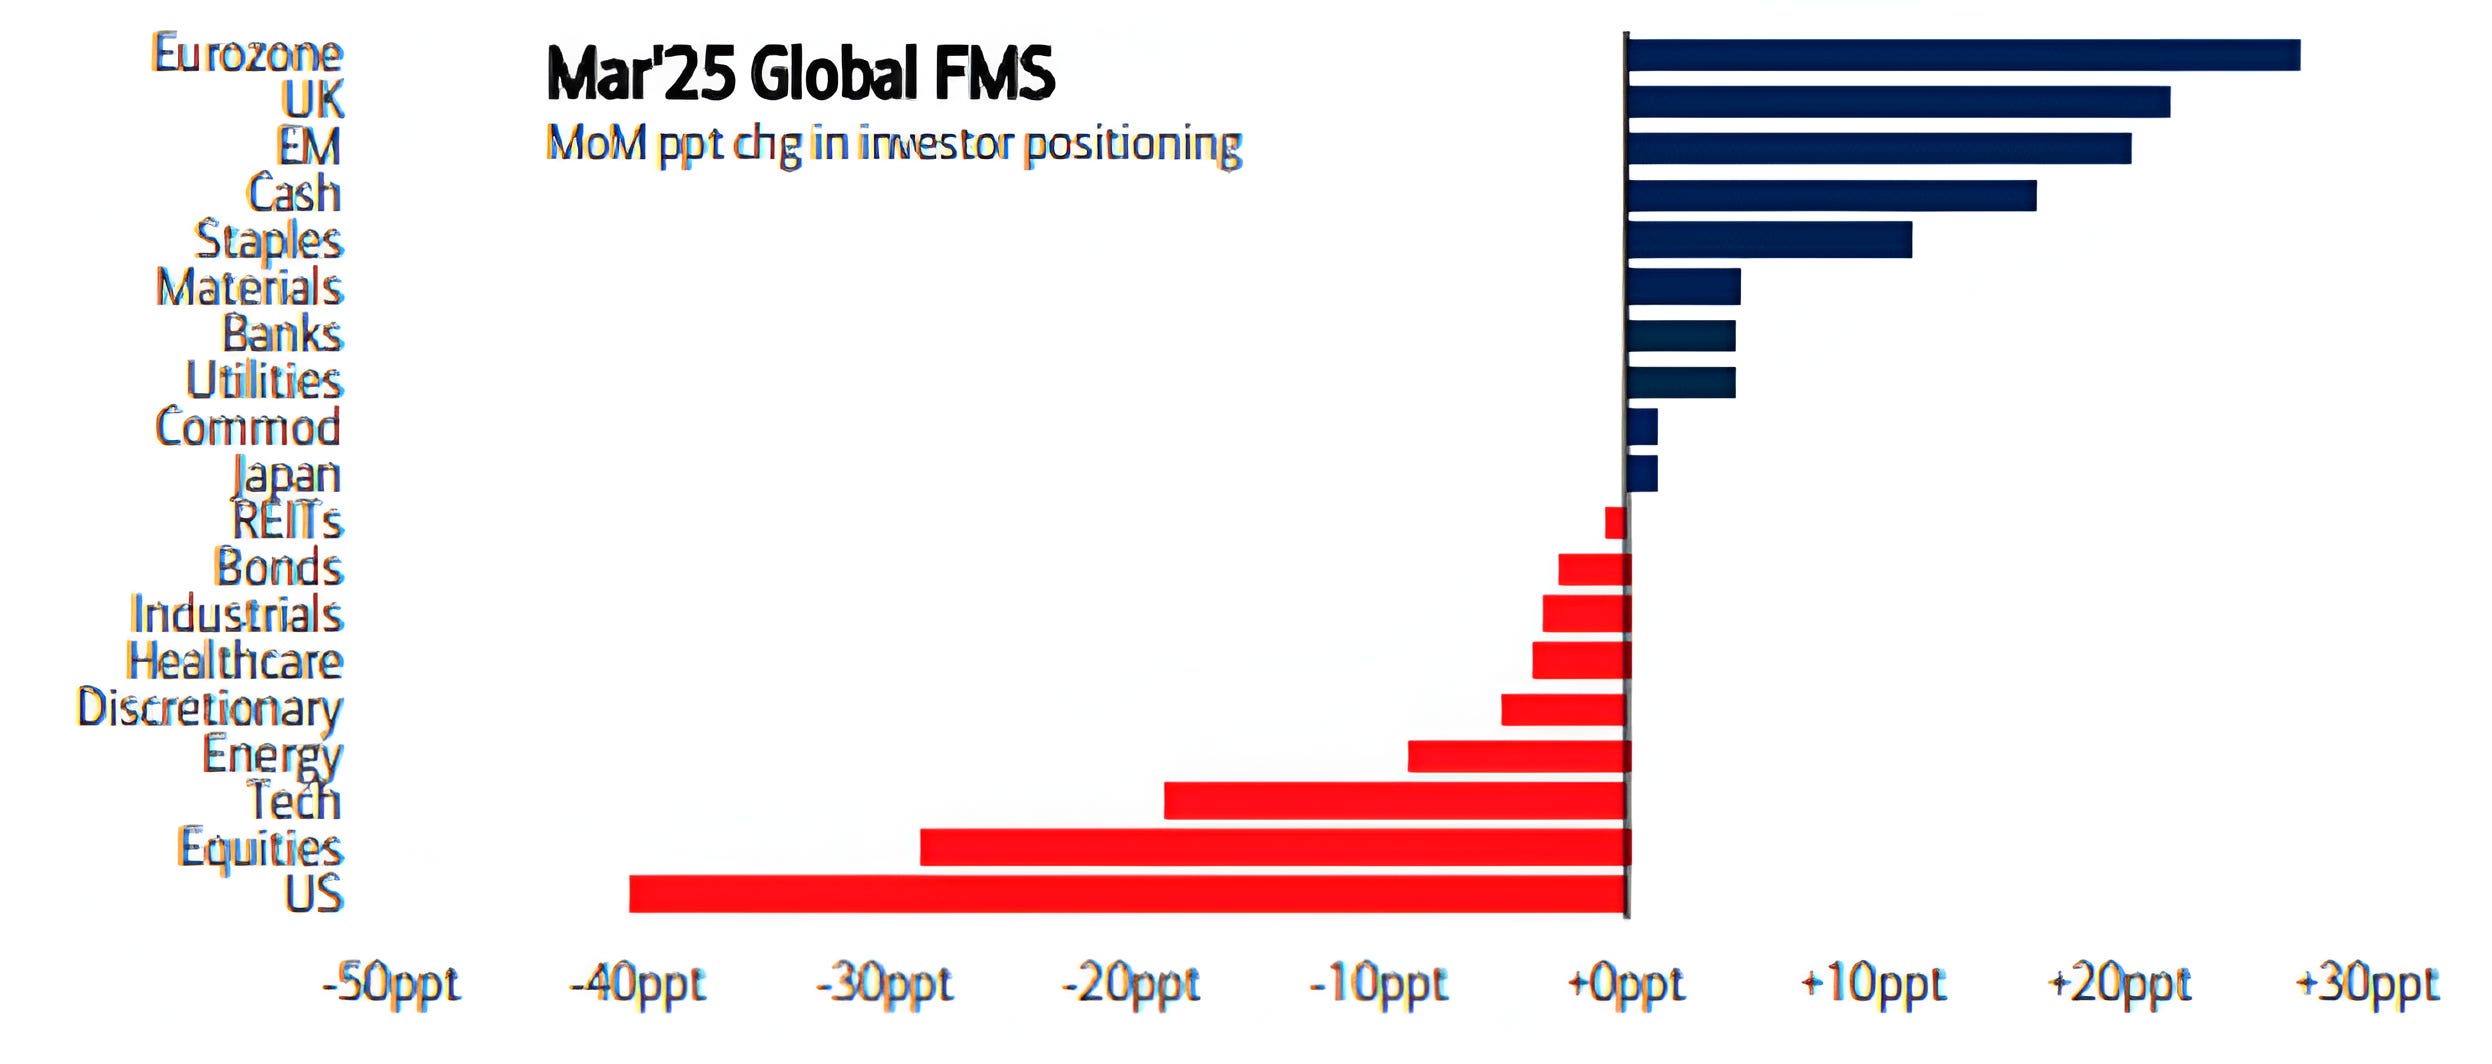
The chart above shows the results of the Bank of America Fund Managers Survey for March and reflects the month over month percentage change in positioning across different asset classes.
March showed the biggest drop in the allocation to US equities on record.
While this could be seen (along with negative sentiment data) by a contrarian as bullish, we have an alternative hypothesis.
Notice the large increase to European and UK equities (the top two bars).
What if global or predominantly European equity managers had been overweight US equities for the past two years to catch the tailwind of US equity outperformance?
The fund managers are now (due to performance) massively out of line with their target allocations, underweight Europe, overweight US (specifically Mag 7 and Tech) and are trailing their benchmarks by 10%+.
Every day, there are dozens of Portfolio Managers in the same position - waiting, hoping for the Mag 7 to bounce so they can get out with a little less permanent damage.
It’s now near the end of Q1 2025 and it’s time to report performance.
The portfolio managers need to rip the band aid, take their pain and reallocate in line with their target weights.
Maybe, they even over allocate away from the US and add in some China and EM for good measure hoping to make up some of the lost performance.
This may be what the chart above is reflecting and if this is what is happening, this money is not coming back to the US any time soon.
In other words, despite the big move out of US equities, it may not be contrarian, it may be structural.
(Past performance is not indicative of future results. This is not a recommendation to buy or sell any security and is not investment advice. Please do your own research and due diligence).
4. Oil
Source: Opensquare Capital. Through year-to-date 2025.
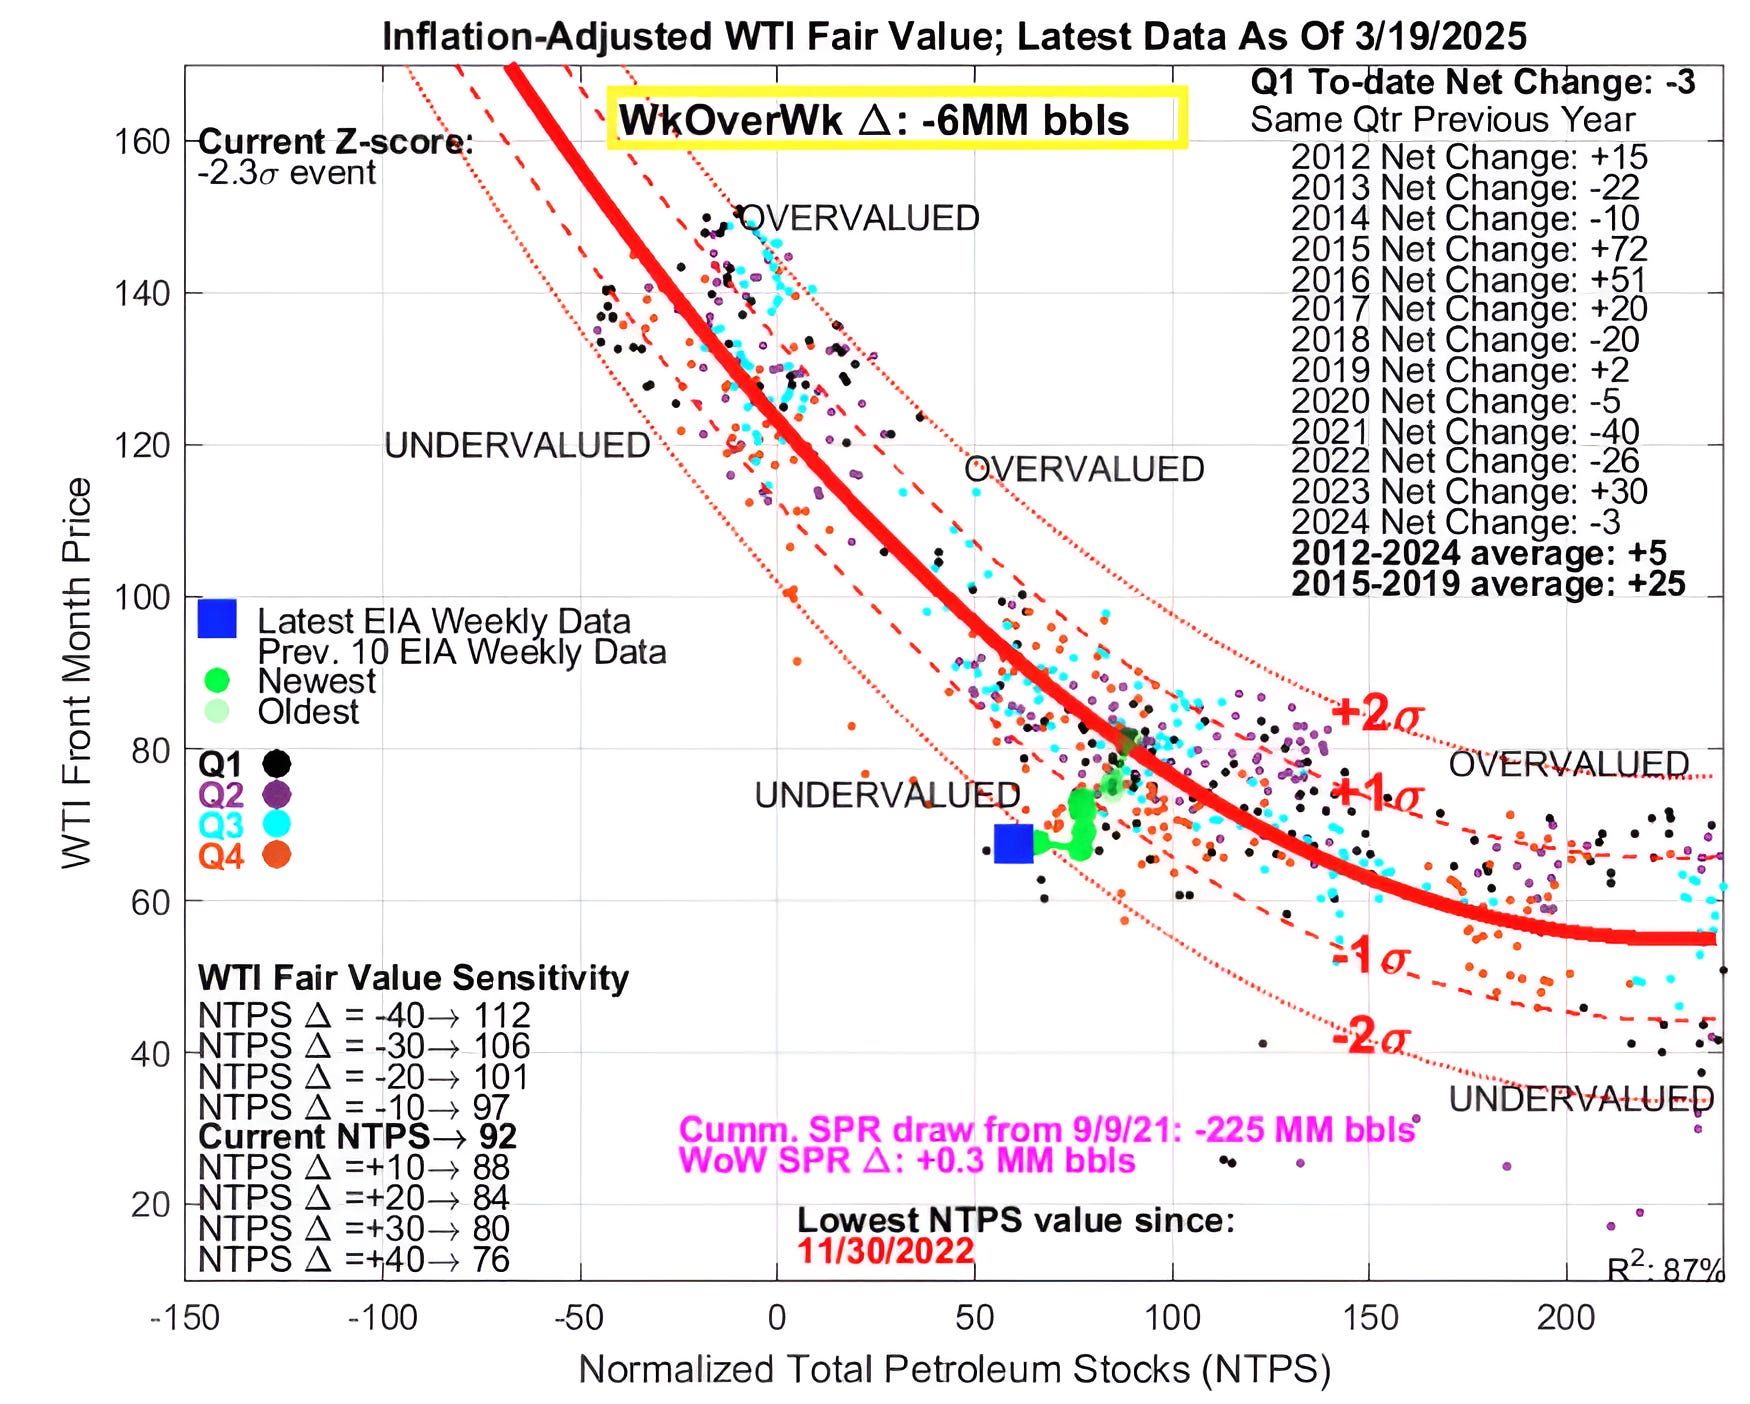
The chart above shows the price of Oil Futures vs. Oil Inventory.
Essentially, it concludes that total commercial oil inventory was down 6 million barrels week over week and, based on that and normalized petroleum inventory, the implied fair value for West Texas Intermediate Crude is closer to $92 vs. $68 where it’s currently trading.
This is likely overly bullish in our view.
Why am I showing this?
I recently saw an interview with Scott Sheffield, the CEO of Pioneer Natural Resources, the top Permian Basin producer, that sold to Exxon last year, (here) that caught my attention. In the interview, Scott Sheffield said:
“The reason why Pioneer sold is that we were running out of tier 1 inventory. Everyone is running out of tier 1 inventory.
The best inventory is going to be run out of Pioneer by 2028 and tier 2 by 2032.”
I was speaking an owner of data centers recently. He said he was bullish natural gas and natural gas pipelines because this would be the bridge fuel to the nuclear power that will eventually power data-centers.
Frequent readers know I am generally bullish oil (full caveat).
I have added some high yielding oil, pipeline and natural gas companies to our portfolios as I like to be paid to wait (again with the caveat that I am an oil bull). (Do your own homework).
(Past performance is not indicative of further results. This is not a recommendation to buy or sell any security and is not investment advice. Please do your own due diligence).
5. So, We’ve Got this Going for Us, Which is Nice…
Source: Carson Investment Research / Ryan Detrick. Through year-to-date 2025.
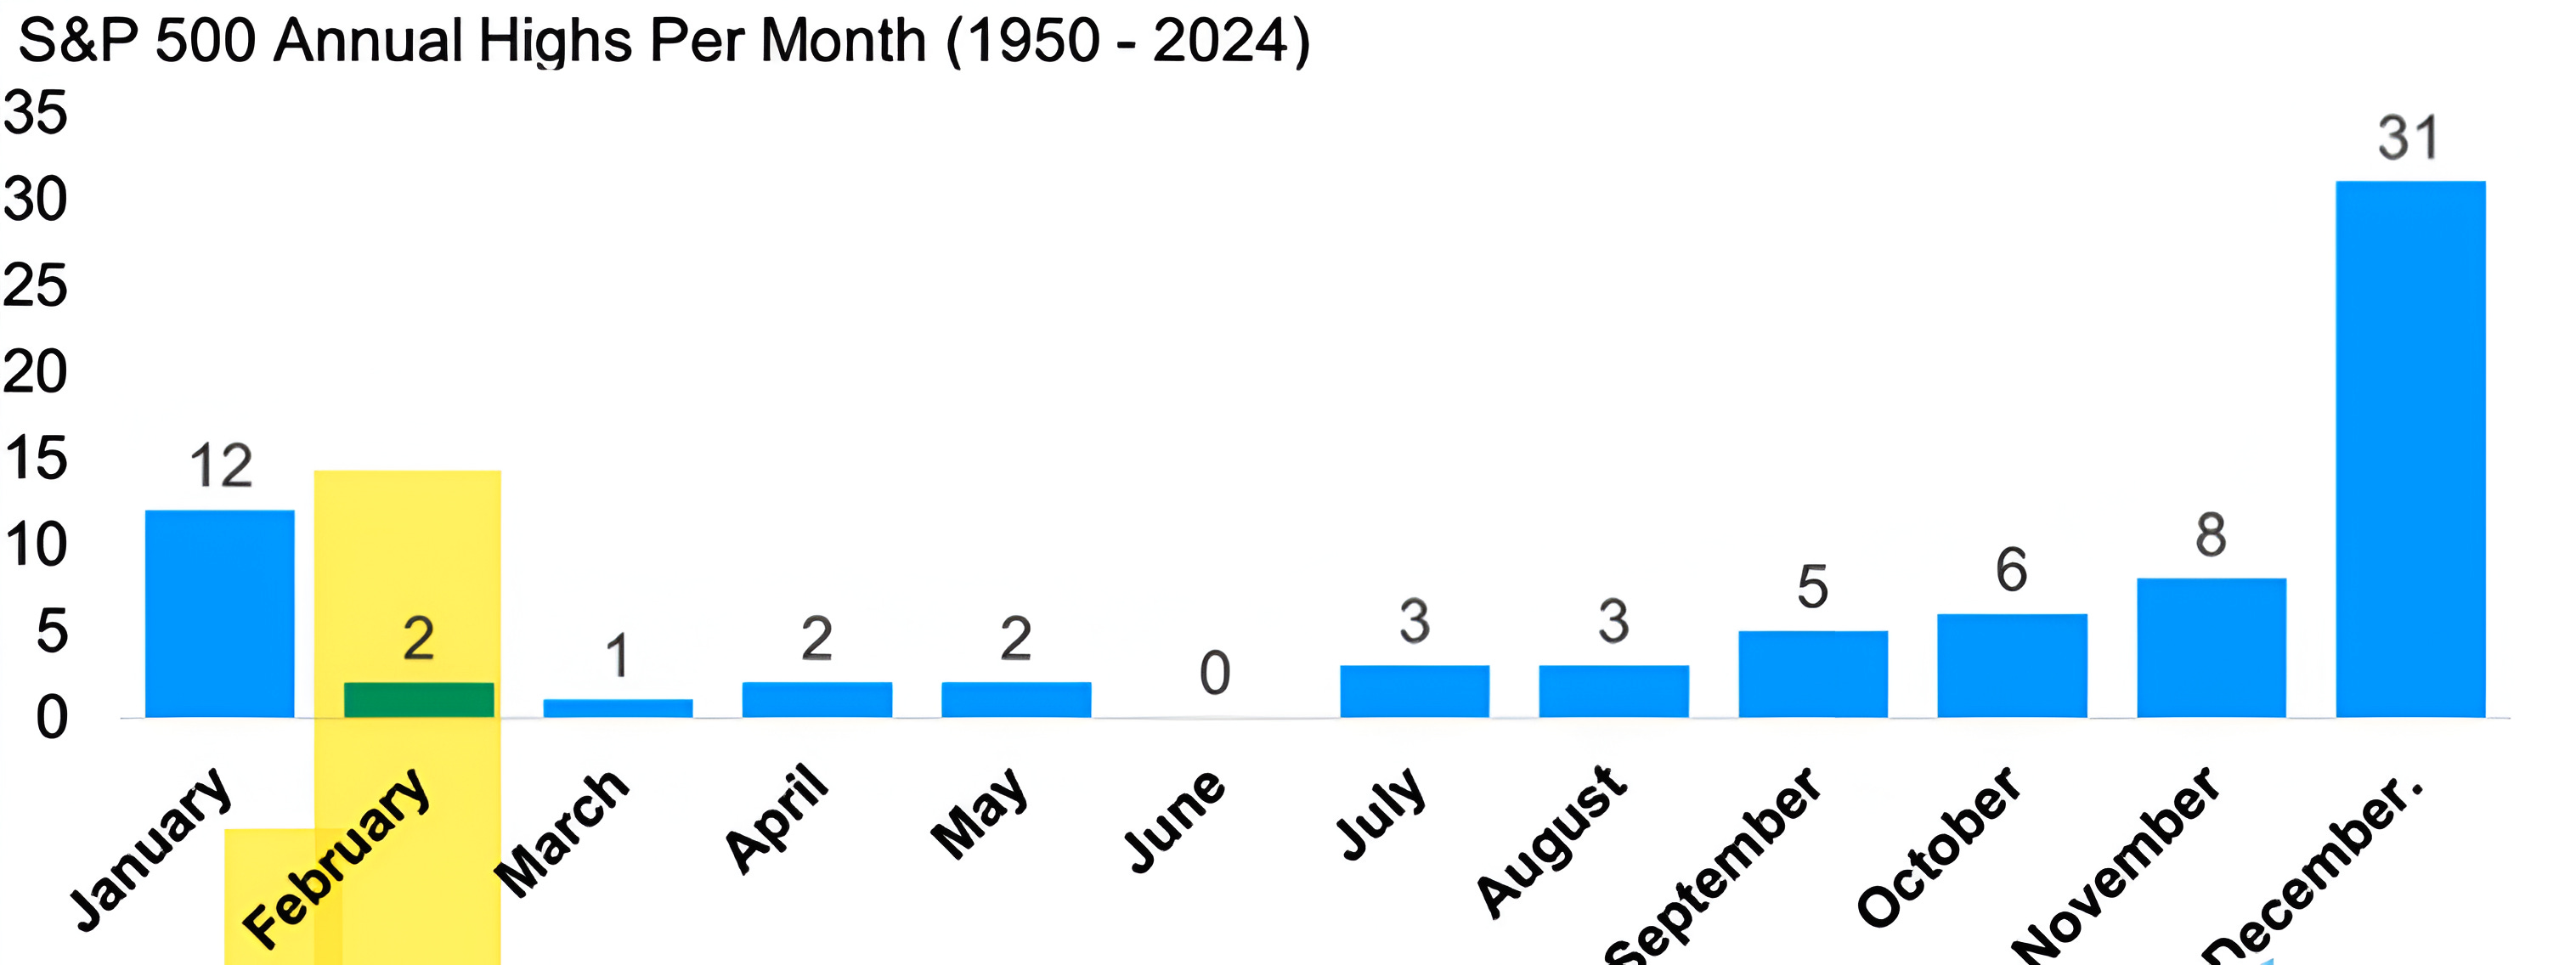
The chart above shows the number of times that the S&P 500 has achieved its high for the year in each month since 1950.
After hitting an all-time high on February 19, the S&P 500 has traded down.
Over the past 74 years, the S&P 500 has only reached its annual peak in February 2 times.
While this isn’t information that I would invest on, looking at the chart, it reflects the US equity market strength from September through January (the year-end rally).
In our view, after a sell-off in the first half, the Fed will come to the rescue with some form of balance sheet expansion. Equities will rally.
Will they hit a new high? Perhaps.
I will buy a beer for anyone (the next time I see you) that emails me the reference in the headline. Have a great weekend!
(Past performance is not indicative of future results. This is not a recommendation to buy or sell any security and is not investment advice. Please do your own research and due diligence).